MAAP #134: Agriculture And Deforestation In The Peruvian Amazon
March 9, 2021
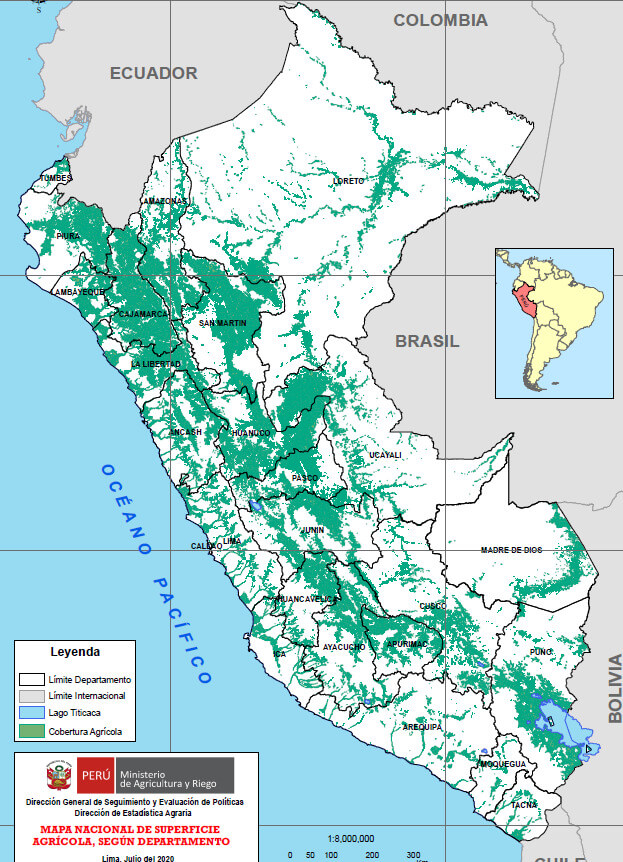
For the first time, Peru has a detailed National Agricultural Area Map.
This unique map, produced with high-resolution satellite imagery, was published by the Peruvian Ministry of Agrarian Development (MIDAGRI) in January.*
This map reveals that the agricultural area at the national level is 11.6 million hectares, as of 2018.
Here, we analyze this new information in relation to annual forest loss data, generated by the Peruvian Environment Ministry (Geobosques).
The goal is to better understand the critical link between agriculture and deforestation in the Peruvian Amazon.
Specifically, we analyze the agricultural area of 2018 in relation to the preceding forest loss between 2001 and 2017.
Below are two main sections:
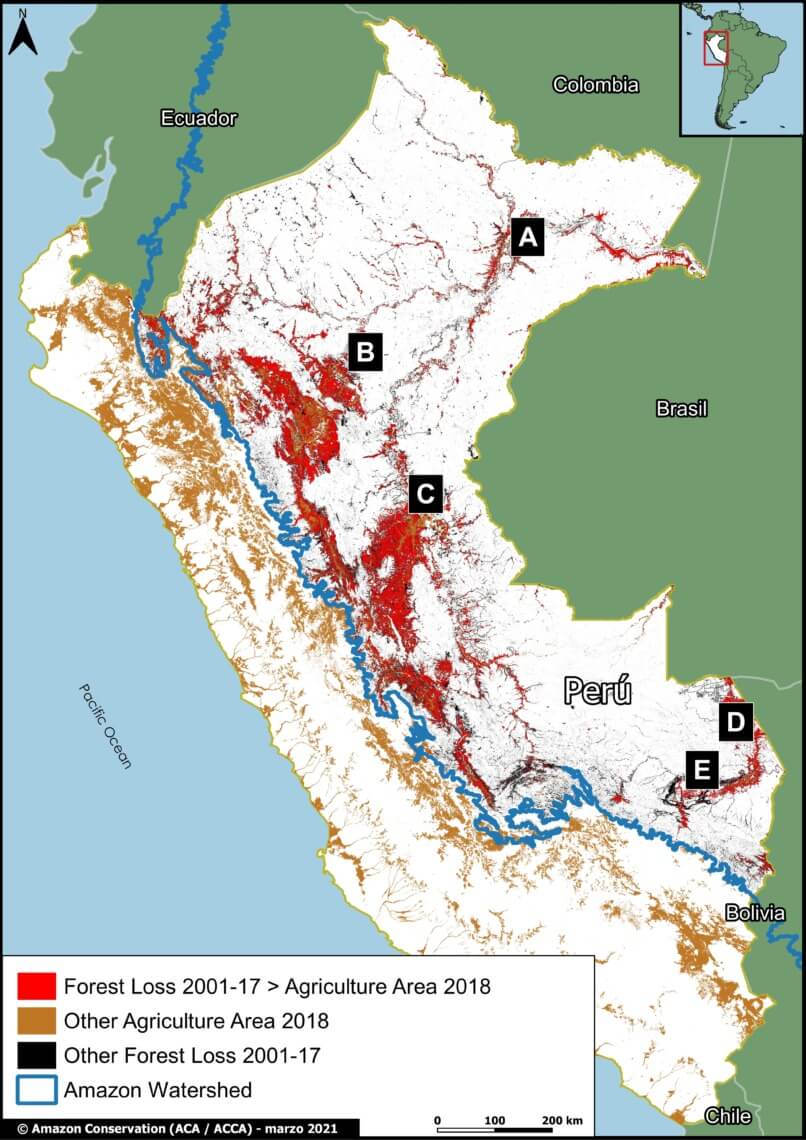
First, we present our Base Map that illustrates the major results.
Second, we show a series of zoomed images of select areas to illustrate key results in detail. These areas include major deforestation events related to oil palm, cacao, and other crops.
Major Results
- We found that 43% (4.9 million hectares) of Peru’s total agricultural area in 2018 was located in the Amazon basin.
- Of these Amazonian agricultural areas, more than 1.1 million hectares (24%) came from forest lost between 2001 and 2017 (indicated in red on the Base Map).
- Expressed another way, over half (56%) of the forest loss in the Peruvian Amazon between 2001 and 2017 corresponds to an agricultural area in 2018.
- The Base Map also shows, in brown, the agricultural area that is not linked to recent forest loss. The vast majority is located outside the Amazon basin (western Peru).
- Finally, the Base Map shows, in black, the recent forest loss not linked to agriculture. Much of this loss corresponds to gold mining (southeastern Peru), logging roads, and natural loss such as landslides.
Zooms of Key Areas
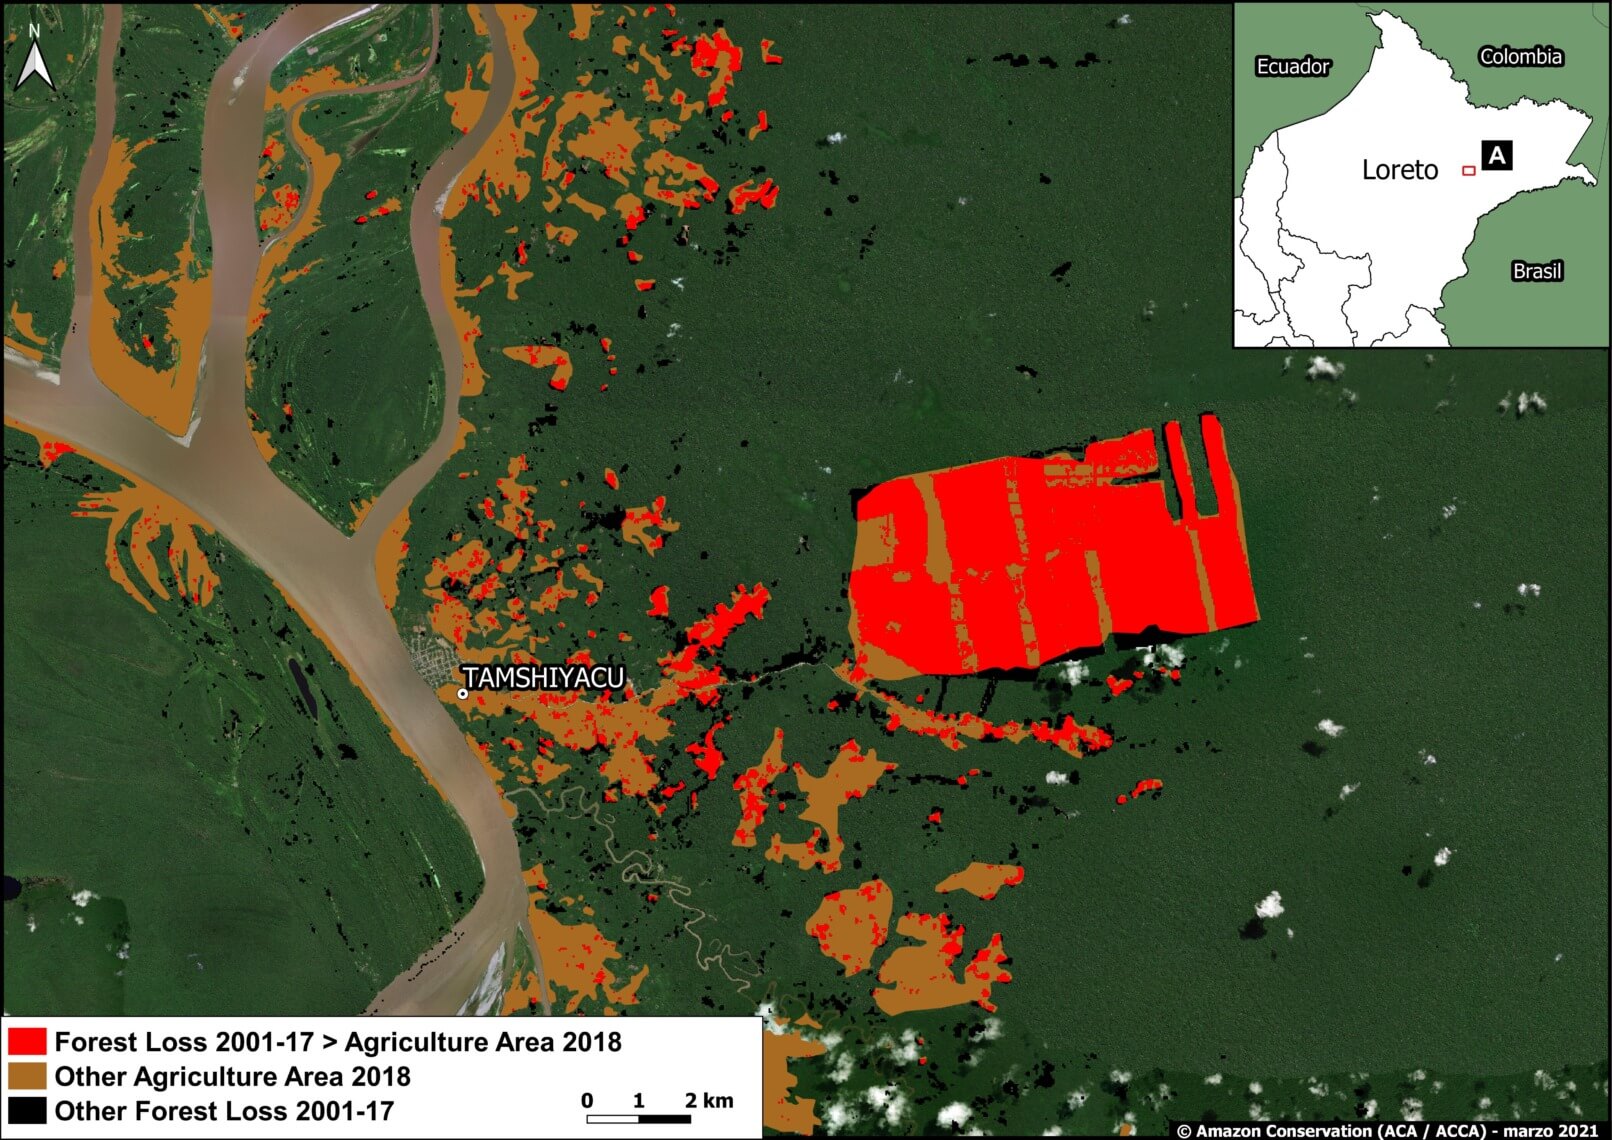
A. United Cacao (Loreto)
Image A shows the large-scale deforestation associated with the company United Cacao between 2013 and 2016, in the Loreto region (MAAP # 128). The clearing, as the name indicates, was for the installation of Peru’s first and only industrial-style cacao plantation. In total, the deforestation for the plantation reached 2,380 hectares.
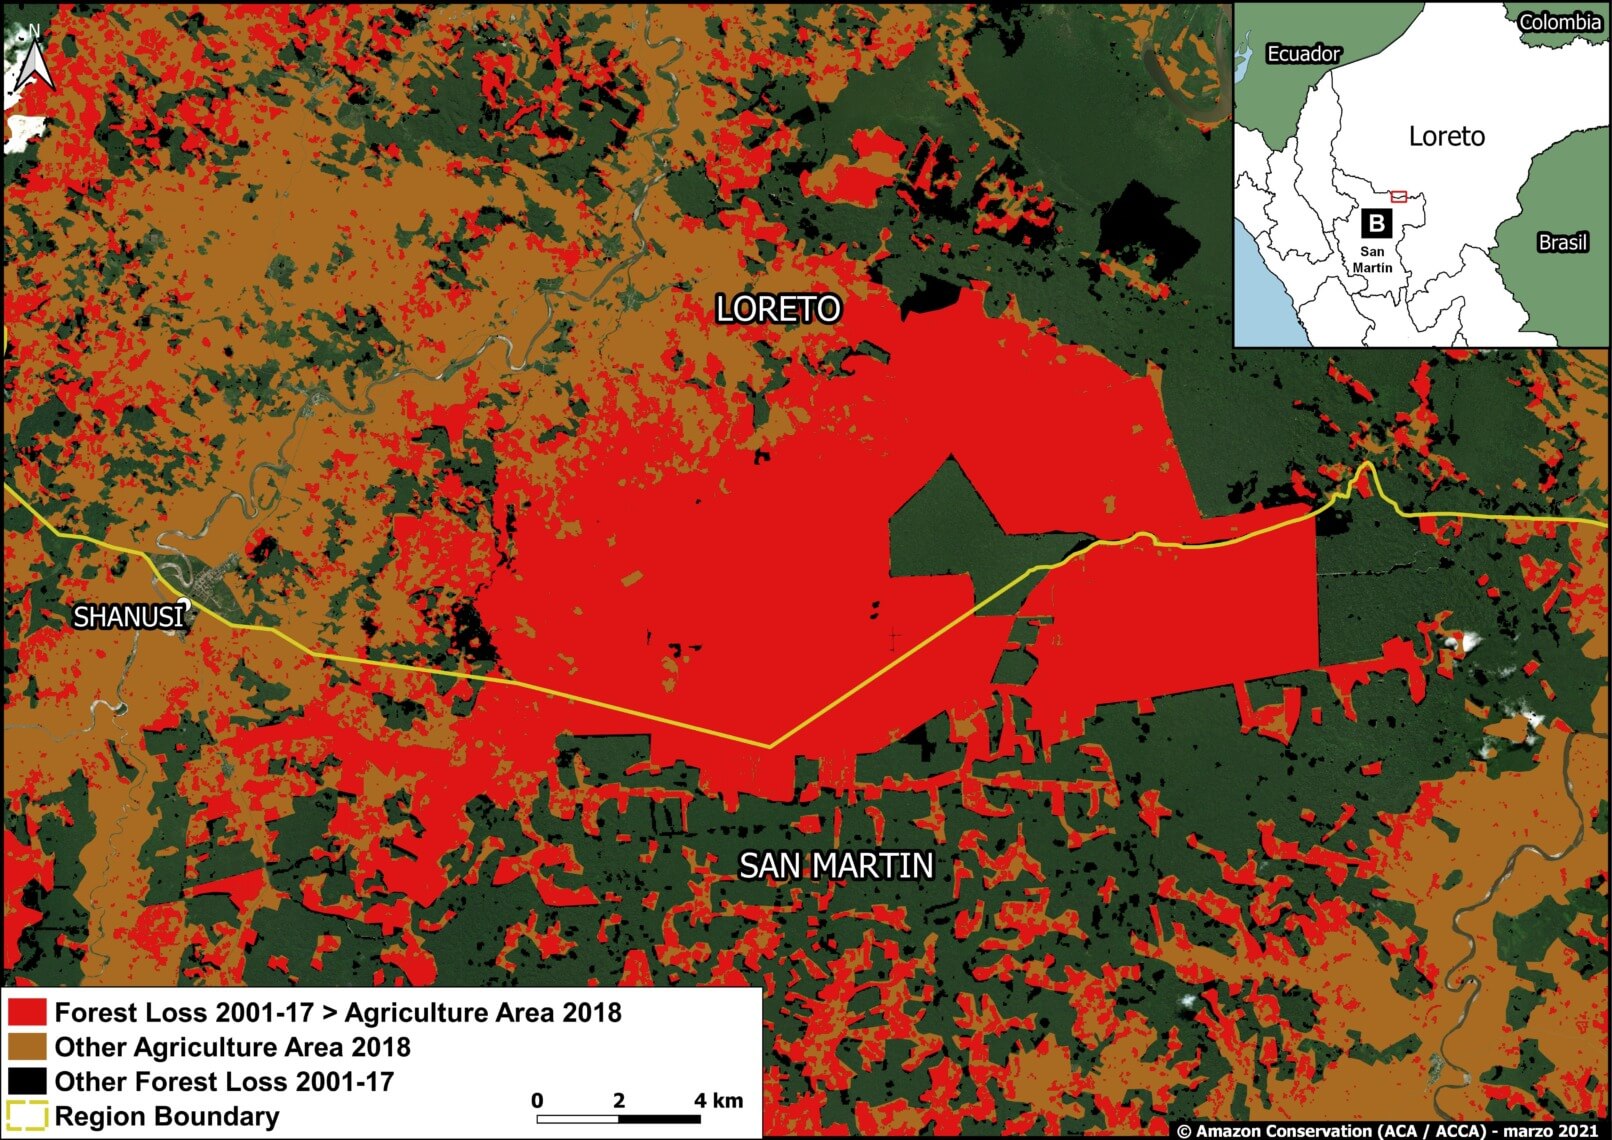
B. Oil Palm (Shanusi, Loreto)
Image B shows the large-scale deforestation of more than 16,800 hectares associated with oil palm plantations between 2006 and 2015, along the border of the Loreto and San Martin regions (MAAP #116). Of this total, the deforestation of 6,975 hectares was linked to two plantations managed by the company Grupo Palmas company. The remainder occurred in the private areas surrounding the company’s plantations.
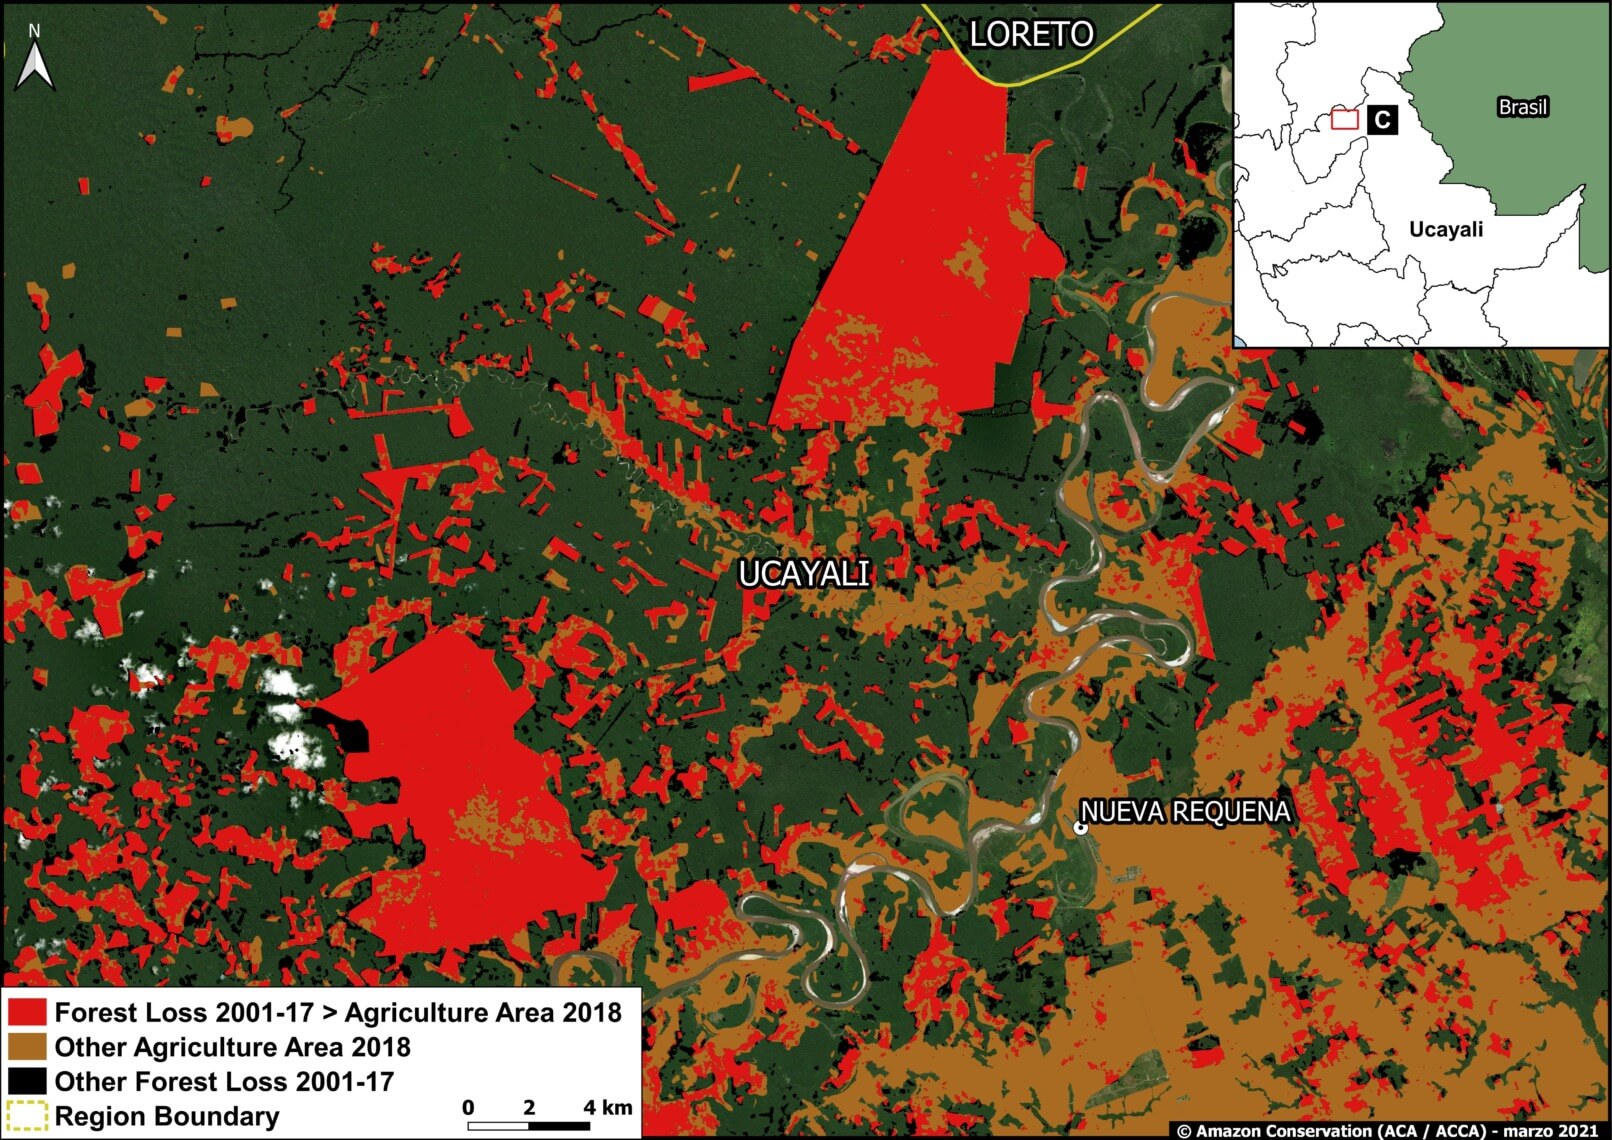
C. Oil Palm (Ucayali)
Image C shows the large-scale deforestation of more than 12,000 hectares for two oil palm plantations between 2011 and 2015, in the Ucayali region (MAAP #41).
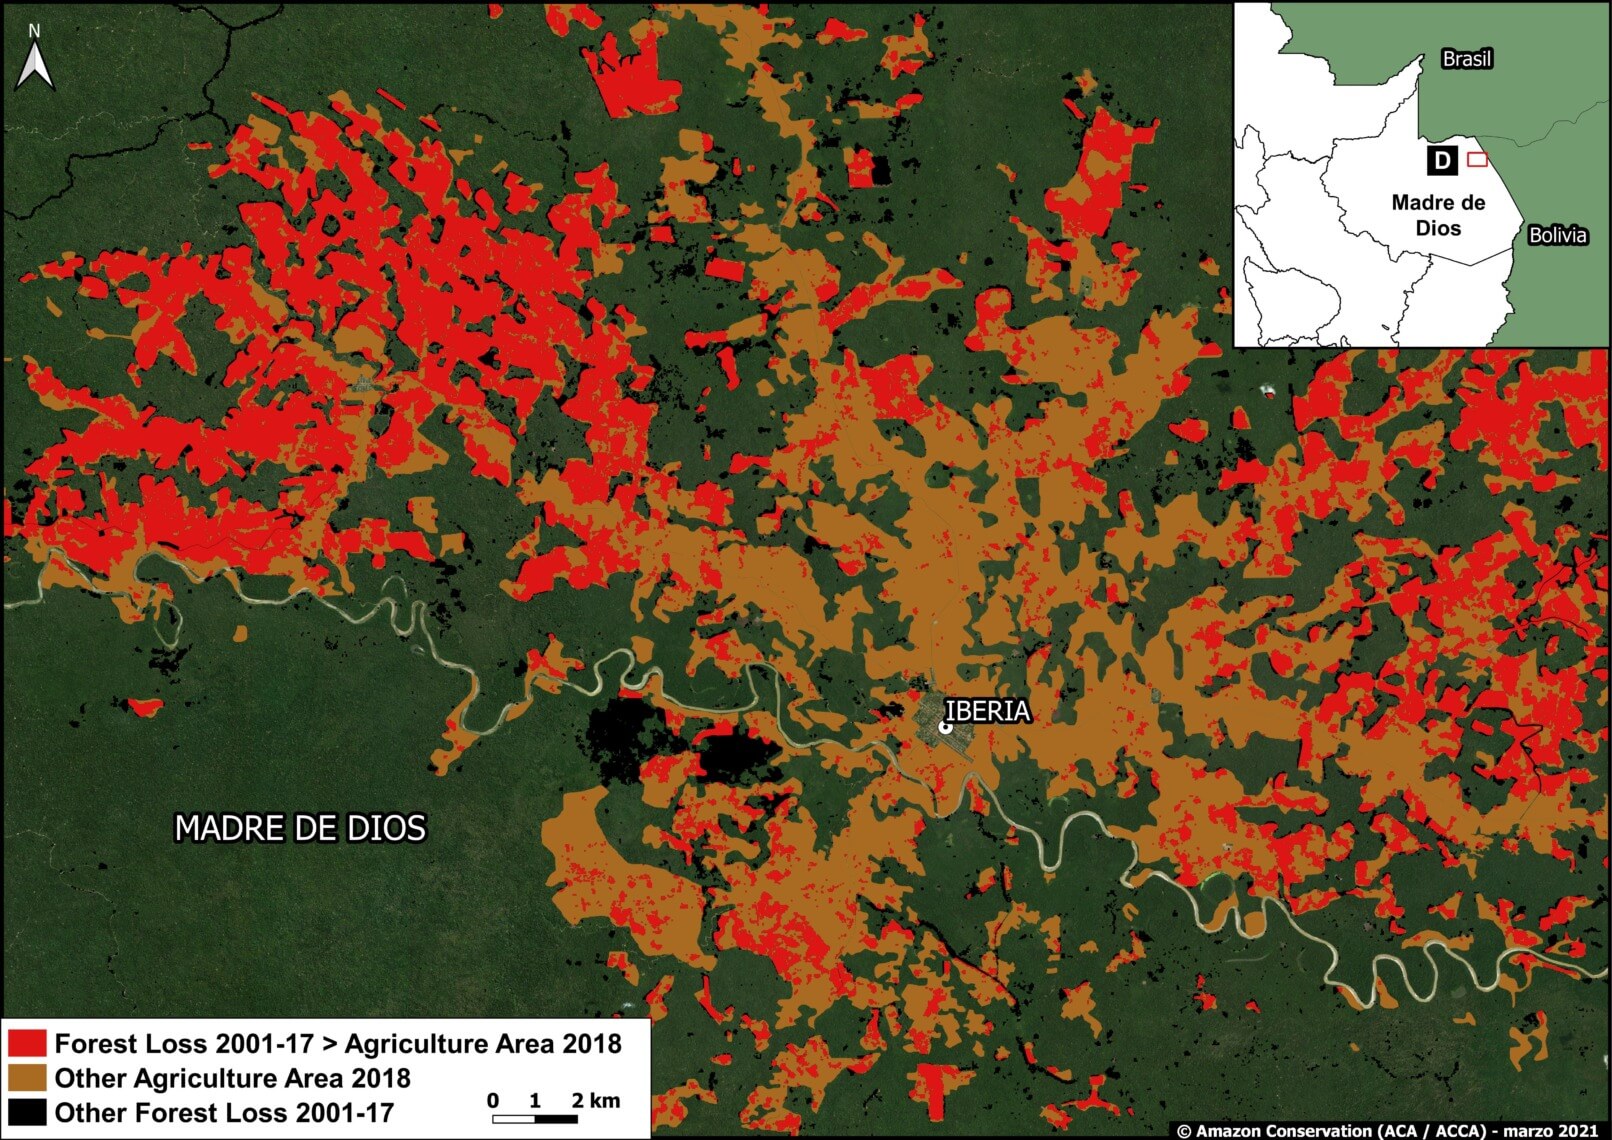
D. Iberia (Madre de Dios)
Image D shows the expanding agriculture-related deforestation around the town of Iberia, near the border with Brazil and Bolivia (MAAP #75). The major cause, according to local sources, is the increase in corn, papaya, and cacao plantations. We have documented the deforestation of more than 3,000 hectares in this area since 2014.
E. Zona Minera (Madre de Dios)
Finally, Image E shows deforestation in the gold mining hotspot known as La Pampa, in the Madre de Dios region. The non-agricultural deforestation in the center is the major illegal gold mining front. Around that area, and along the Interoceanic Highway, there is extensive agriculture-related deforestation.

*Notes and Methodology
According to MIDAGRI, the National Agricultural Area Map was “generated based on satellite images from RapidEye and later updated with satellite images from Sentinel-2 and the Google Earth platform, which allowed the mapping and precise measurement of the agricultural surface throughout the national territory.”
The data include “agricultural land with cultivation and without cultivation.” We assume that these data include cattle pasture.
The identification and quantification of deforested areas (2001-2017) that correspond to agricultural area in 2018 results from the analysis carried out in GIS by the superposition of both geospatial layers (MINAM and MIDAGRI).
Amazonian agricultural areas that came from forest lost between 2001 and 2017 = 1,185,722 hectares (indicated in red on the Base Map).
Acknowledgments
We thank E. Ortiz (AAF), S. Novoa (ACCA) and G. Palacios for their helpful comments on this report.
Citation
Vale Costa H, Finer M (2021) Agriculture and Deforestation in the Peruvian Amazon. MAAP: 134.
 Loading...