MAAP #113: Satellites Reveal What Fueled Brazilian Amazon Fires
November 13, 2019
As part of our ongoing coverage, we present two key new findings about the Brazilian Amazon fires that captured the world’s attention in August (see our novel satellite-based methodology below).
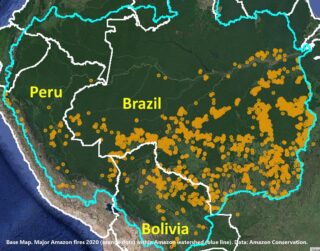
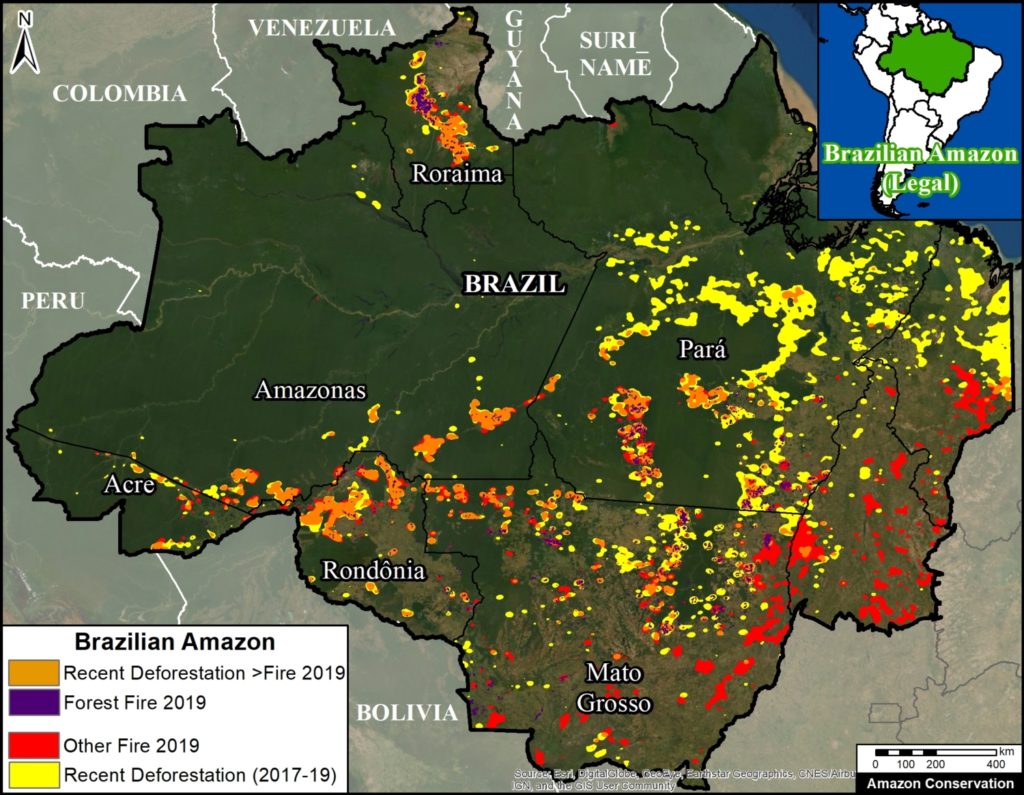
First, we found that many of the fires, covering over 450,000 hectares, burned areas recently deforested since 2017 (orange in Base Map). That is a massive area equivalent to over a million acres (or 830,000 American football fields), mostly in the states Amazonas, Rondônia, and Pará.
Importantly, 65% (298,000 hectares) of this area was both deforested and burned this year, 2019.
Second, we found 160,400 hectares of primary forest burned in 2019 (purple in Base Map).* Most of these areas surround deforested lands in the states of Mato Grosso and Pará, and were likely pasture or agricultural fires that escaped into the forest.
As far as we know, these are the first precise estimates based on detailed analysis of satellite imagery. Other estimates based solely on fire alerts tend to greatly overestimate burned areas due to their large spatial resolution.
Below we present a series of satellite time-lapse videos showing examples of the different types of fires we documented.
Policy Implications
The policy implications of these findings are critically important: national and international focus needs to be on minimizing new deforestation, in addition to fire prevention and management.
That is, we need to recognize that many of the fires are in fact a lagging indicator of previous deforestation, thus to minimize fires we need to minimize deforestation.
For example, one of the leading deforestation drivers in the Brazilian Amazon is cattle ranching (1, 2, 3). What measures can be taken to prevent the further expansion of the ranching frontier?
Satellite Time-lapse Videos
Deforestation Followed by Fire
Video A shows the deforestation of 1,760 hectares (4,350 acres) in Mato Grosso state in 2019 (May to July), followed by fires in August. Planet link.
Video B shows the deforestation of 650 hectares (1,600 acres) in Rondônia state in 2019 (April to July), followed by fire in August. Planet link.
Deforestation Caused by Fire
Videos C-D show 2019 fires burning primary or secondary forest surrounding recently or previously cleared areas.
*Notes
In addition to the finding of 160,400 hectares of primary forest burned in 2019, we also found: 25,800 hectares of secondary forest burned in 2019;
35,640 hectares of primary forest burned in the northern state of Roraima in March 2019 (plus an additional 16,500 hectares of secondary forest.
Methodology
Deforestation Fires
We created two “hotspots” layers, one for deforestation and the other for fires, by conducting a kernel density analysis. This type of analysis calculates the magnitude per unit area of a particular phenomenon, in this case forest loss alerts (proxy for deforestation) and temperature anomaly alerts (proxy for fires)
Specifically, we used the following data three sets:
2019 GLAD alert forest loss data (30 meter resolution) from the University of Maryland and available on Global Forest Watch.
2017 and 2018 forest loss data (30 meter resolution) from the University of Maryland and available on Global Forest Watch (4).
NASA’s Fire Information for Resource Management System (FIRMS) MODIS-based fire alert data (1 km resolution).
We conducted the analysis using the Kernel Density tool from Spatial Analyst Tool Box of ArcGIS, using the following parameters:
Search Radius: 15000 layer units (meters)
Kernel Density Function: Quartic kernel function
Cell Size in the map: 200 x 200 meters (4 hectares)
Everything else was left to the default setting.
For the Base Map, we used the following concentration percentages: Medium: 10%-25%; High: 26%-50%; Very High: >50%. We then combined all three categories into one color (yellow for deforestation and red for fire). Orange indicates areas where both layers overlap. As background layer, we also included pre-2019 deforestation data from Brazil’s PRODES system.
We prioritized the orange overalp areas for further analysis. For the major orange areas in Rondônia, Amazonas, Mato Grosso, Acre, and Pará, we conducted a visual analysis using the satellite company Planet’s online portal, which includes an extensive archive of Planet, RapidEye, Sentinel-2, and Landsat data. Using the archive, we identified areas that we visually confirmed a) were deforested in 2017-19 and b) were later burned in 2019 between July and September. We then used the area measure tool to estimate the size of these areas, which ranged from large plantations ( ~1,000 hectares) to many smaller areas scattered across the focal landscape.
Forest Fires:
To estimate forests burned in 2019 we combined analysis of several datasets. First, we started with 30 meter resolution ‘burn scar’ data produced by INPE (National Institute for Space Research) DETER alerts, updated through October 2019. In order to avoid overlapping areas, we eliminated alerts previously reported from 2016 to 2018, and alerts from other land use categories (selective logging, deforestation, degradation and mining, and other). Second, we eliminated previously reported 2001-18 forest loss from University of Maryland and INPE (PRODES). Third, to distinguish burning of primary and secondary forest, we incorporated primary forest data from the University of Maryland (5).
References
- Krauss C, Yaffe-Bellany D, Simões M (2019) Why Amazon Fires Keep Raging 10 Years After a Deal to End Them. New York Times. https://www.nytimes.com/2019/10/10/world/americas/amazon-fires-brazil-cattle.html
- Kelly M, Cahlan S (2019) The Brazilian Amazon is still burning. Who is responsible? Washington Post. https://www.washingtonpost.com/politics/2019/10/07/brazilian-amazon-is-still-burning-who-is-responsible/#click=https://t.co/q2XkSQWQ77
- Al Jazeera (2019) See How Beef Is Destroying The Amazon. https://www.youtube.com/watch?v=9o2M_KL8X6g&feature=youtu.be
- Hansen, M. C., P. V. Potapov, R. Moore, M. Hancher, S. A. Turubanova, A. Tyukavina, D. Thau, S. V. Stehman, S. J. Goetz, T. R. Loveland, A. Kommareddy, A. Egorov, L. Chini, C. O. Justice, and J. R. G. Townshend. 2013. “High-Resolution Global Maps of 21st-Century Forest Cover Change.” Science 342 (15 November): 850–53.
- Turubanova S., Potapov P., Tyukavina, A., and Hansen M. (2018) Ongoing primary forest loss in Brazil, Democratic Republic of the Congo, and Indonesia. Environmental Research Letters https://doi.org/10.1088/1748-9326/aacd1c
Acknowledgements
This work was supported by the following major funders: MacArthur Foundation, International Conservation Fund of Canada (ICFC), Norwegian Agency for Development Cooperation (NORAD), Metabolic Studio, and Global Forest Watch Small Grants Fund (WRI).
Citation
Finer M, Mamani N (2019) Satellites Reveal what Fueled Brazilian Amazon Fires. MAAP: 113.

 Loading...