Image #4: Large-Scale Oil Palm Causes Deforestation of Primary Forest in The Peruvian Amazon (Part 1: Nueva Requena)

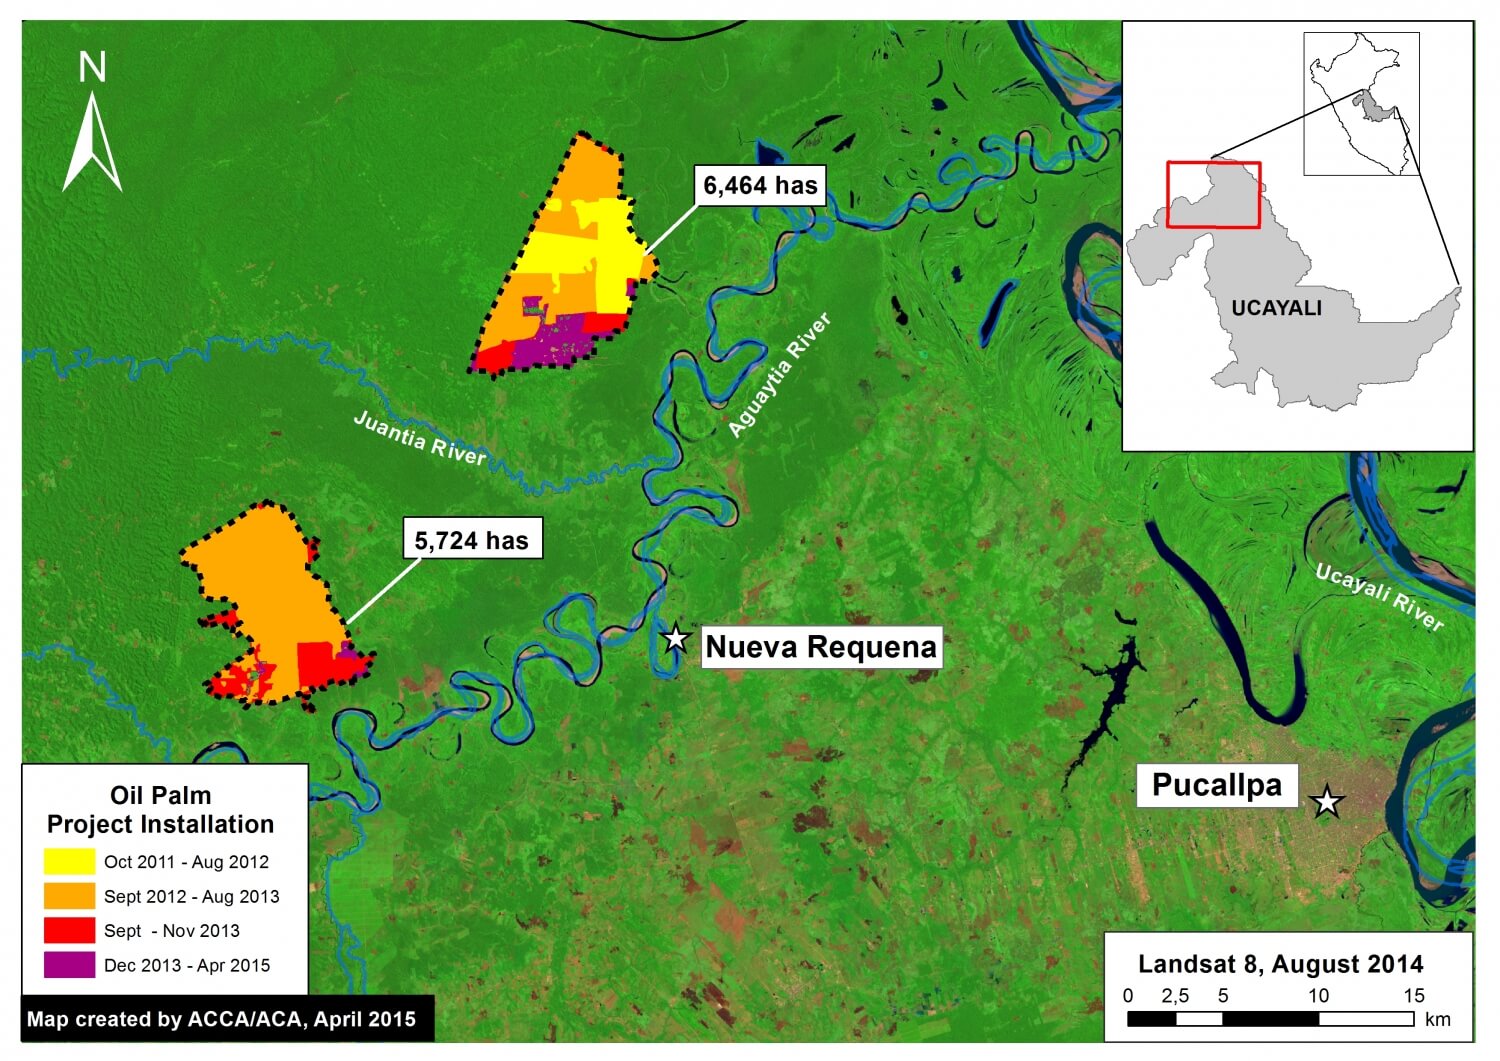
Image of the Week #4 shows the expansion of two large-scale oil palm projects near the town of Nueva Requena in the central Peruvian Amazon (Department of Ucayali). These projects began in late 2011 and, as of April 2015, now cover nearly 12,200 hectares (ha). Our analysis reveals that, of this total area, 9,400 ha came at the expense of primary forest and 2,350 ha from secondary forest.

Image of the Week 4a. Two large-scale oil palm projects near Nueva Requena in the central Peruvian Amazon (Department of Ucayali) began in late 2011 and now cover nearly 12,200 ha. Key data sources: USGS.

Map Description

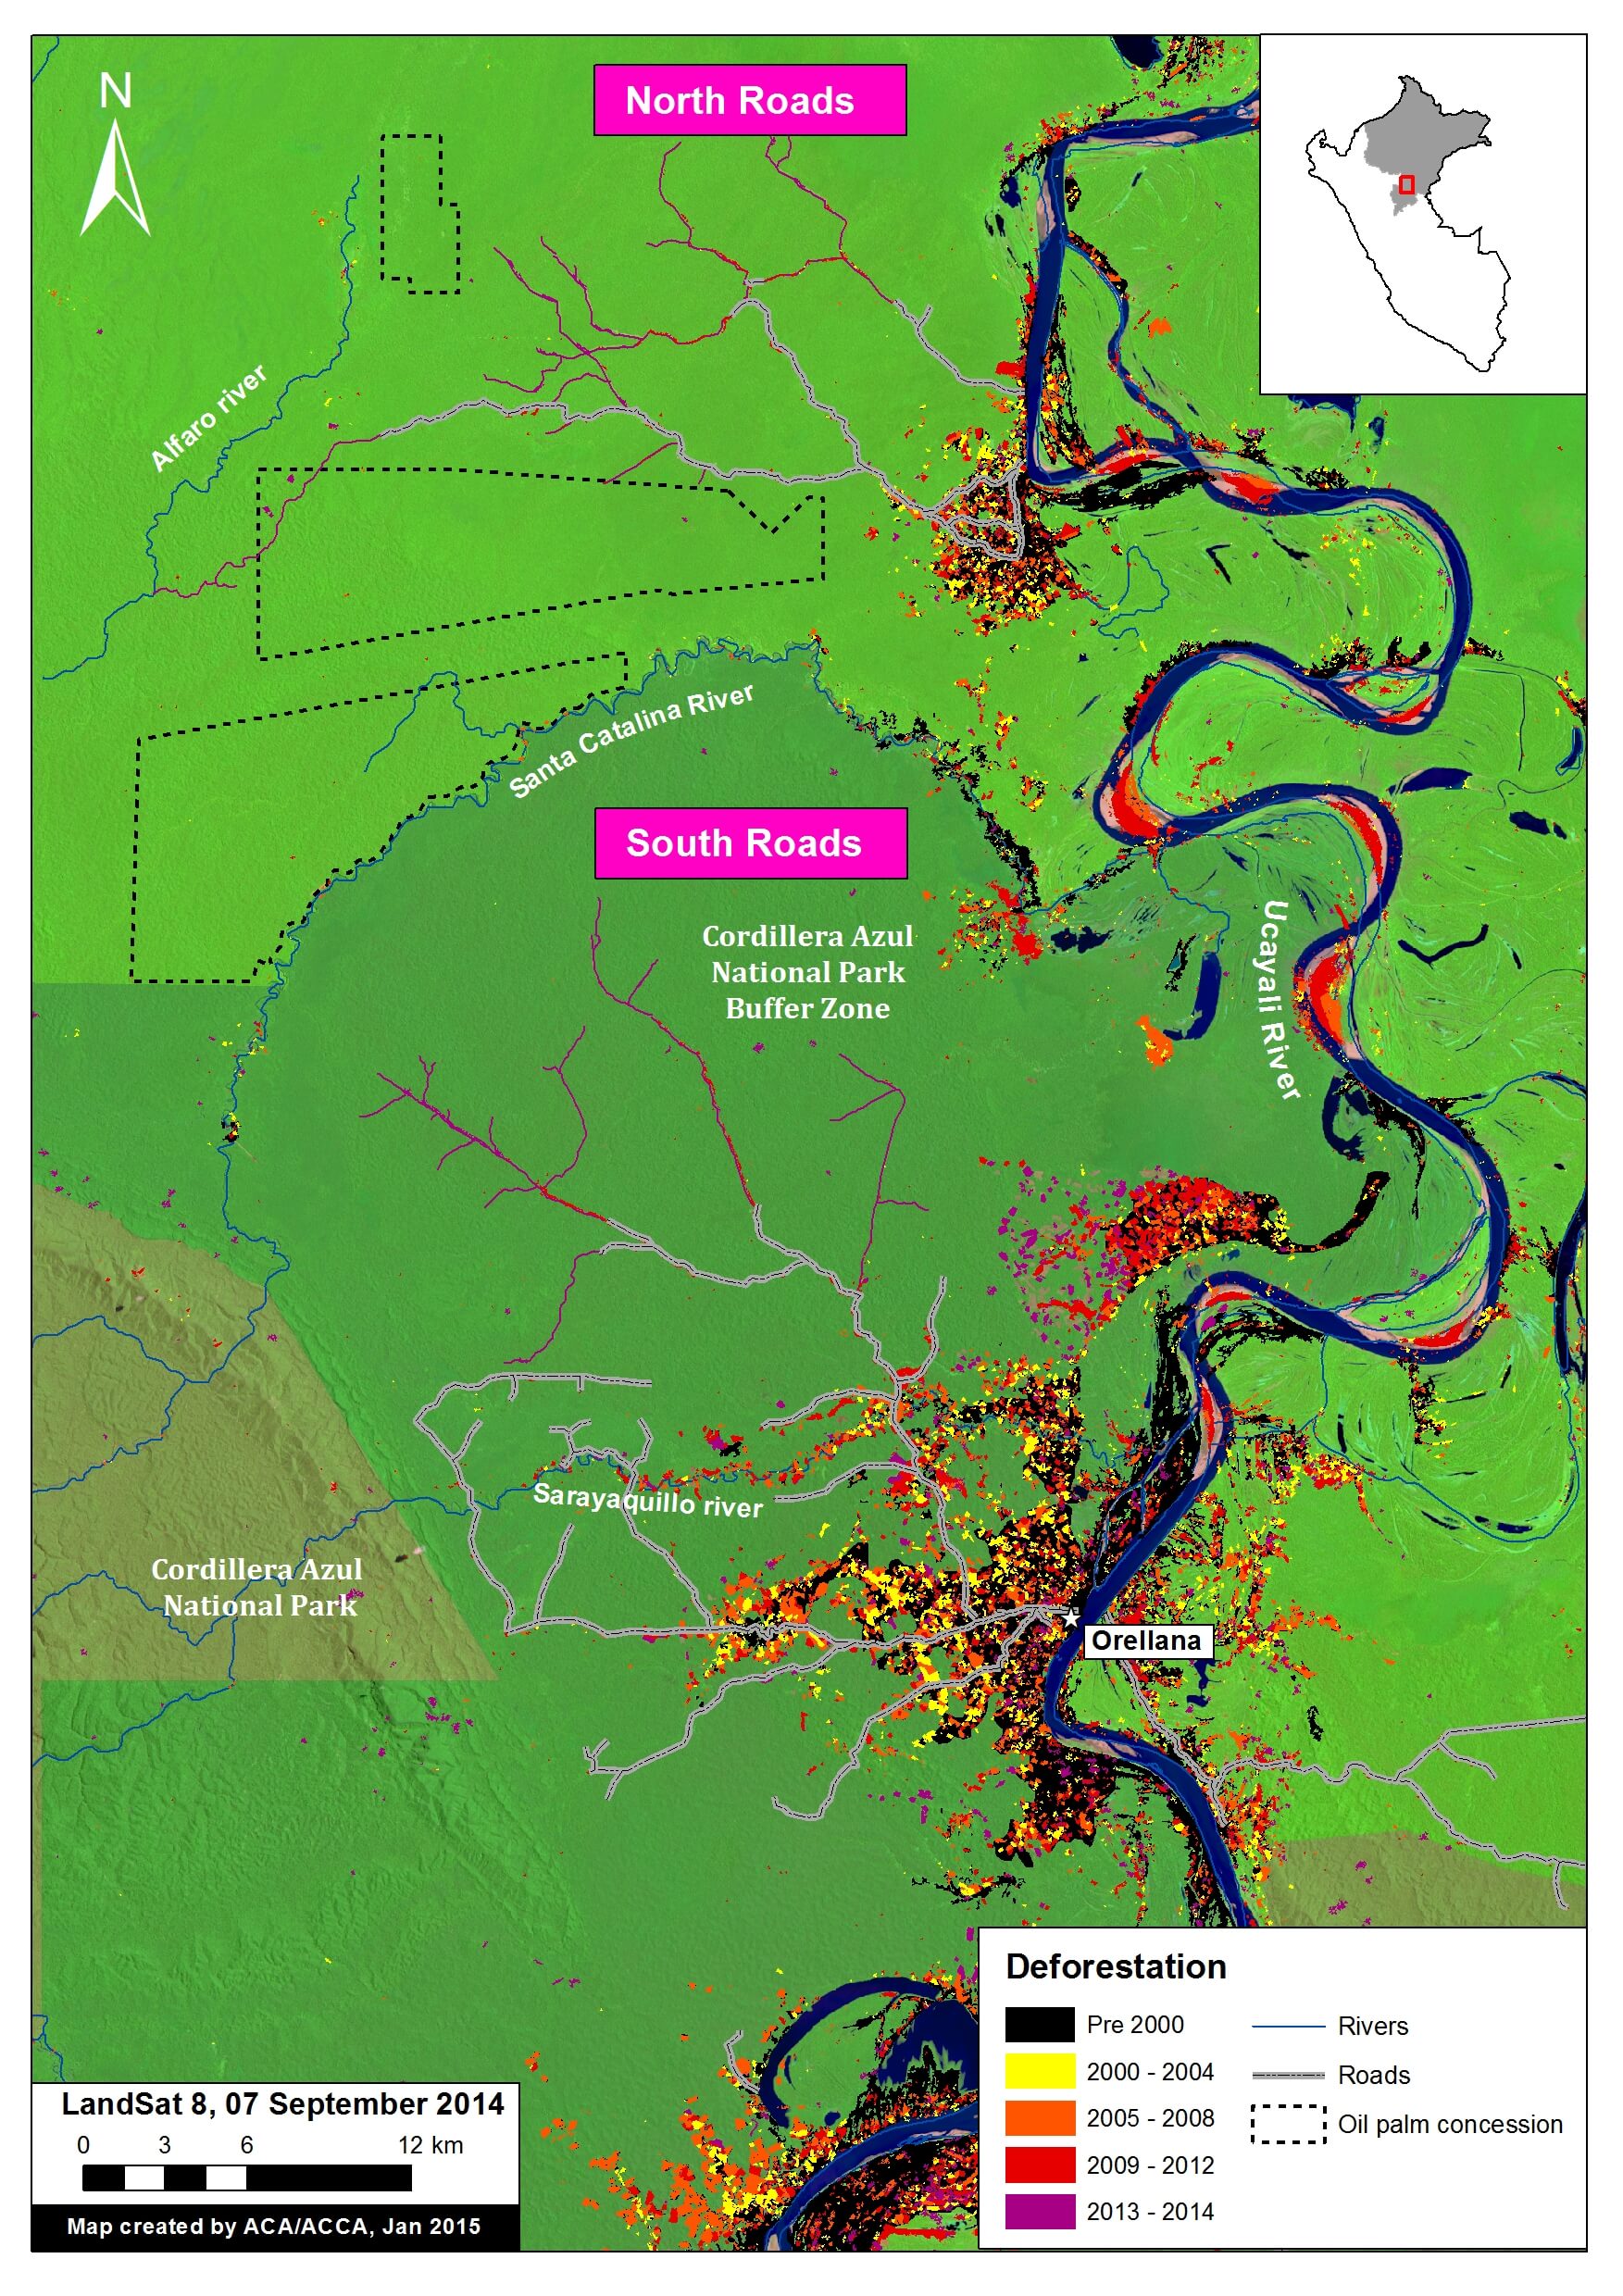
Background map is a Landsat 8 satellite image (30 meter resolution) from August 2014. Dark green indicates forest cover. Light green indicates younger or secondary vegetation. Blue indicates water bodies. Data is from USGS.

The dashed black lines indicate the outline of the two large-scale oil palm projects, one of which is known to be “Plantaciones de Ucayali”, as of April 2015.

The colors indicate how the deforestation and plantation installation unfolded over time for the two projects according to our analysis of Landsat imagery.

Between October 2011 and August 2012, large scale-clearing and installation (indicated in yellow) started in the northern project.

Between September 2012 and August 2013, large-scale clearing and installation (indicated in orange) continued in the northern project and began in the southern project.

Between September and November 2013, clearing and installation (indicated in red) continued in the southern portion of both projects.

Most recently, between December 2013 and April 2015, clearing and installation (indicated in purple) continued in the southern portion of the northern project.

As of April 2015, the two projects cover an area of 12,188 ha.

Landsat Time-series 2010 – 2015

Image 4b. Landsat time-series (2010 – 2015) for both large-scale oil palm projects near Nueva Requena. Key data sources: USGS.

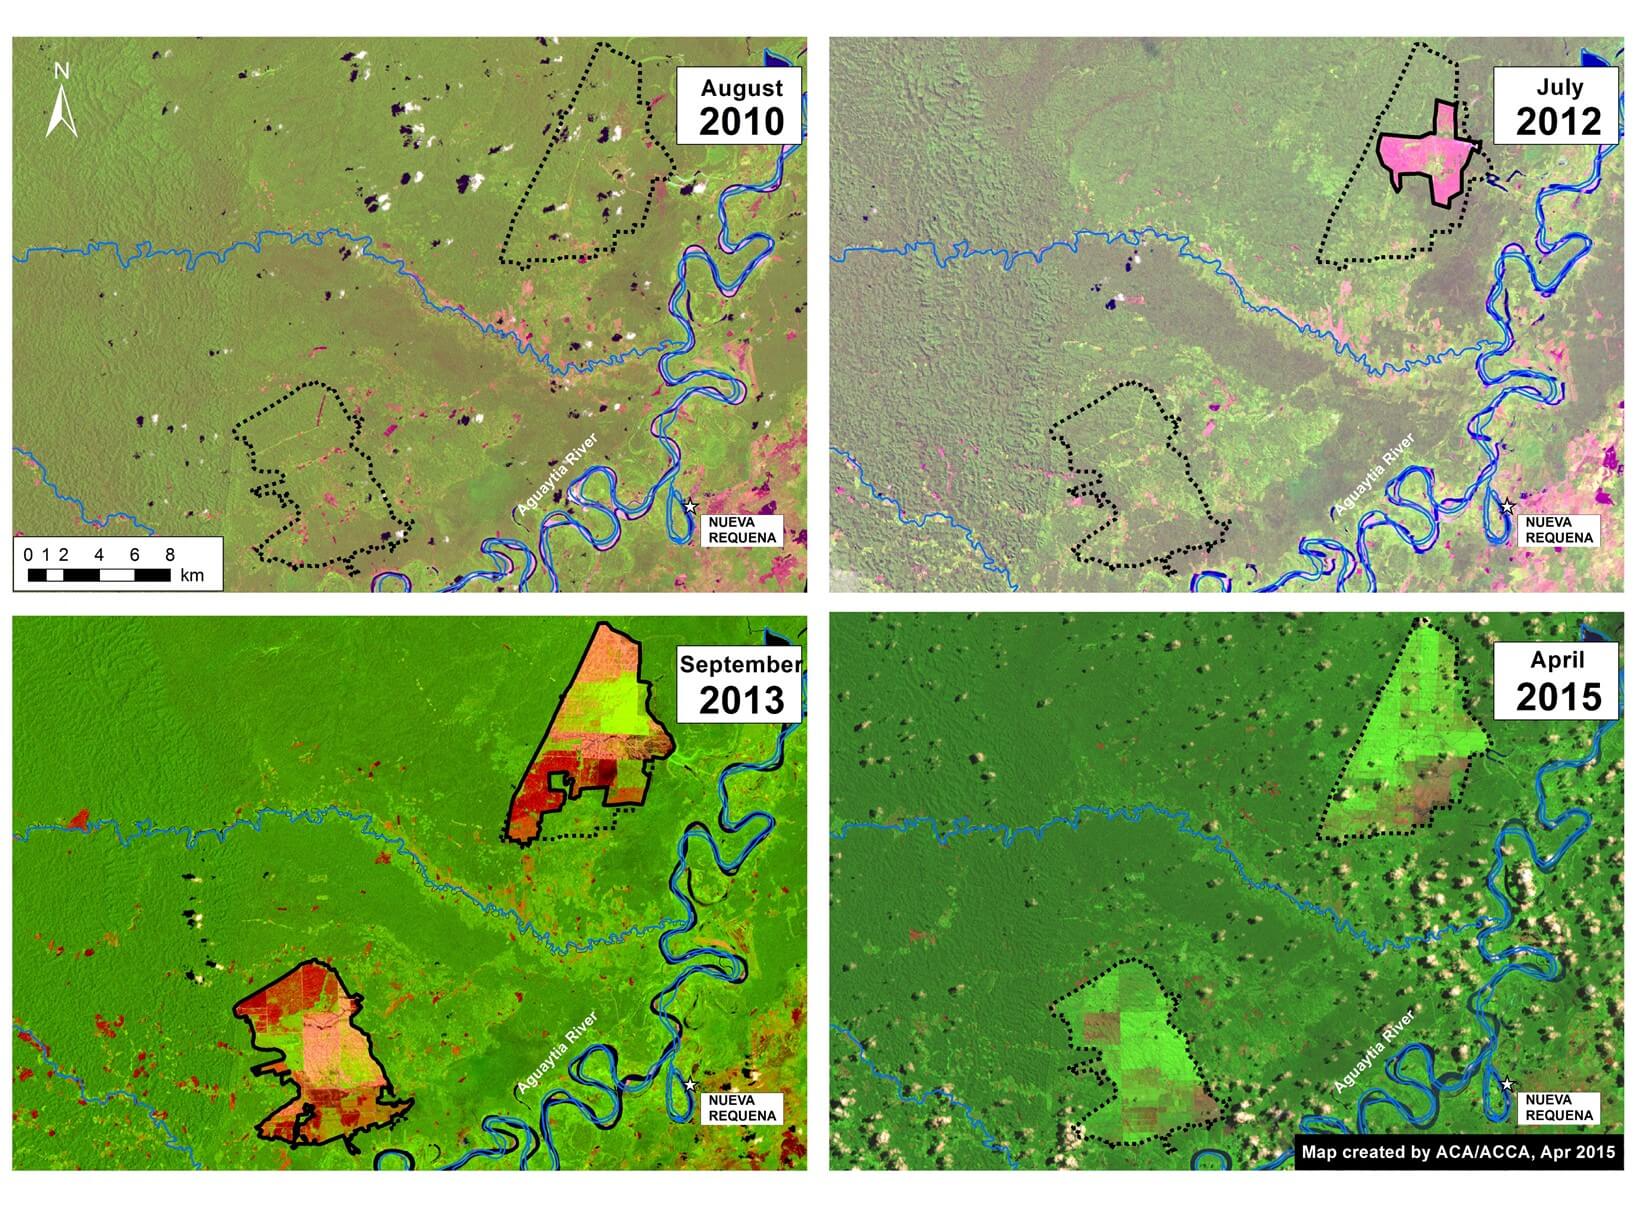
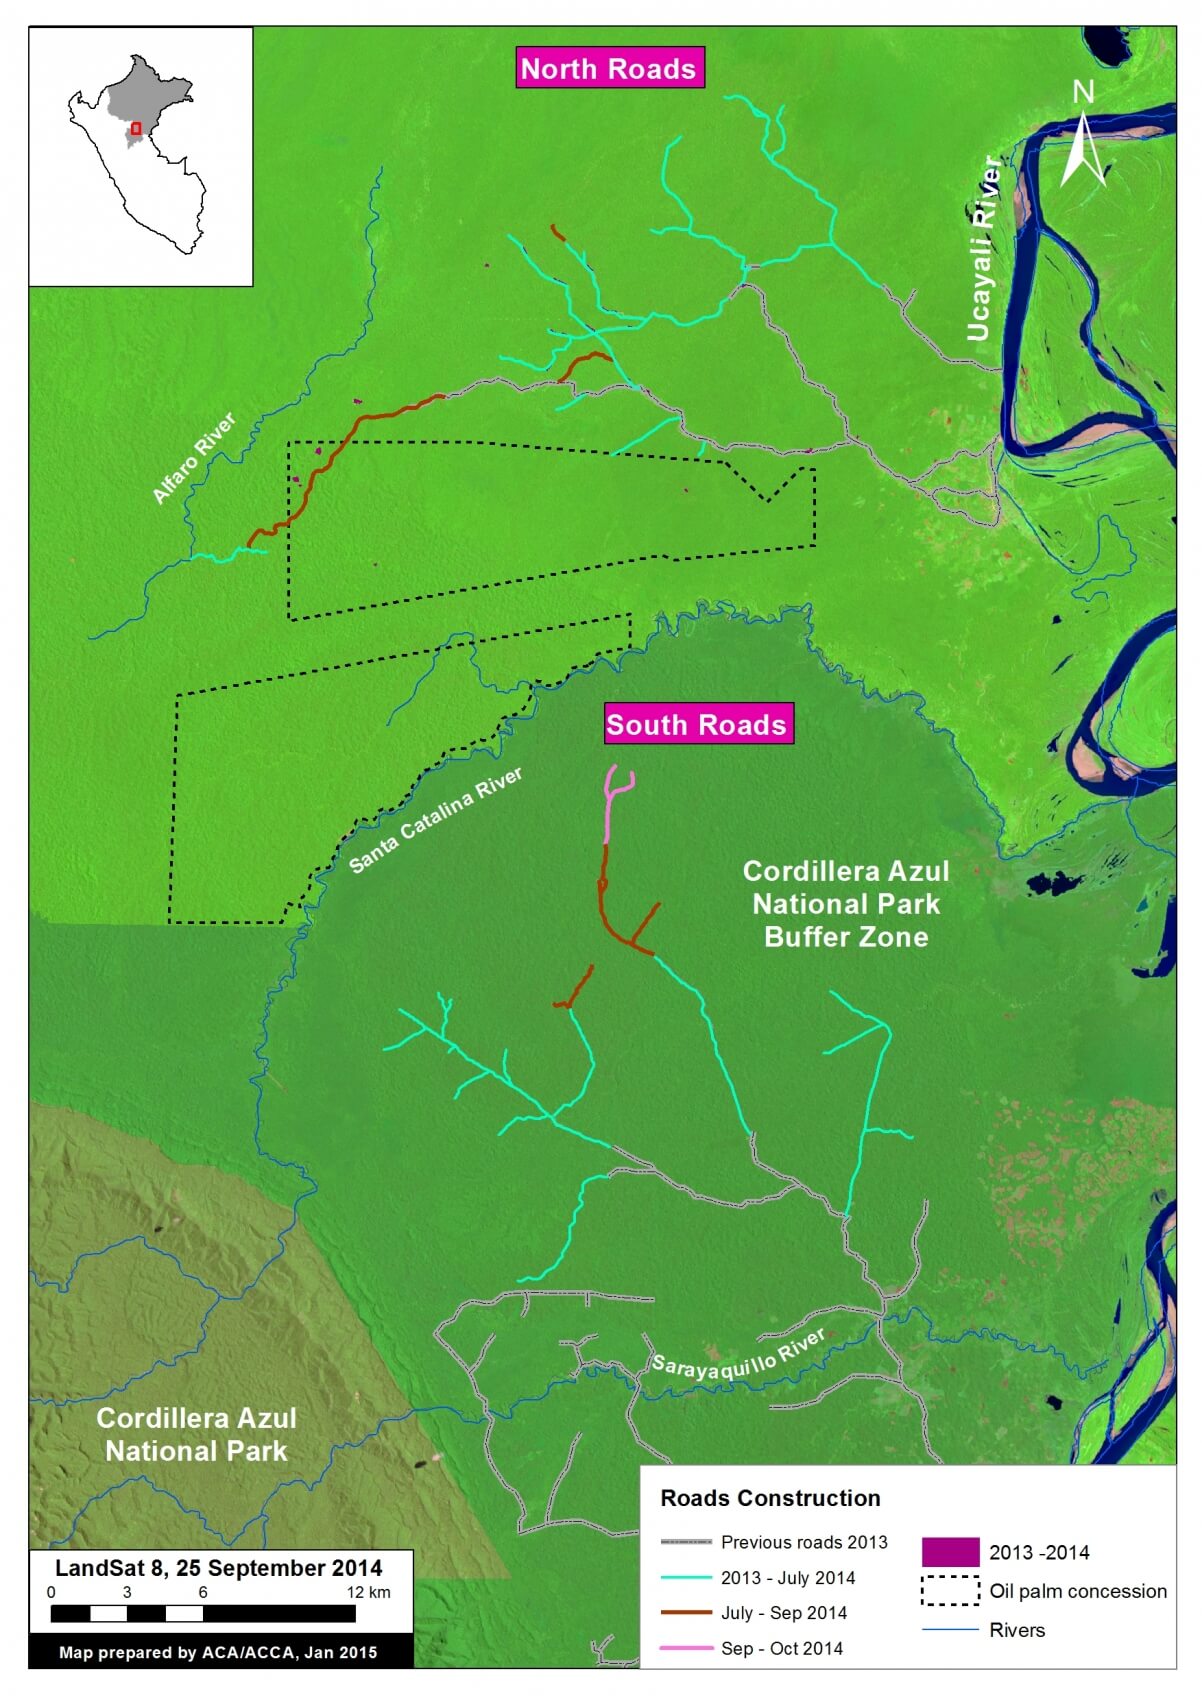
Image 4b is a series of Landsat images showing the change over time for both oil palm projects. In these images, dark green indicates forest cover, light green indicates secondary vegetation and oil palm plantations, pink indicates exposed ground (and is therefore a key indicator of recent deforestation), and the scattered white and black spots indicate clouds and their shade.

The first image, Landsat 5 from August 2010, shows the eventual project area (indicated by dashed black lines) immediately prior to the start of the project in 2011.

The second image, Landsat 7 from July 2012, shows the start of large-scale clearing in the northern portion of the project area.

The third image, Landsat 8 from September 2013, shows the clearing quickly expanded in both projects. It also shows the start of the oil palm plantation planting in the northern project (indicated by bright green).

The fourth image, Landsat 8 from April 2015, is the latest cloud-free image for the project area. It shows the continued expansion of the northern project and the extensive oil palm plantation plantings in both projects.

Landsat Time-series 1990 – 2015

Image 4c. Landsat time-series (1990 – 2015) for both large-scale oil palm projects near Nueva Requena. Key data sources: USGS.

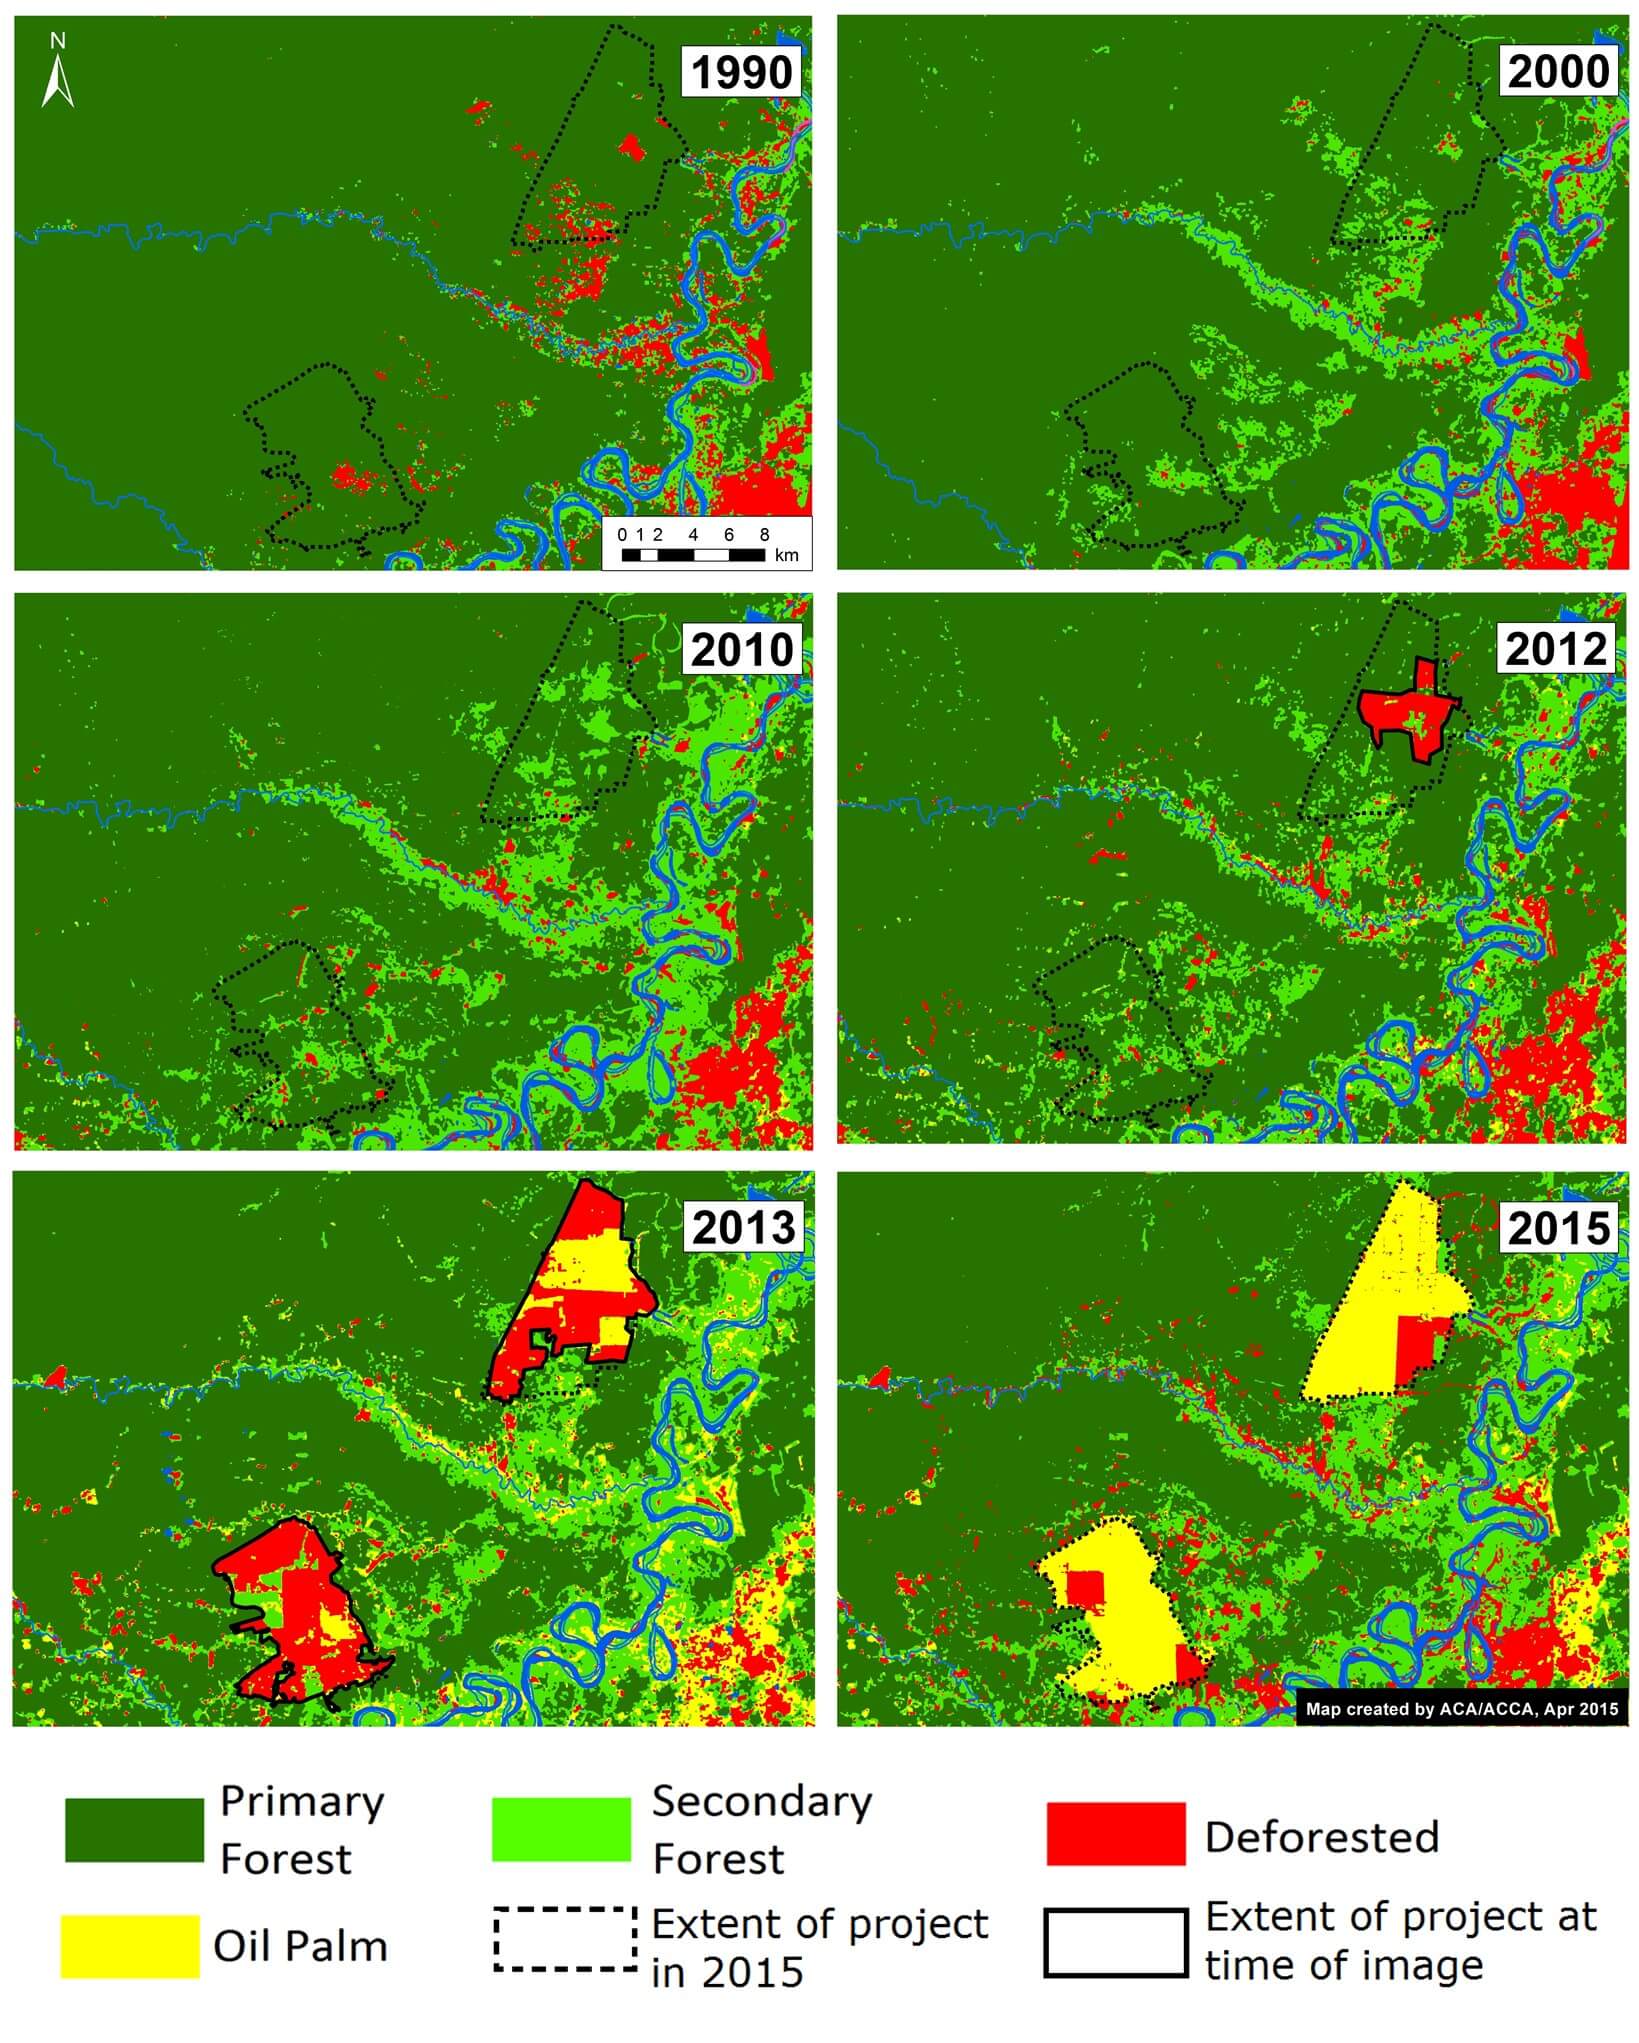
We conducted another Landsat time-series analysis, but going back further in time (to 1990) in order to better understand the state of the forests cleared for the oil palm project. For each image, we determined whether an area was primary forest, secondary forest, deforested, or oil palm. Image 4c illustrates the results of this analysis.

It is important to note that in 2010, just prior to the large scale clearing, the two project areas were mostly a mix of primary and secondary forest.

Deforestation of Primary Forest

Image 4d. Classification of land use prior to oil palm activities. Key data sources: USGS.

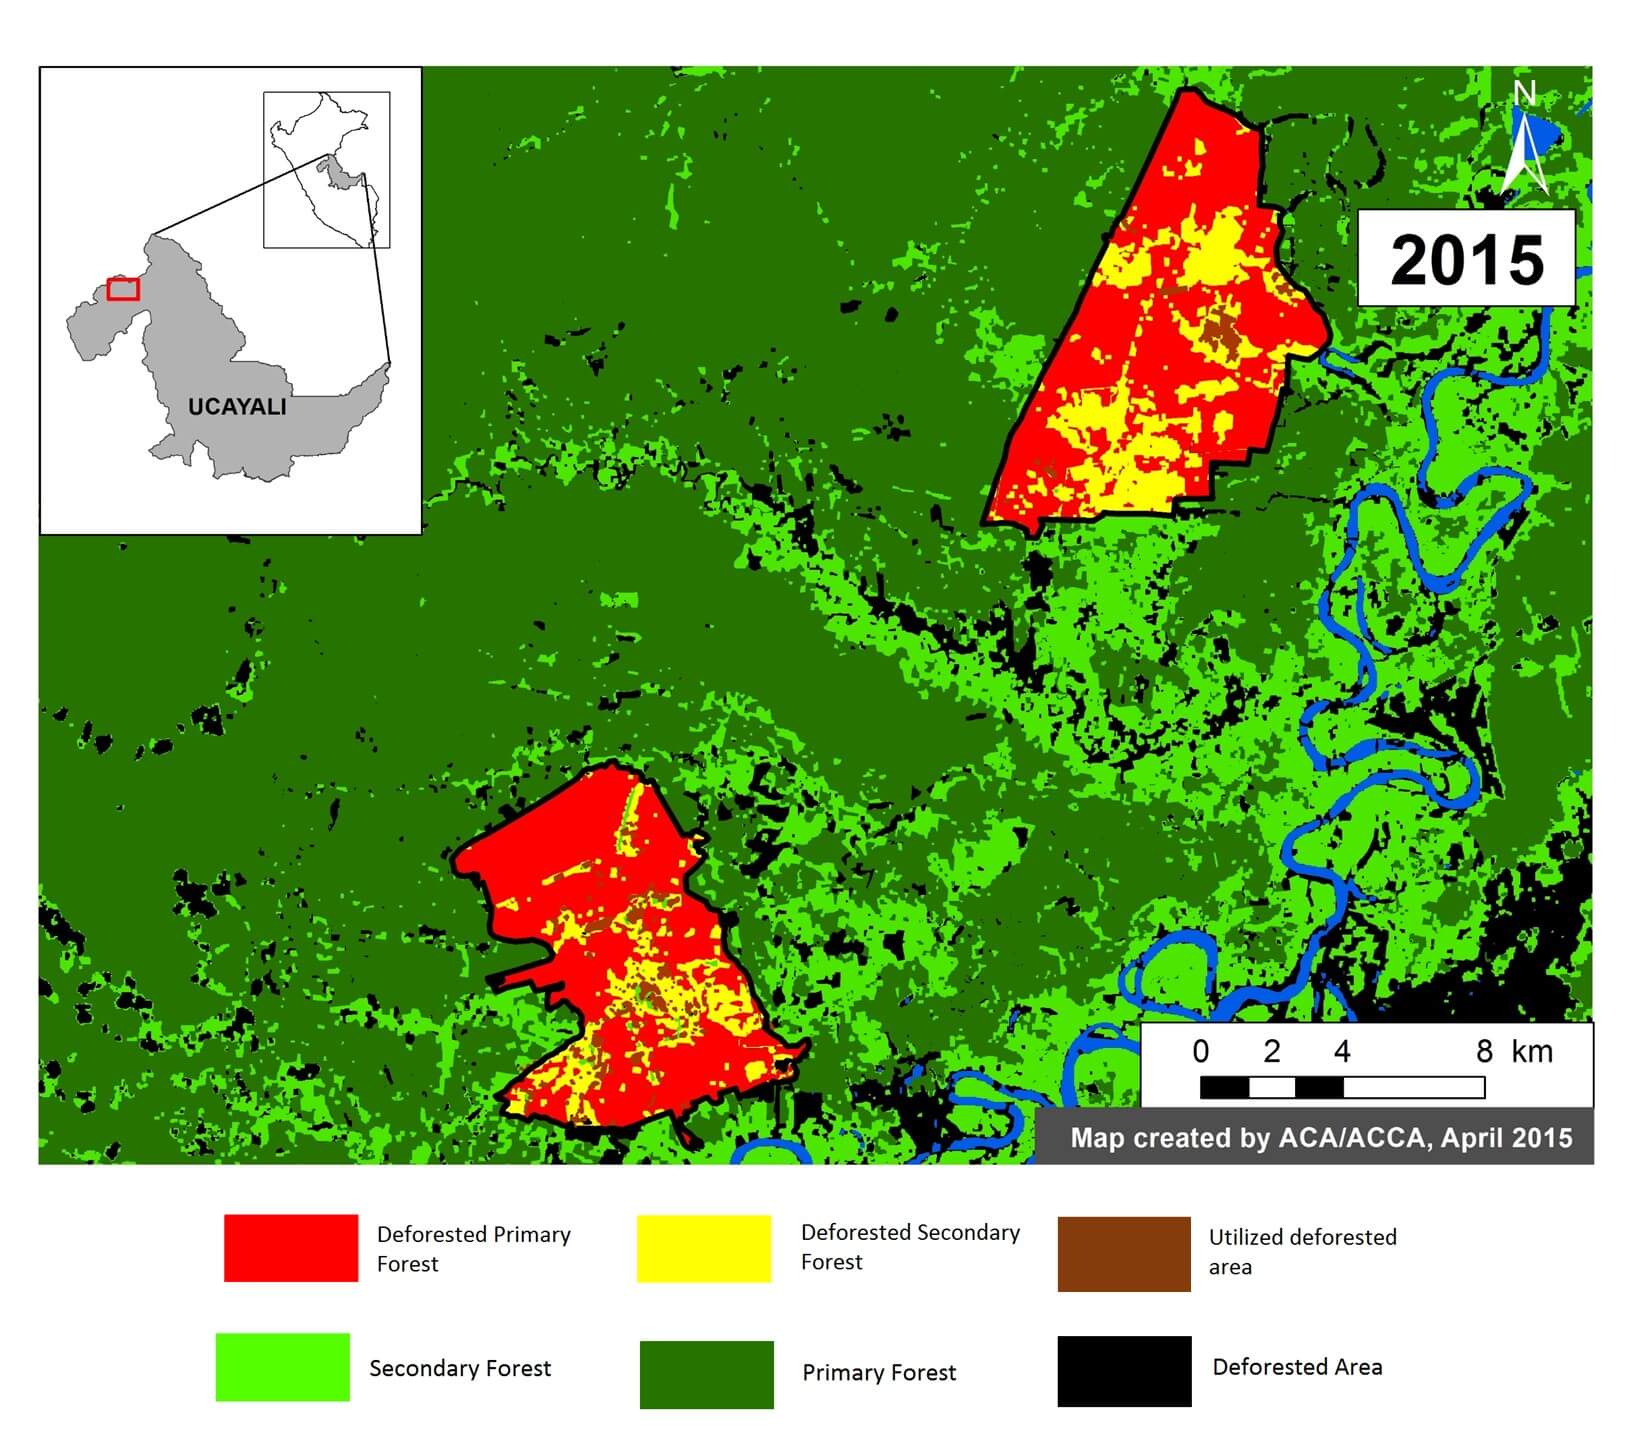
Finally, we used the results from the Landsat time-series analysis to conduct a classification of land use prior to oil palm activities.

We determined that, of the 12,188 ha of the two oil palm projects, 9,404 ha (77%) was primary forest immediately prior to project installation. That is the equivalent to nearly 7,000 soccer fields. An additional 2,350 ha (19 %) was secondary forest. Only 434 ha (4 %) was already deforested at the start of the project.

We defined primary forest as an area that from the earliest available Landsat, in this case 1990, was characterized by dense closed canopy forest cover.

This work builds off of the following publication: Environmental Investigation Agency. Deforestation by Definition. 2015. Washington, DC. http://eia-global.org/news-media/deforestation-by-definition


Citation

Finer M, Novoa S (2015) Large-Scale Oil Palm Causes Deforestation of Primary Forest in the Peruvian Amazon (Part 1: Nueva Requena). MAAP: Image #4. Link: https://maaproject.org/2015/04/image-4-oil-palm-projects-cause-deforestation-of-primary-forest-in-the-peruvian-amazon-part-1-nueva-requena/

Image #3: Detection of New (Logging?) Roads in The Peruvian Amazon

Image of the Week #3 shows the rapid proliferation of two new road networks in the northern Peruvian Amazon (Department of Loreto). Most notably, it highlights the construction of nearly 150 km of new roads, possibly illegal logging roads, through mostly primary forest between 2013 and 2014. One of the roads is within the buffer zone of the Cordillera Azul National Park.

Image of the Week 3. Detection of new road construction in the northern Peruvian Amazon (Department of Loreto) Key data sources: MINAM, Hansen/UMD/Google/USGS/NASA, USGS, SERNANP, Grupo Palmas, GOREL.

Map Description

Background map is a Landsat 8 image (30 m resolution) from September 7, 2014. Green indicates forest cover. Our analysis has demonstrated that much of this forest cover is primary forest. Data is from USGS.

Black indicates areas that were deforested as of 2000 according to data from the Peruvian Environment Ministry. Yellow, orange, and red indicate areas that were deforested from 2000 to 2012 (each color covers a four year period) (Hansen MC et al. 2013 Science 342: 850–53; Data download).

Purple indicates areas that were deforested between 2013 and 2014 based on our analysis of Landsat imagery using CLASlite forest monitoring software. Note the two new road networks, labeled North and South, respectively, to the west of the Ucayali River.

Black dashed lines indicate planned oil palm plantations. We obtained this data from Environmental Impact Studies and the Regional Government of Loreto (GOREL).

Protected areas data is from SERNANP. Note the different shades of green to differentiate the protected area and its respective buffer zone.

Image 3b. Road construction time-series. Key data sources: USGS, SERNANP, Grupo Palmas.

Construction of New Roads

We color coded the segments of road by construction period: Grey indicates road segments constructed between 2009 and 2012. Teal indicates road segments constructed between January 2013 and July 2014 (117.3 km). Dark-orange indicates road segments constructed between July and September 2014 (25.9 km). Pink indicates road segments constructed between September and October 2014 (4.8 km).

In sum, 148 km of new roads was constructed in this area between January 2013 and October 2014 (76.24 km in south and 77.38 km in the north).

The southern network is characteristic of a logging road in that it does not have a clear destination and instead just keeps extending and branching deeper into closed-canopy forest.

The northern network is more puzzling in that it crosses a proposed palm oil concession (Grupo Romero’s Tierra Blanca project) and terminates at the Alfaro River. Also note several areas of recent deforestation near the road in the northwest corner of the oil palm concession.

Image 3c. High resolution SPOT 6 images (1.5 m resolution) of portions of the northern and southern road networks. Key data sources: USGS, SPOT 6.

High-resolution zooms

Panel A is a high resolution SPOT 6 image (1.5 m resolution) from August 2014 of a portion of the northern road network.

Panel B is a high resolution SPOT 6 image (1.5 m resolution) from October 2014 of a portion of the southern road network.


Citation

Finer M, Novoa S (2015) Detection of New (Logging?) Roads in the Peruvian Amazon. MAAP: Image #3. Link: https://maaproject.org/2015/04/detection-of-new-road-construction-in-southern-loreto-peru/

Mining News Watch #15

Top Stories

  • Antonio Fernández Jeri has been appointed as the new High Commissioner of Mining Formalization and the Interdiction of Illegal Mining.
  • The Amazon Conservation Association issued a new map showing that gold mining-driven deforestation grew by 226.5 hectares (560 acres) between October 2014 and February 2015 in the buffer zone of the Tambopata National Reserve.
  • A new report found that miners from Ecuador are using a series of underground tunnels to smuggle illegal gold from the Amazonas department of Peru.

Read Full Article >