MAAP #18: Proliferation of Logging Roads in The Peruvian Amazon

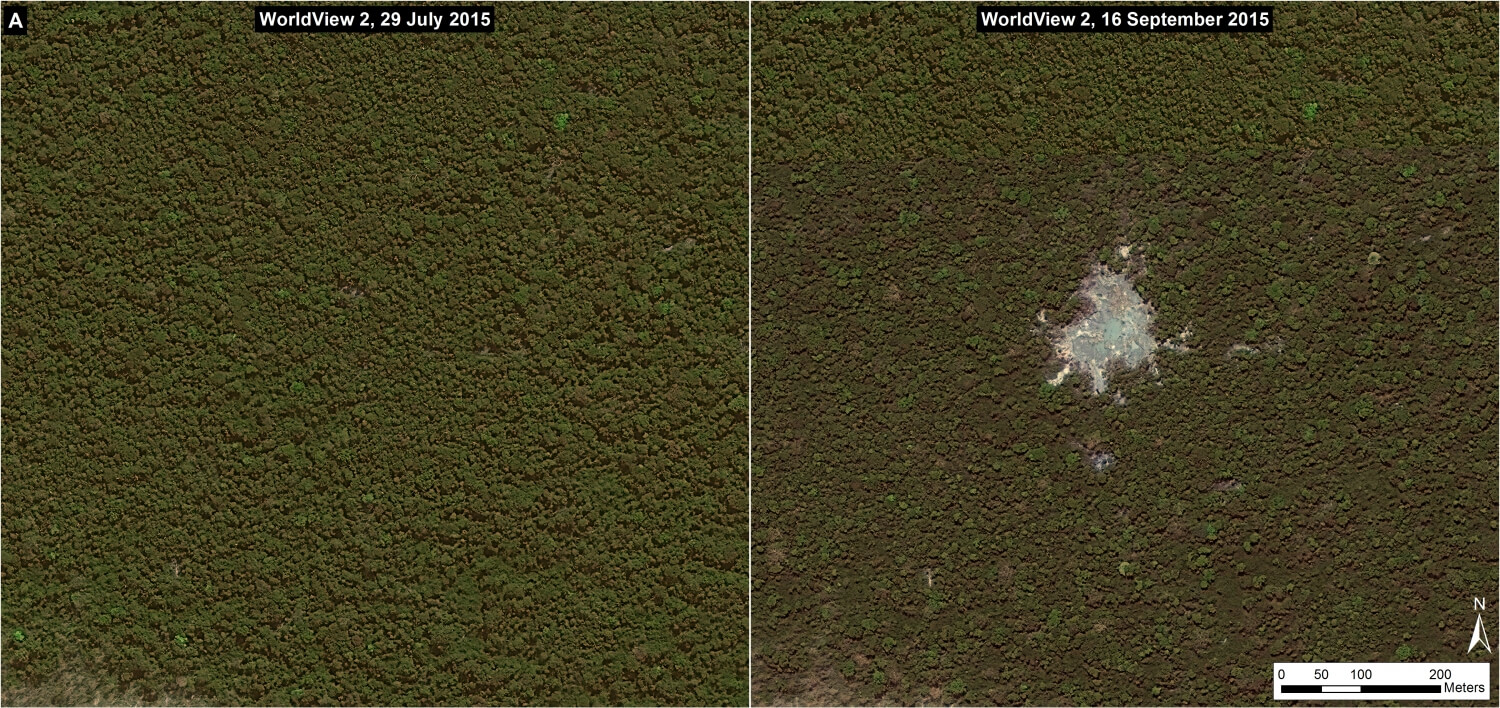
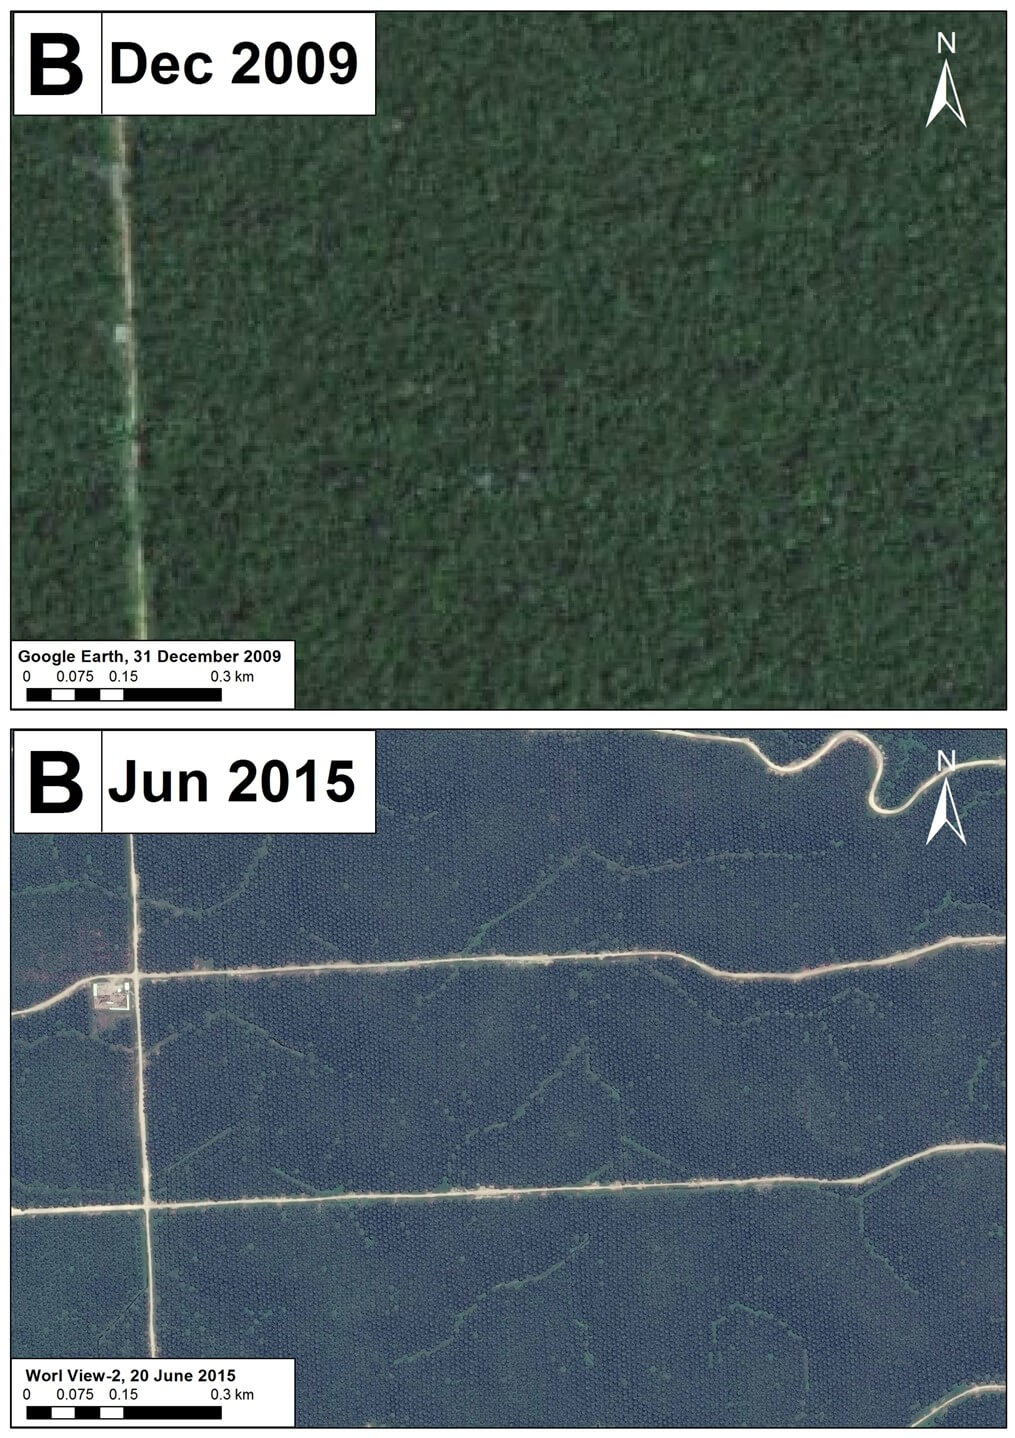
MAAP articles #3 and #15 detailed the construction of several new logging roads in the central Peruvian Amazon. Here in MAAP 18, we provide a more comprehensive analysis of the proliferation of logging roads in this section of the Amazon. In Image 18a, we show a high resolution example of a new logging road in this area with active construction during 2015 (see Inset A1 in Image 18c for more context).

Image 18a. New logging road in the Peruvian Amazon. Data: WorldView-2 of Digital Globe (NextView).

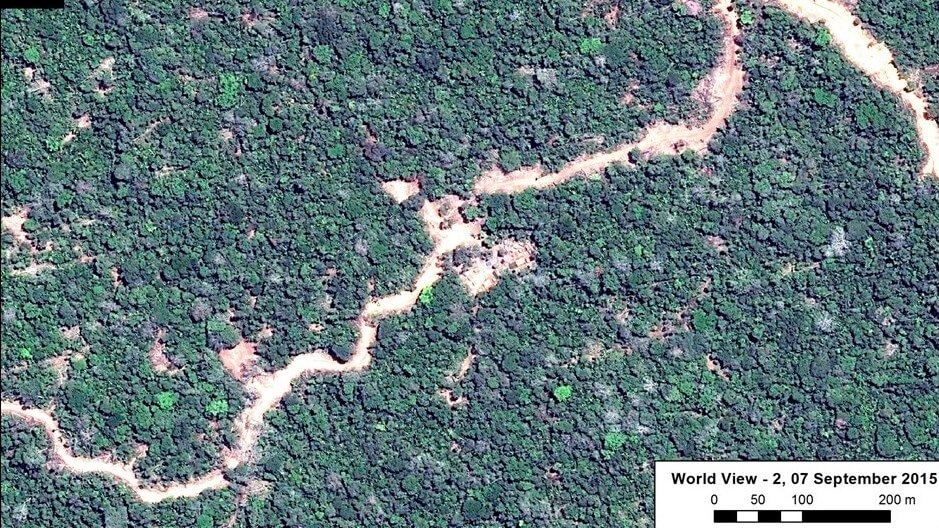
Image 18b illustrates the location of all identified logging roads in the central Peruvian Amazon (southern Loreto and northern Ucayali). Most of these roads are located along the Ucayali River and its headwater tributaries. The left panel highlights just the logging roads, while the right panel also includes protected areas, native communities, and logging concessions.

Image 18b. Logging roads in the central Peruvian Amazon. Data: SERNANP, IBC, USGS, MINAGRI.

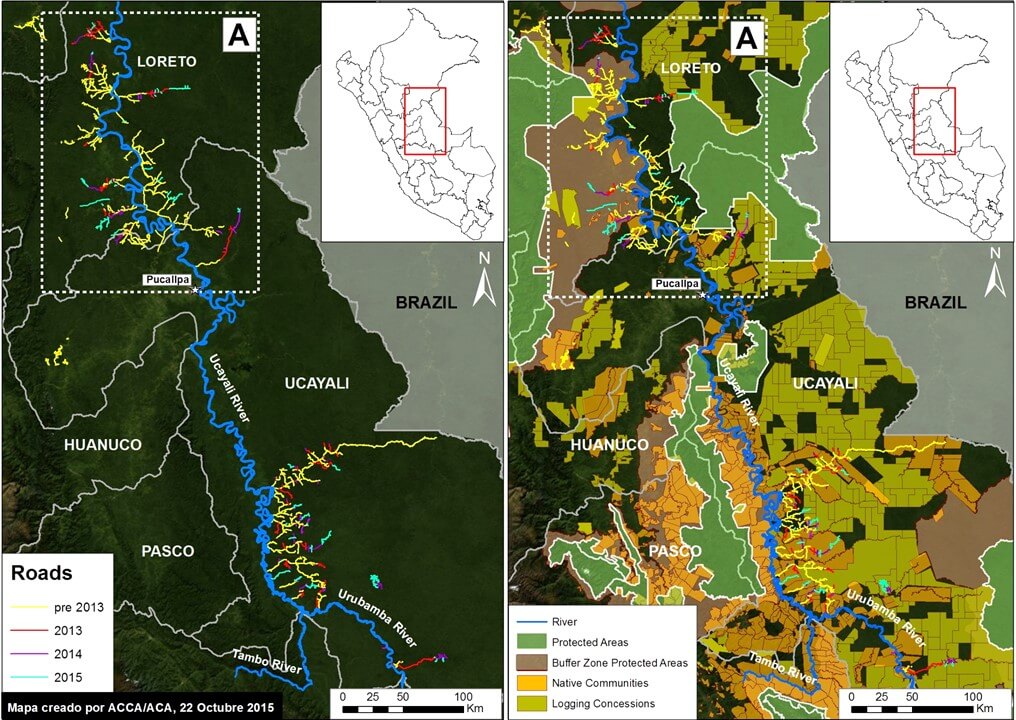
In Image 18b, we documented the construction of 1,134 km of logging roads between 2013 and 2015 in the central Peruvian Amazon. Of this total, 538 km is in the matrix of logging concessions and native communities in southern Ucayali, 226.1 km is in undesignated areas in southern Loreto, 210 km is in the buffer zone of Cordillera Azul National Park, and 159 km is around the new Sierra del Divisor National Park.

Note that the buffer zone of Cordillera Azul National Park and surroundings of Sierra del Divisor National Park contain logging concessions and native communities, thus the responsibility of forest authority is the regional government.

Determining the legality of these roads is complex. As the right panel highlights, many of these roads are near logging concessions and native communities, whom may have obtained the rights for logging from the relevant forestry authority (in many cases, the regional government).

Below, we focus on the logging roads in the northern section of Image 18b (see Inset A).

Zoom A: Logging Roads in Southern Loreto/Northern Ucayali


Image 18c. Logging roads in southern Loreto/northern Ucayali. Data: SERNANP, IBC, USGS, MINAGRI.

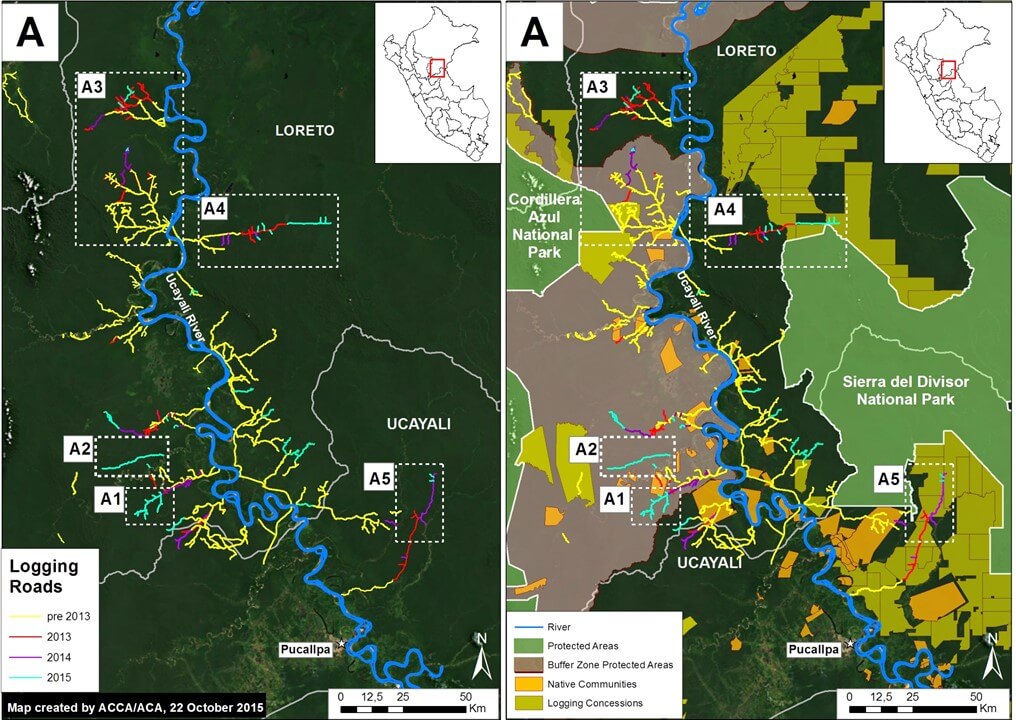
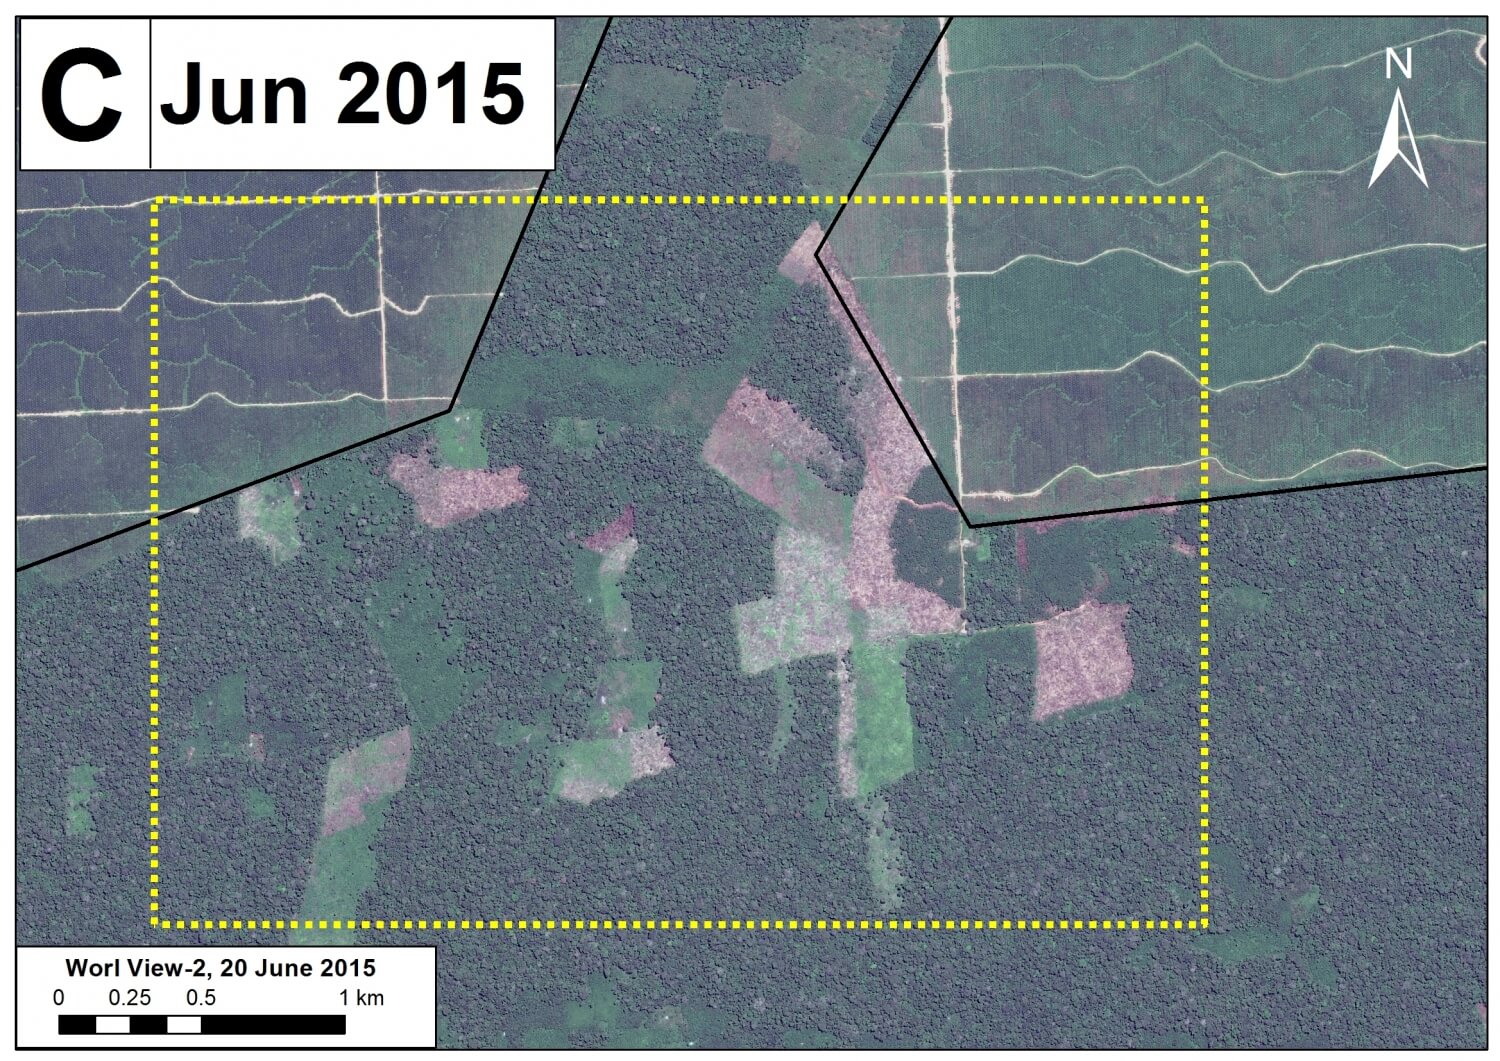
Image 18c is a zoom of the logging roads shown in the northern section of Image 18a (Inset A), located in southern Loreto and northern Ucayali. It shows five primary areas of interest. Both Insets A1 and A2 correspond to new roads within the southeast buffer zone of the Cordillera Azul National Park with active construction in 2015 (see below for more details).

Insets A3, A4, and A5 correspond to roads with active construction between 2013 and 2015 that have already been featured on MAAP. Inset 3 includes a logging road in the northeast sector of the buffer zone of Cordillera Azul National Park (see MAAP #3 for more details). Insets 3 and 5 show logging roads around the new Sierra del Divisor National Park (see MAAP #15 and MAAP #7 for more details).

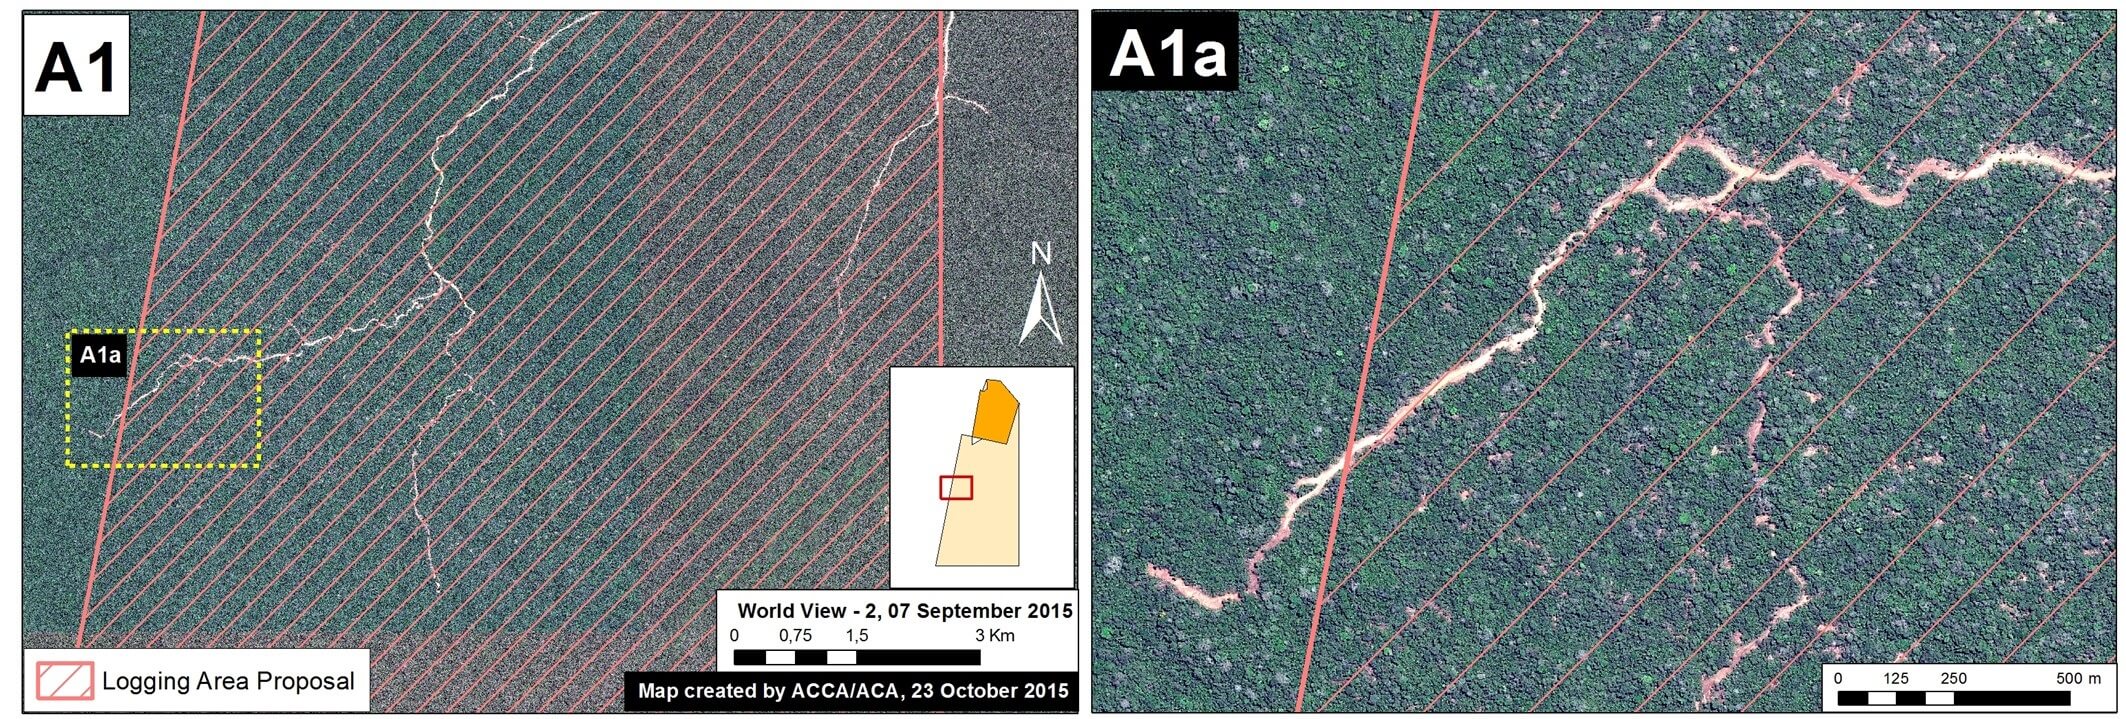
Zoom A1: Logging Roads in Nuevo Irazola

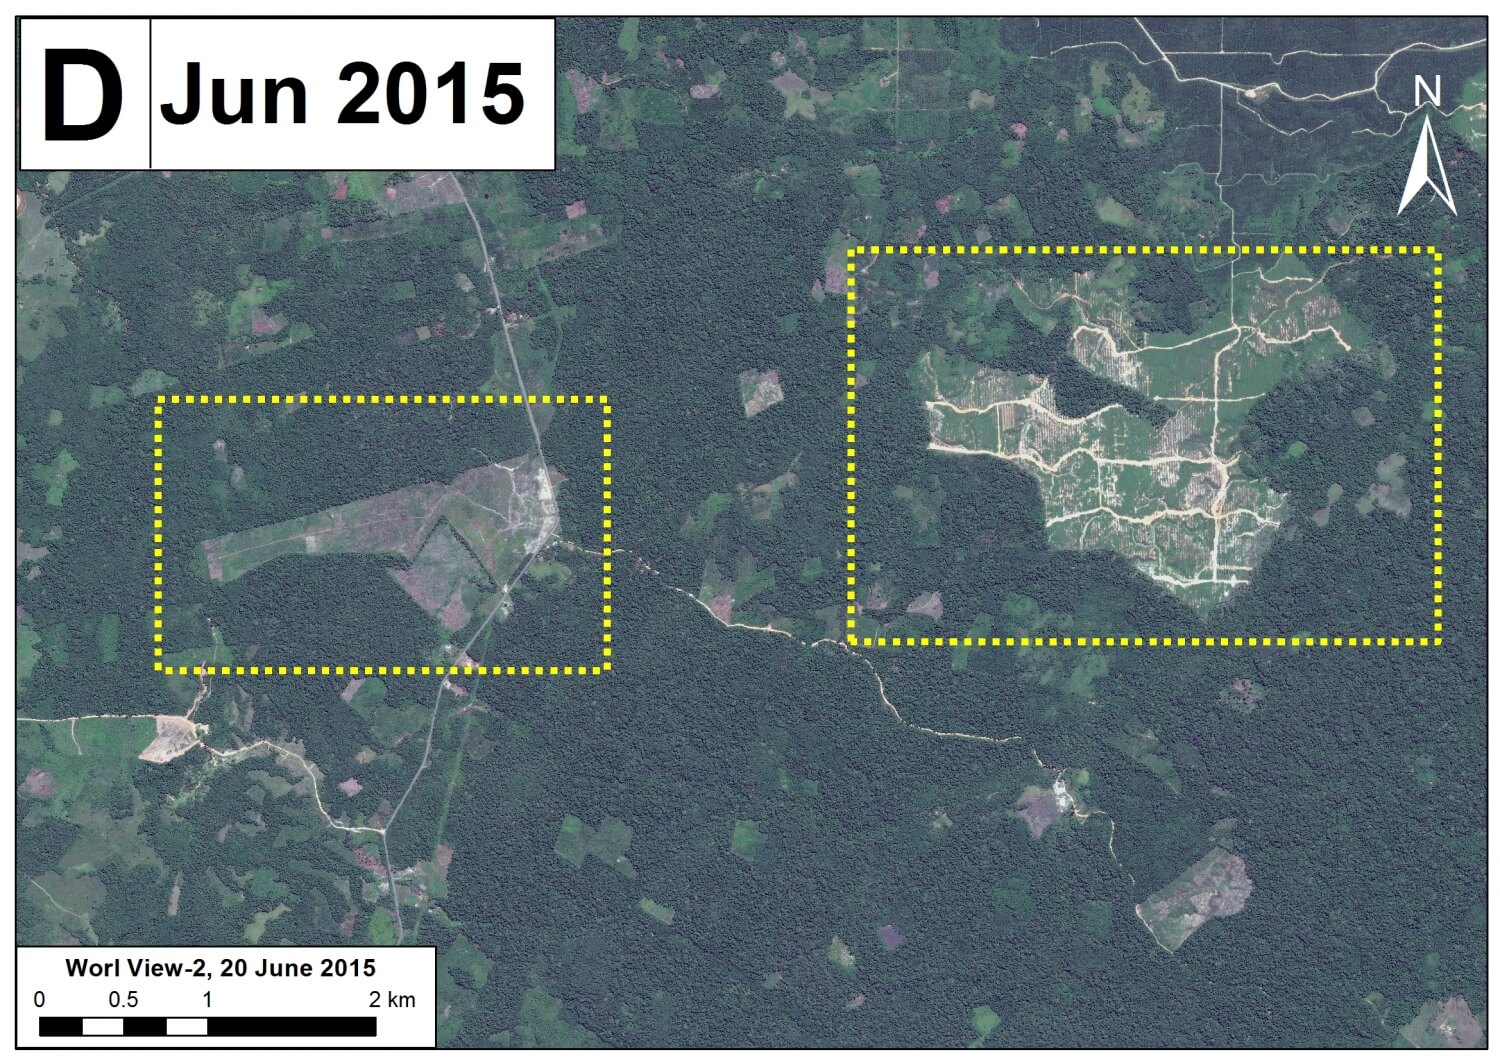
Image 18d provides more details about a new logging road with very recent construction within the southeast buffer zone of Cordillera Azul National Park (See Inset A1 in Image 18C for context). This road has grown 68 km between 2013 and 2015, with more than half of this construction occurring over the past year. According to information obtained from the forestry department within the Regional Government of Ucayali (PRMRFFS), the native community of Nuevo Irazola made a logging permission request for industrial and/or commercial use and prepared an Annual Operating Plan. However, a high-resolution (0.5 m) image shows a recent stretch of the road exceeds the area requested for forestry activities (see Image 18d).

Image 18d. High-resolution image of a new forest road in the southeast buffer zone of Cordillera Azul National Park. Data: WorldView-2 of Digital Globe (NextView).

Zoom A2: Rapid Expansion of a Logging Road


Image 18e. Time series of a forest road in the southeast buffer zone of Cordillera Azul National Park. Data: USGS.

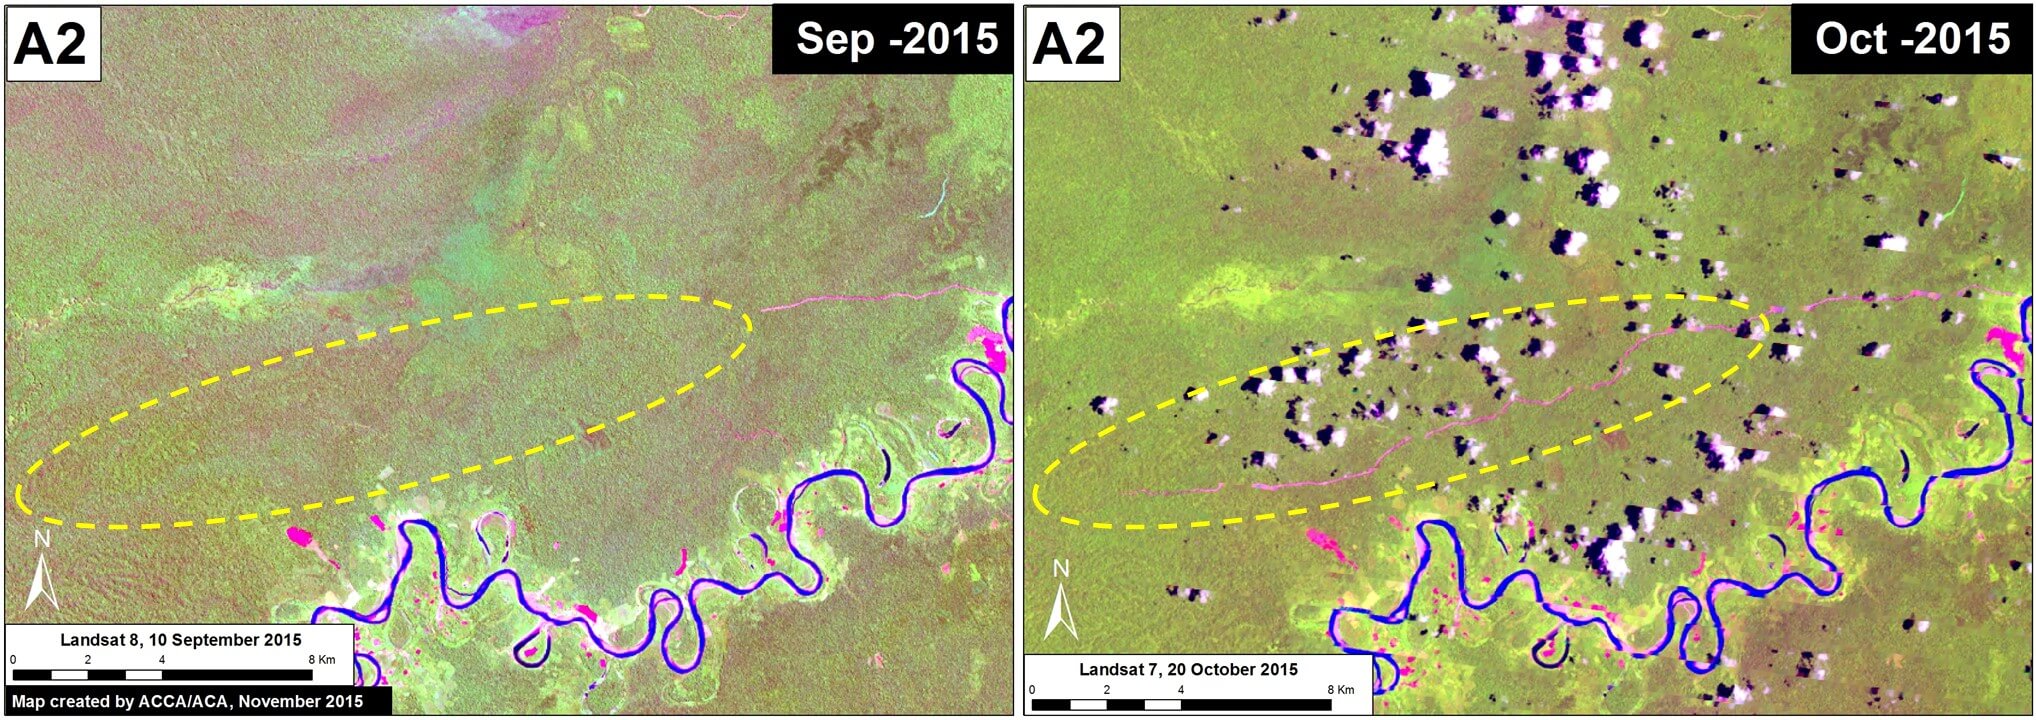
Image 18e illustrates the rapid expansion of another forest road located in the southeast section of the Cordillera Azul National Park buffer zone (See Inset A2 in Image 18C for context). We documented the construction of 29.1 km during the six weeks between September 10 (left panel) and October 20 (right panel), a rate of nearly five kilometers per week. The legality of this road is currently unknown, but note that it is extending in the direction of a forestry concession.

Citation

Novoa S, Fuentes MT, Finer M, Pena N, Julca J (2015) Proliferation of Logging Roads in the Peruvian Amazon. MAAP #18.

Note: MAAP #18 is a collaborative effort between Amazon Conservation Association (ACA), Conservación Amazónica (ACCA), and the Centro de Conservación Investigación y Manejo de Áreas Naturales (CIMA).

MAAP #17: Birth of A New Illegal Gold Mining Zone in The Peruvian Amazon [High Resolution View]

In MAAP #12, we featured a high resolution image from July 29, 2015 of the area known as “La Pampa,” a hotspot of illegal mining in the buffer zone of the Tambopata National Reserve (Madre de Dios region, Peru).

Just seven weeks later, we obtained a new high resolution image of La Pampa for September 16, 2015. Image 17a shows the birth of a new gold mining zone between the July image (left panel) and September image (right panel) (see the letter “A” in Image 17b for context). The current extent of this new clearing is 1.5 hectares. This mining activity is illegal since it is located within the buffer zone of the Tambopata National Reserve.


Reference Map

Image 17b is the reference map, showing the forest cover change between July (left panel) and September (right panel) 2015. In the right panel, the letter “A” corresponds to Image 17a, while the letter “B” corresponds to Image 17c.

Image 17b. Reference map. Data: WorldView Digital Globe (NextView).

Expanding Deforestation

Image 17c shows the deforestation expanding to the west between July (left panel) and September (right panel) 2015.

Image 17c. Deforestation expanding to the west between July and September 2015. Data: WorldView Digital Globe (NextView).

Citation

Finer M, Olexy T (2015) High Resolution View: Birth of a New Illegal Mining Zone. MAAP #17.

MAAP #16: Oil Palm-Driven Deforestation in The Peruvian Amazon (Part 2: Shanusi)

In MAAP #4 we described the major deforestation caused by two new large-scale oil palm projects in the central Peruvian Amazon (Nueva Requena, Ucayali region).

Here in MAAP #16, we describe the major deforestation related to two other oil palm projects, Palmas del Shanusi and Palmas del Oriente, in the northern Peruvian Amazon (regions Loreto and San Martin). These projects (operated by Grupo Palmas, an agriculture company owned by Grupo Romero) cover 10,029 hectares.

Image 16a. Deforestation within and around the two large-scale oil palm projects Palmas del Shanusi and Oriente. Data: PNCB, USGS, Grupo Palmas.

Image 16a shows the extensive forest clearing within and around Palmas del Shanusi and Oriente. The 2000-2014 forest loss data comes from the Peruvian government (PNCB-MINAM/SERFOR-MINAGRI) and the 2015 data comes from our analysis of Landsat imagery using CLASlite forest monitoring software.

Within the two projects, we documented that Grupo Palmas cleared 6,974 hectares of primary forest between 2006 and 2011 (see Images 16a and 16b). This represents 70% of the projects’ area (Peruvian law requires the conservation of 30% of an agricultural project area’s forest cover). Thus, a key issue is that the Peruvian legal framework, under certain conditions, allows the clearing of thousands of hectares of primary forest for large-scale agriculuture projects (see the report Deforestation by Definition by the Environmental Investigation Agency for more details).

We defined primary forest as an area characterized by dense, closed-canopy coverage from the earliest available Landsat image (in this case 1994) until immediately prior to plantation installation.

Importantly, we also documented the clearing of an additional 9,840 hectares of primary forest immediately surrounding the projects (see Images 16a and 16b). There was clearing of more than a thousand hectares each year between 2010 and 2013, followed by another thousand hectares between 2014 and 2015. Analysis of high-resolution imagery confirms that much of this additional clearing resulted in large-scale model oil palm plantations.

In total, we documented the clearing of over 16,800 hectares of primary forest for large-scale oil palm plantations within and around Palmas del Shanusi and Oriente. It is important to note that there has now been more forest clearing outside than inside the original projects, an important lesson for other new agricultural areas such as Tamshiyacu.

Image 16b. Primary forest cleared within and around Grupo Palmas projects.

High Resolution Zooms

Following is a series of high resolution zooms showing examples of forest clearing within and around Palmas del Shanusi and Oriente. Image 16c is the reference map indicating the location of the various zooms (Images 16d – 16g). Zooms 16d and 16e show the same area before (left panel) and after (right panel) forest clearing. Zooms 16f and 16g show areas of recent forest clearing.

Image 16c. Reference Map. Data: USGS.
Image 16d. High-resolution zoom A; deforestation outside the Grupo Palmas project. Data: Google Earth, WorldView-2 from Digital Globe (NextView).
Image 16e. High-resolution zoom B; forest clearing within the Grupo Palmas project. Data: Google Earth, WorldView-2 from Digital Globe (NextView).
Image 16f. High-resolution zoom C. Data: Google Earth, WorldView-2 from Digital Globe (NextView).
Image 16g. High-resolution zoom D. Data: Google Earth, WorldView-2 from Digital Globe (NextView).

References

This work builds off of information presented in the following publication: Environmental Investigation Agency. Deforestation by Definition. 2015. Washington, DC. Link: http://eia-global.org/news-media/deforestation-by-definition


Citation

Finer M, Novoa S (2015) Oil Palm-driven Deforestation in the Peruvian Amazon (Part 2: Shanusi) MAAP: Image #16. Link: https://maaproject.org/2015/10/image16-shanusi/