In the previous MAAP #25 and MAAP #26, we illustrated deforestation hotspots in the Peruvian Amazon for the periods 2012-2014 and 2015*, respectively. Here in MAAP #32, we present a complementary analysis based on the size of deforestation events.
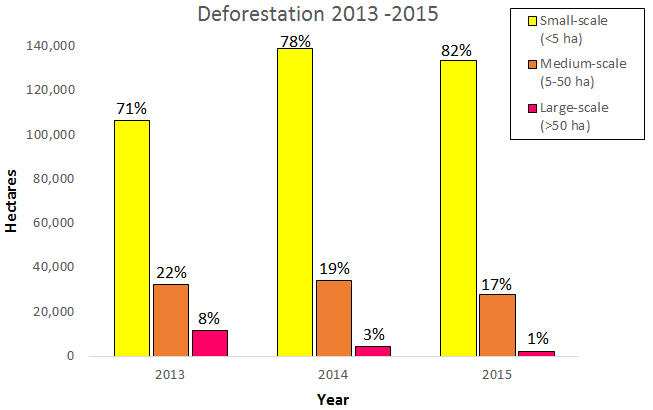
Graph 32a shows the comparative results of deforestation patterns between 2013 and 2015, indicating that:
– Small-scale (< 5 hectares) accounted for the vast majority of deforestation events (70-80%) each year.
– Medium-scale (5-50 hectares) accounted for approximately 20% of the deforestation events each year.
– Large-scale (> 50 hectares) deforestation was variable. In 2013, the year with the most activity of new cacao and oil palm plantations, it accounted for 8% of the deforestation events. In 2015 it was only 1%.
In summary, small- and medium-scale deforestation events represent more than 90% of the total and a constant threat, while large-scale deforestation events represents a latent threat. As described below, large-scale projects can quickly cause massive deforestation events, and should therefore remain a high priority.
*We have increased our deforestation estimate for 2015 to 163,238 hectares (403,370 acres), the second highest on record (behind only 2014). This estimate is based on GLAD alerts, produced by University of Maryland, Google, and Global Forest Watch.
Base Map
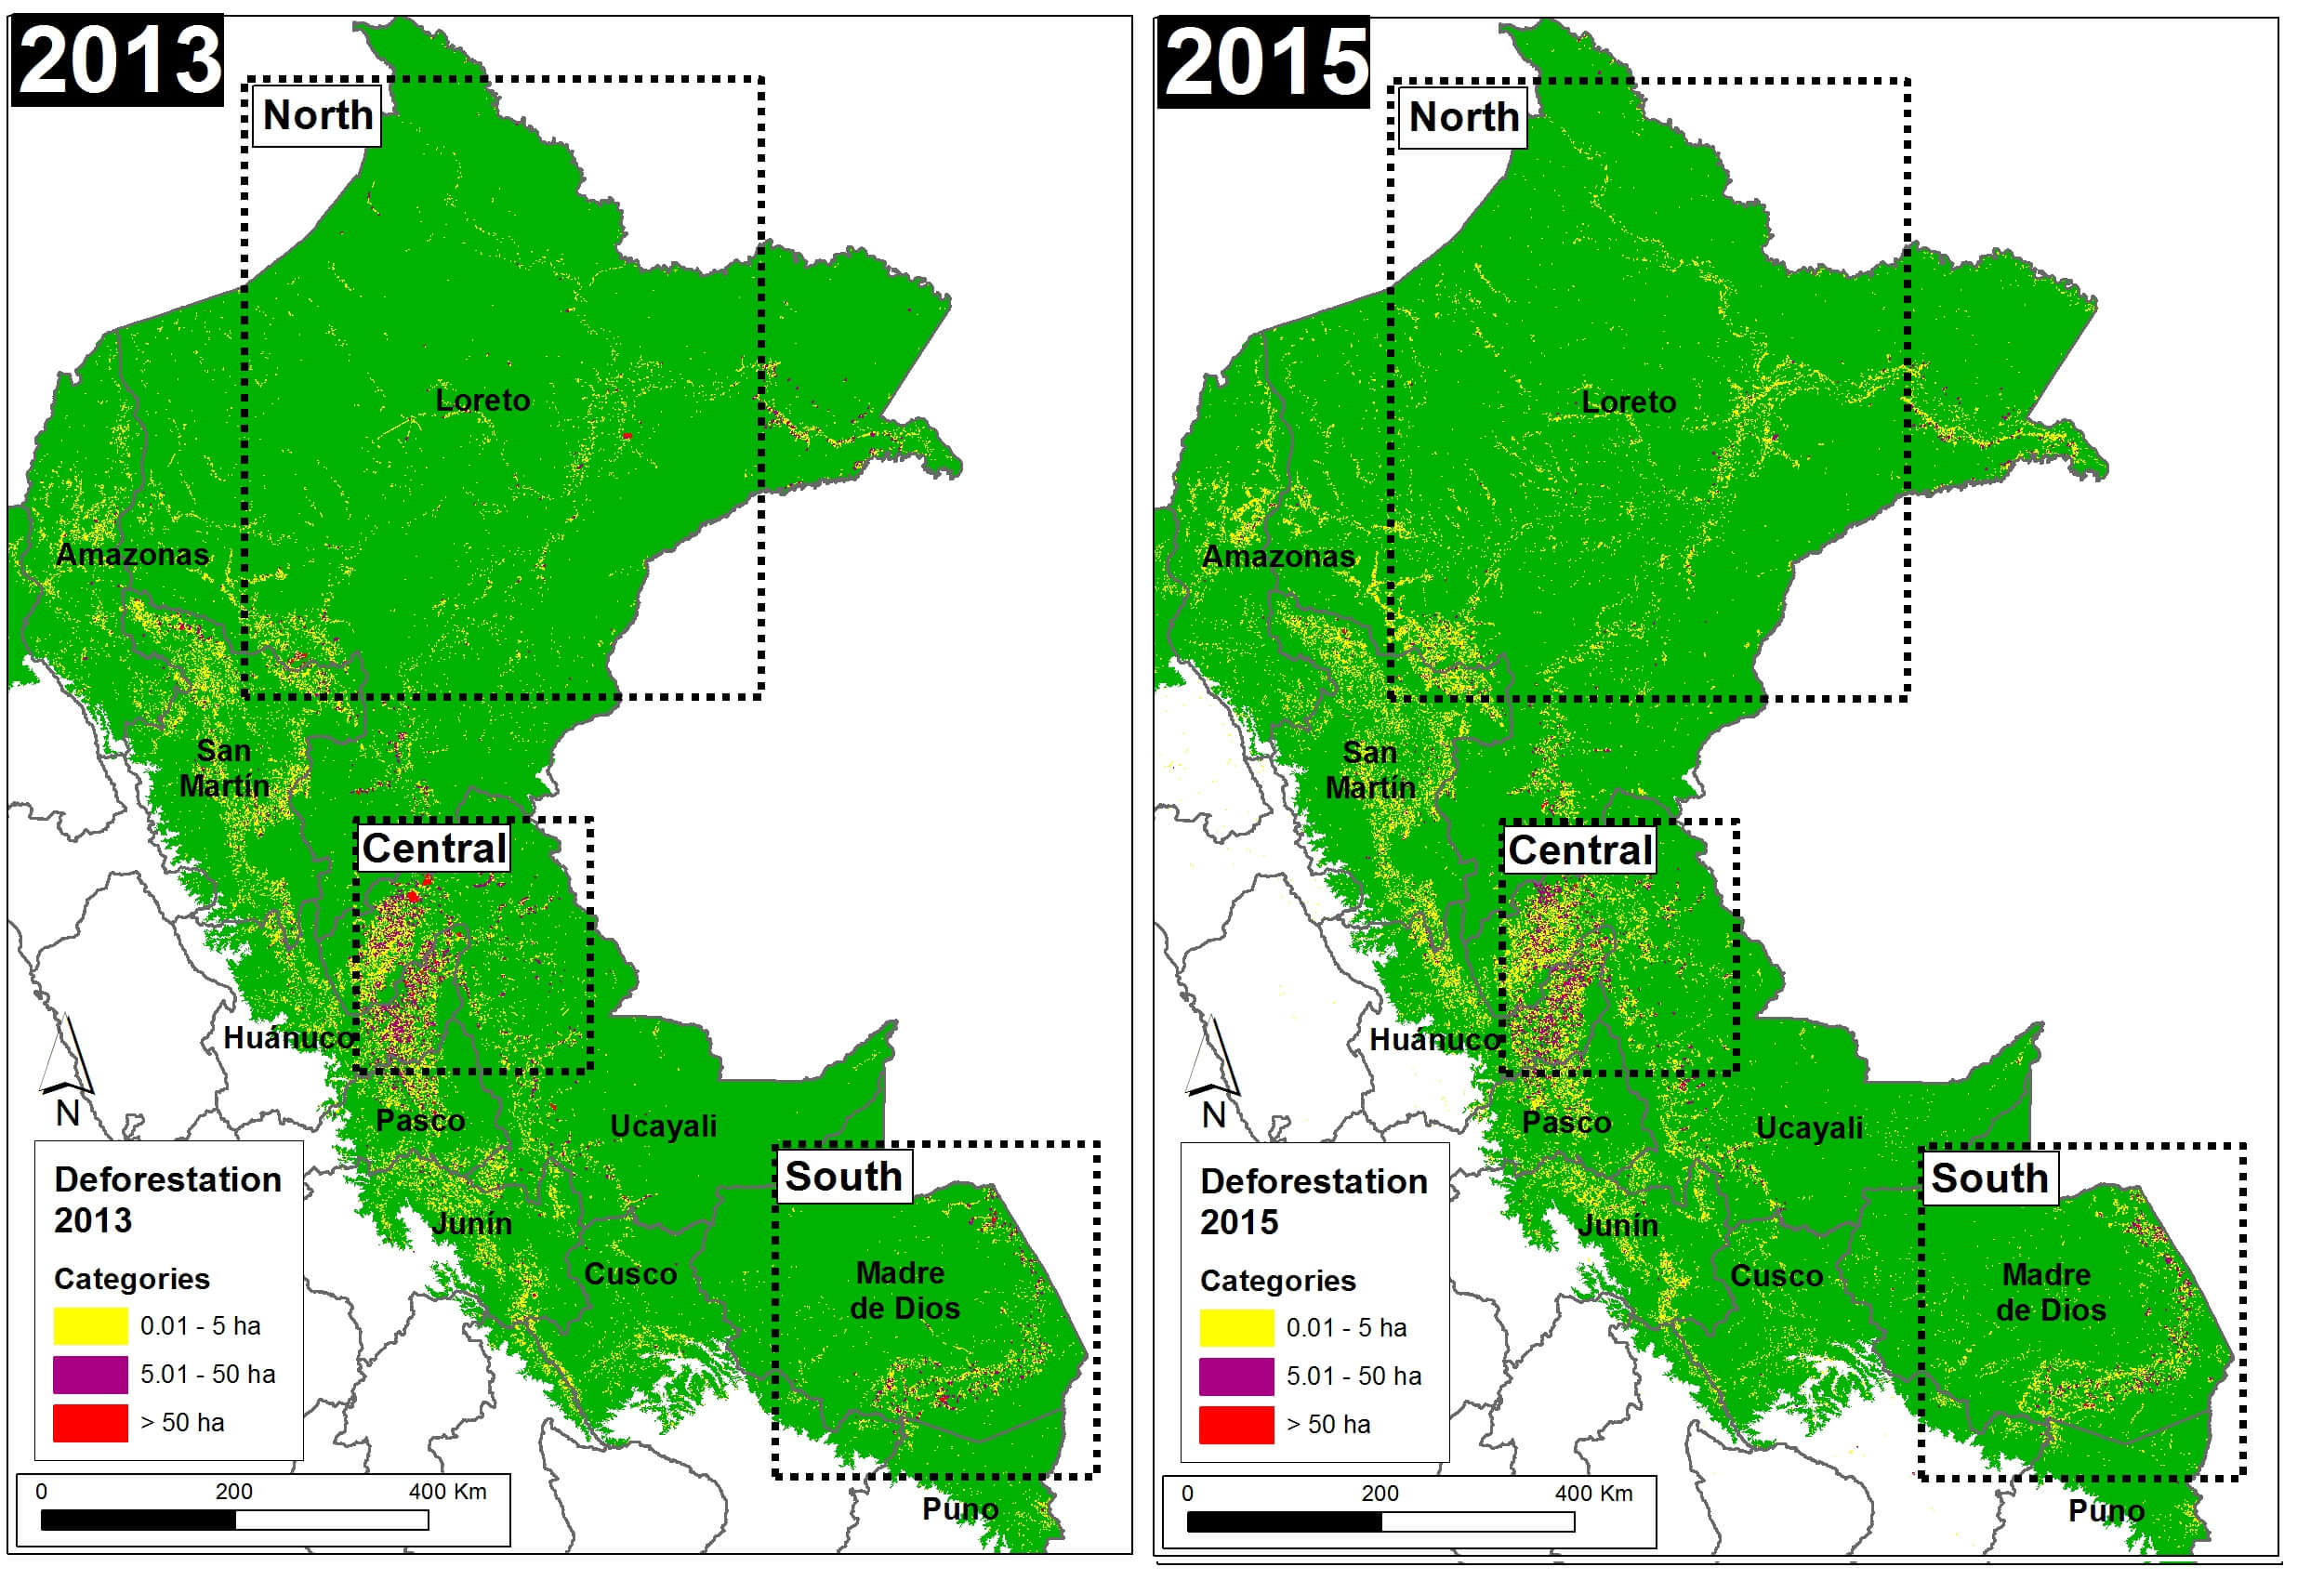
Image 32a shows, in graphic form, the deforestation patterns described above for 2013 (left panel) and 2015 (right panel). Further below, we show zooms for three key zones in the north, central, and south, respectively.
Northern Peruvian Amazon
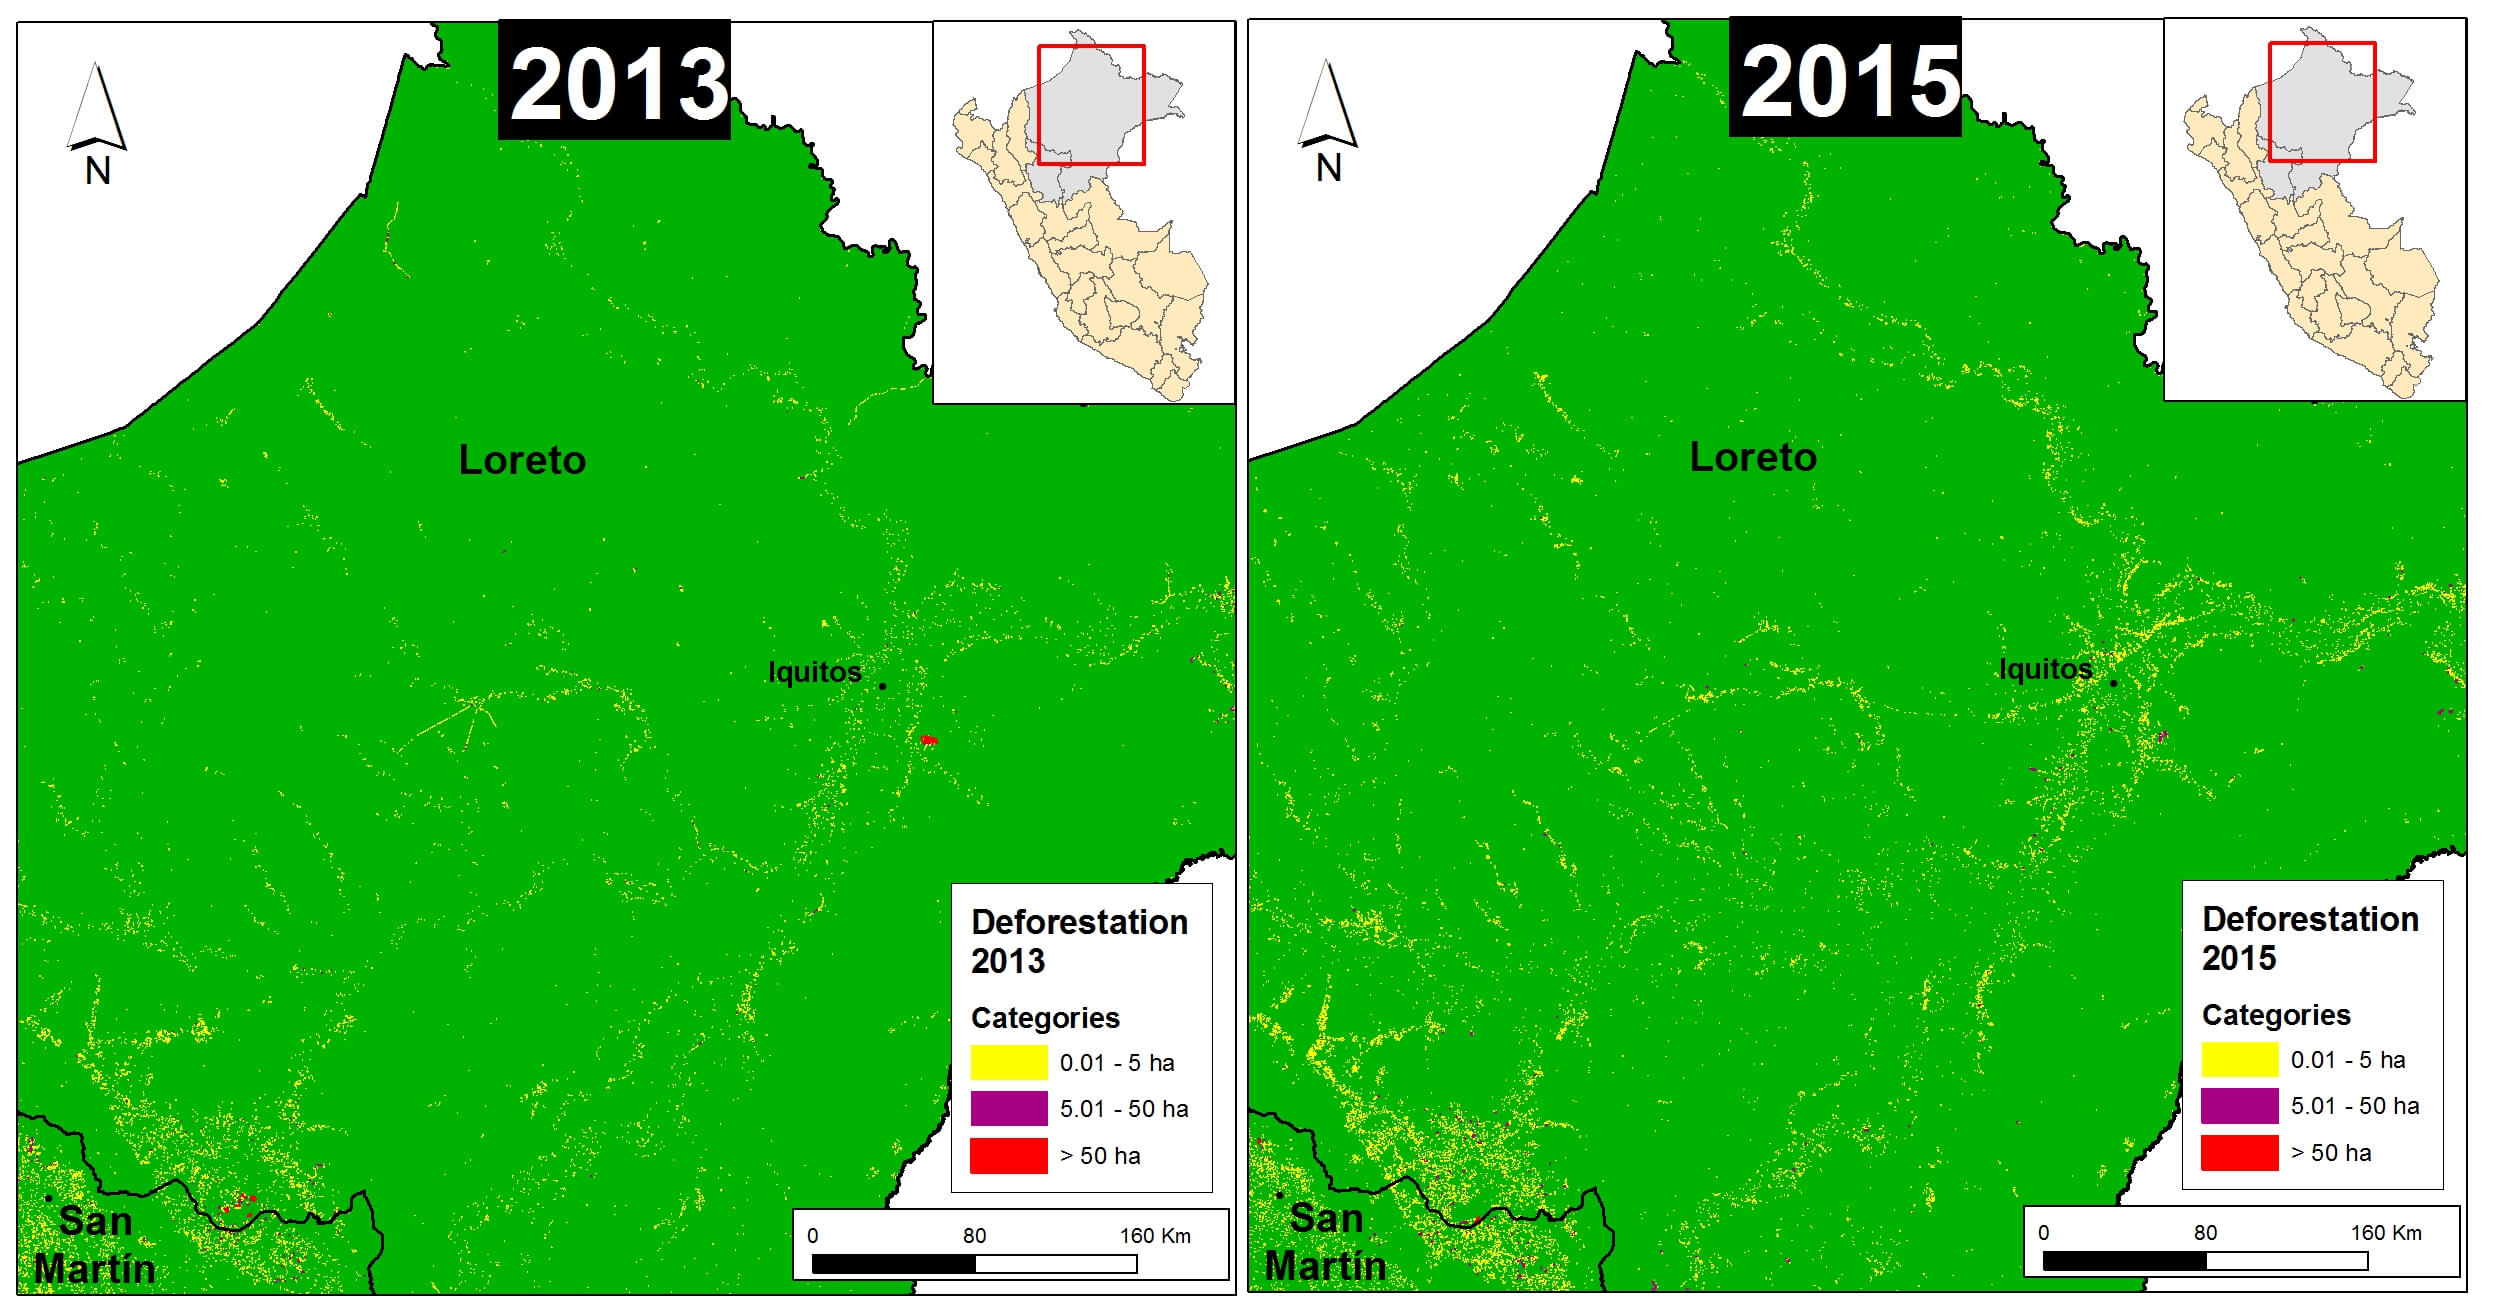
Image 32b shows a zoom of the northern Peruvian Amazon for 2013 (left panel) and 2015 (right panel). In general, there is a pattern of small-scale deforestation along the rivers of Loreto. Additionally, in 2013, there were large-scale deforestation events for a cacao project located to the southeast of the city of Iquitos (see MAAP #27 for more details) and for oil palm plantations along the border of Loreto and San Martin regions (see MAAP #16 for more details). In 2015, the expansion of deforestation continued in these areas, but at a medium-scale.
Central Peruvian Amazon
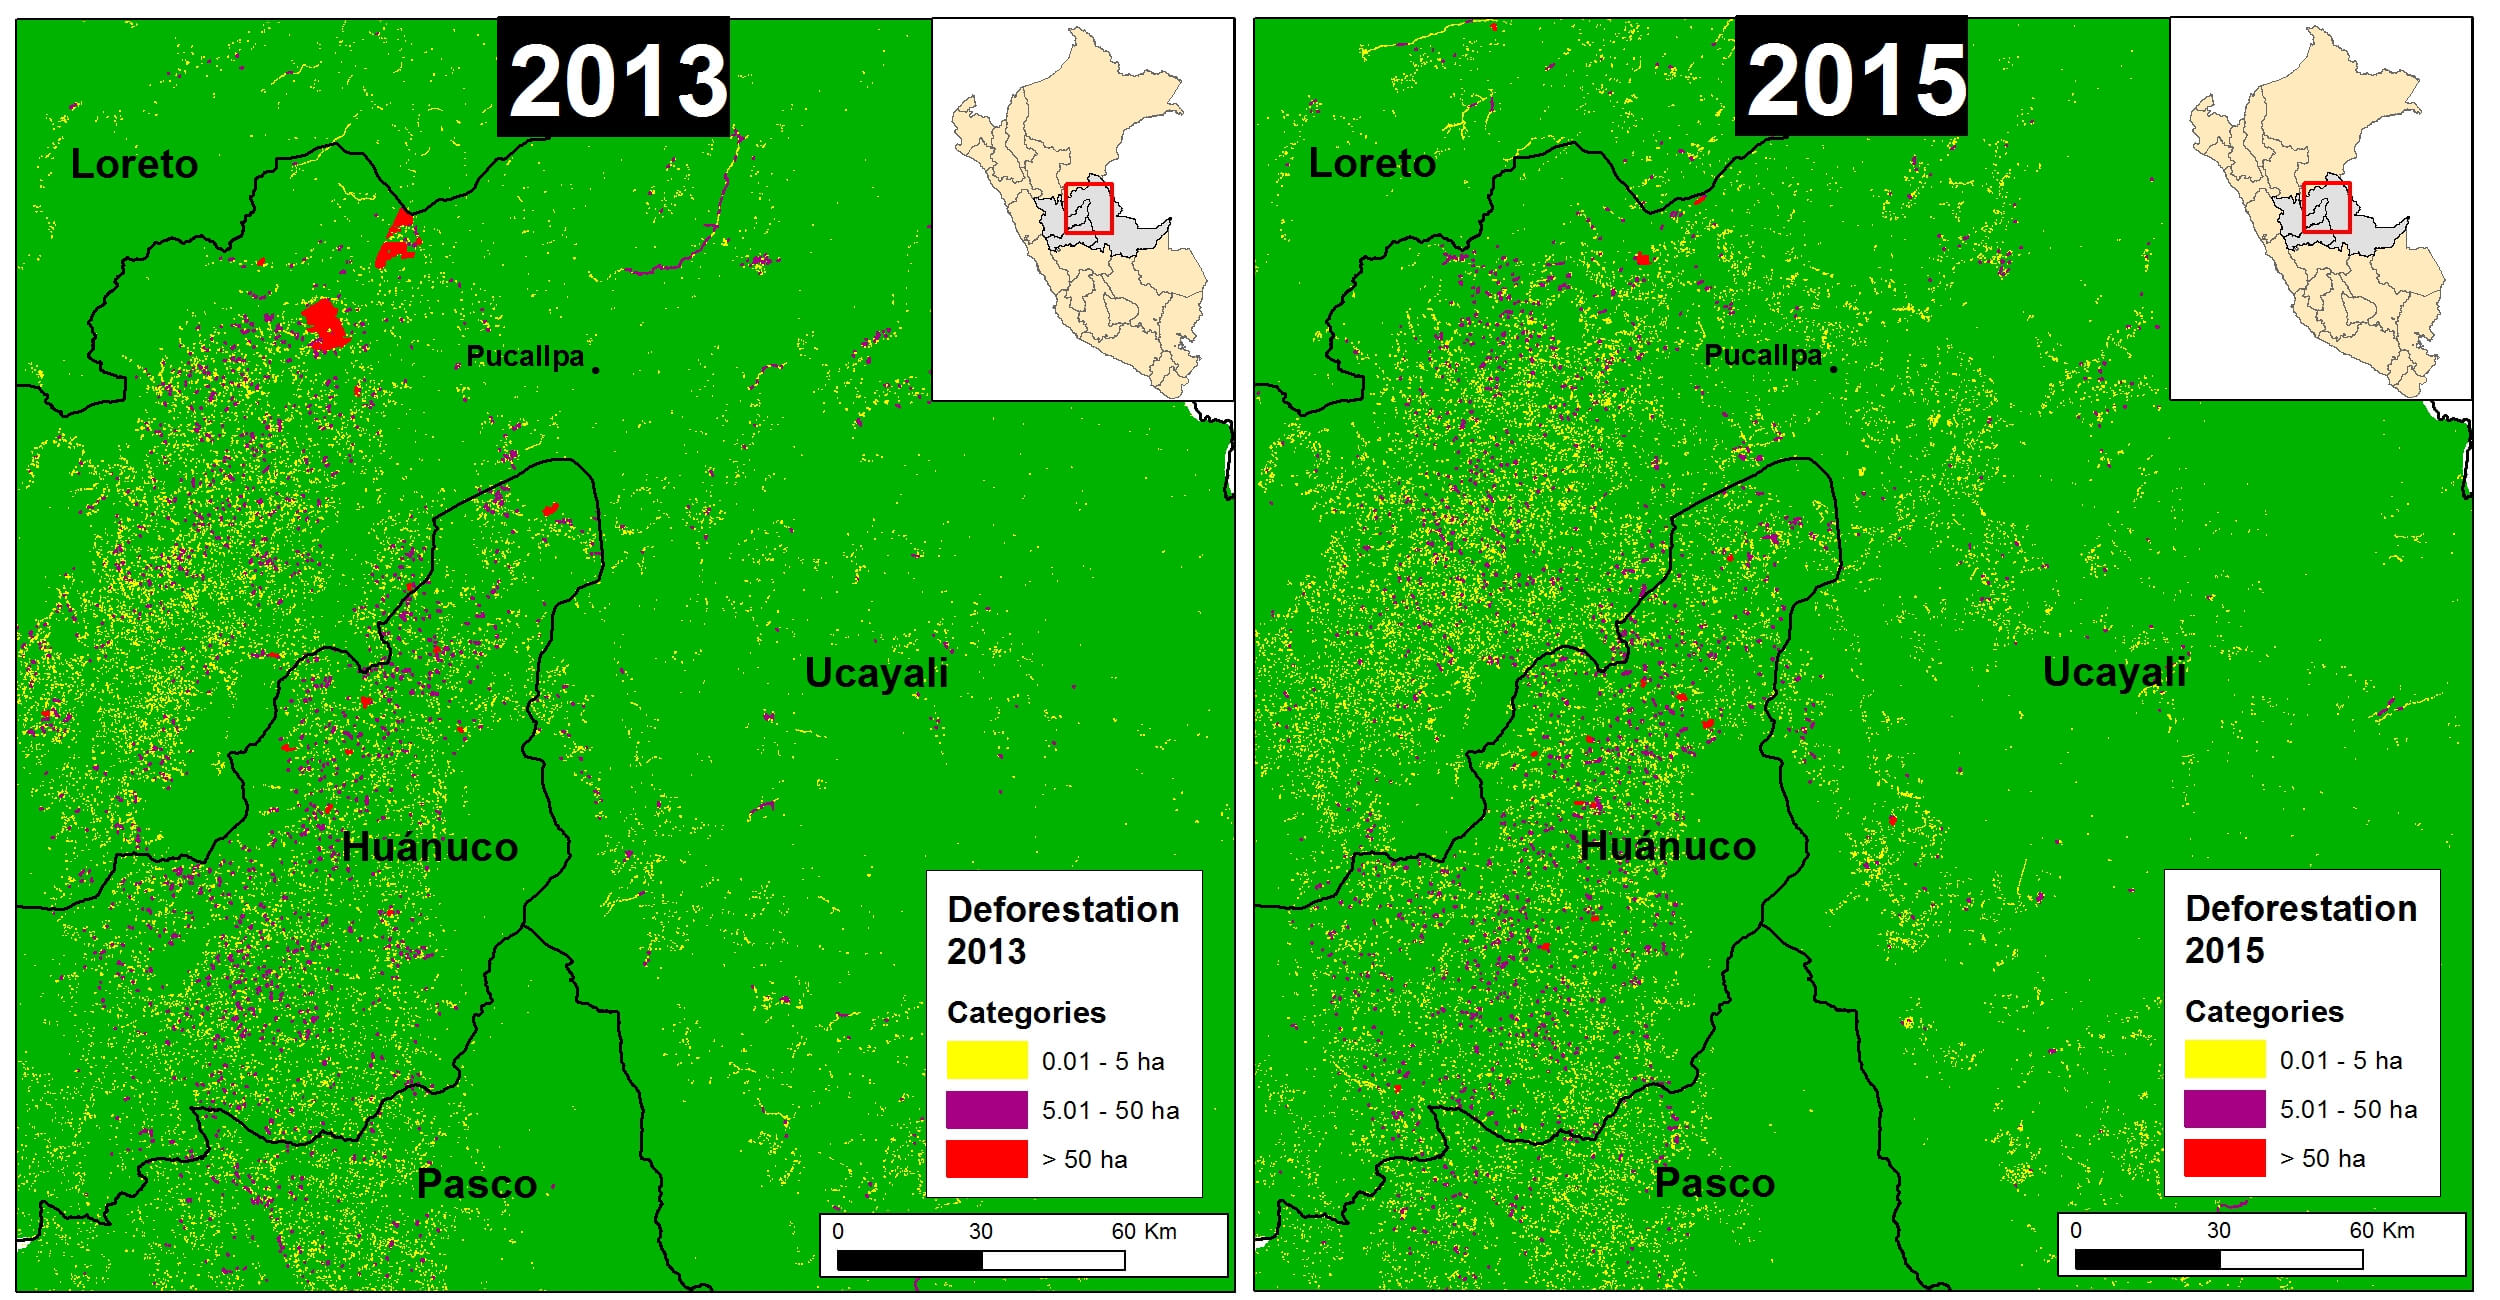
Image 32c shows a zoom of the central Peruvian Amazon for 2013 (left panel) and 2015 (right panel). In general, there is a concentration of small- and medium-scale deforestation between northwest Ucayali and southeast Huánuco. Additionally, in 2013, there is large-scale deforestation for two new oil palm plantations located northeast of the city of Pucallpa (see MAAP #4 for more details).
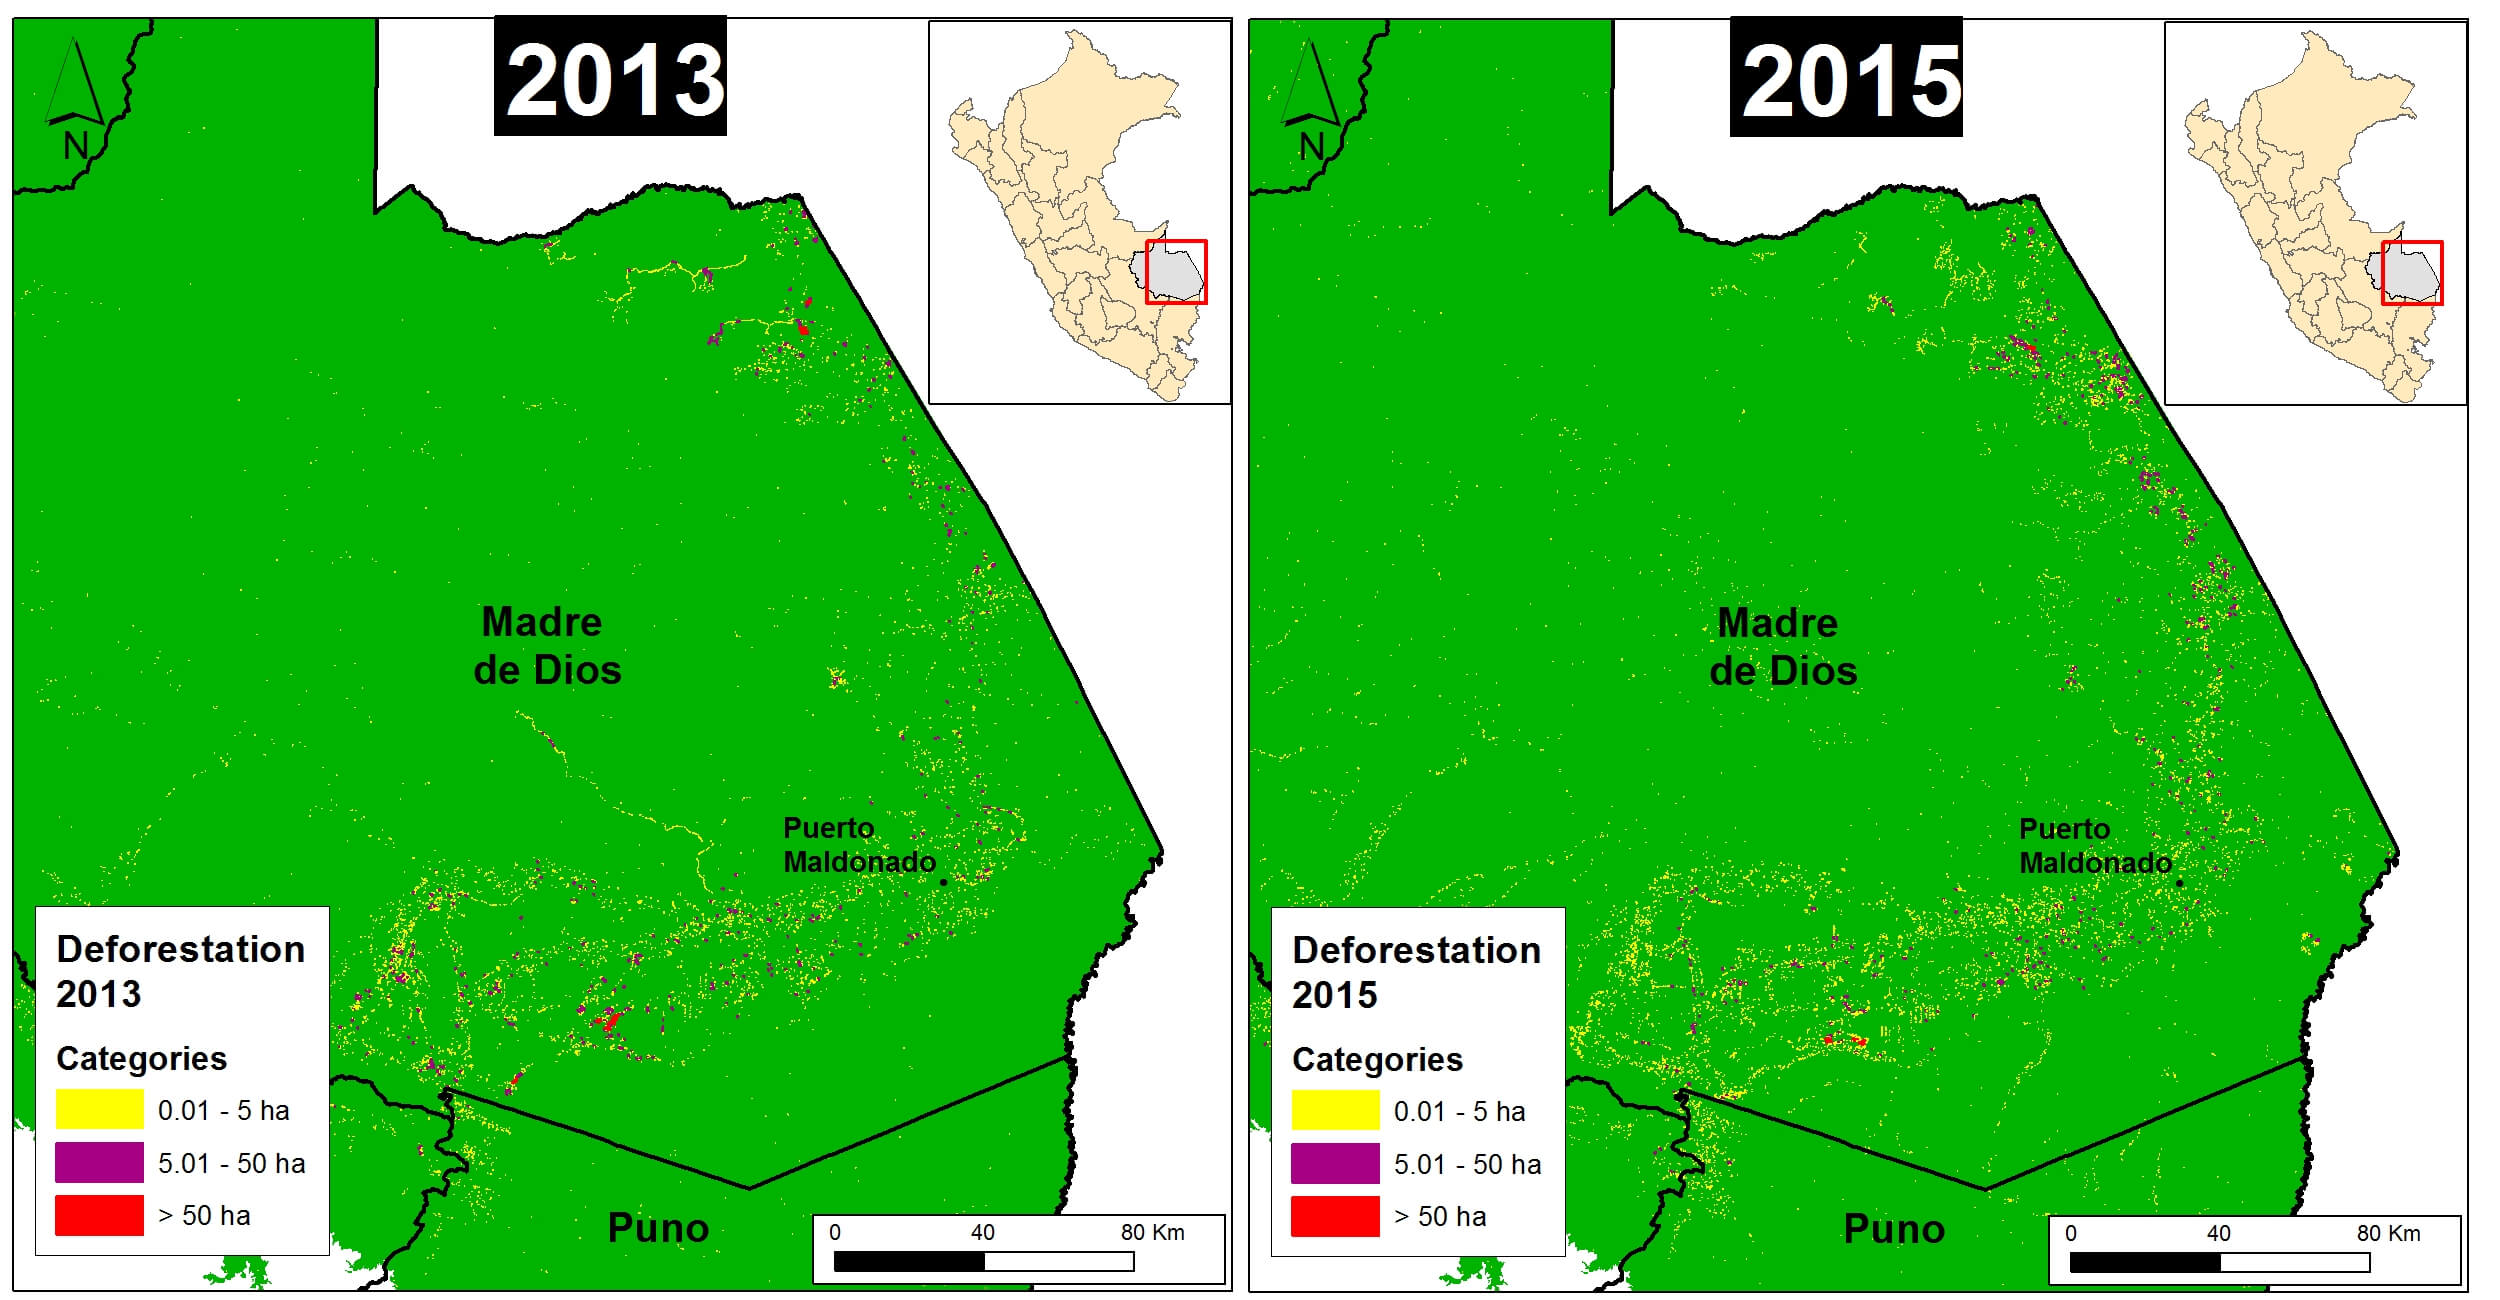
Southern Peruvian Amazon
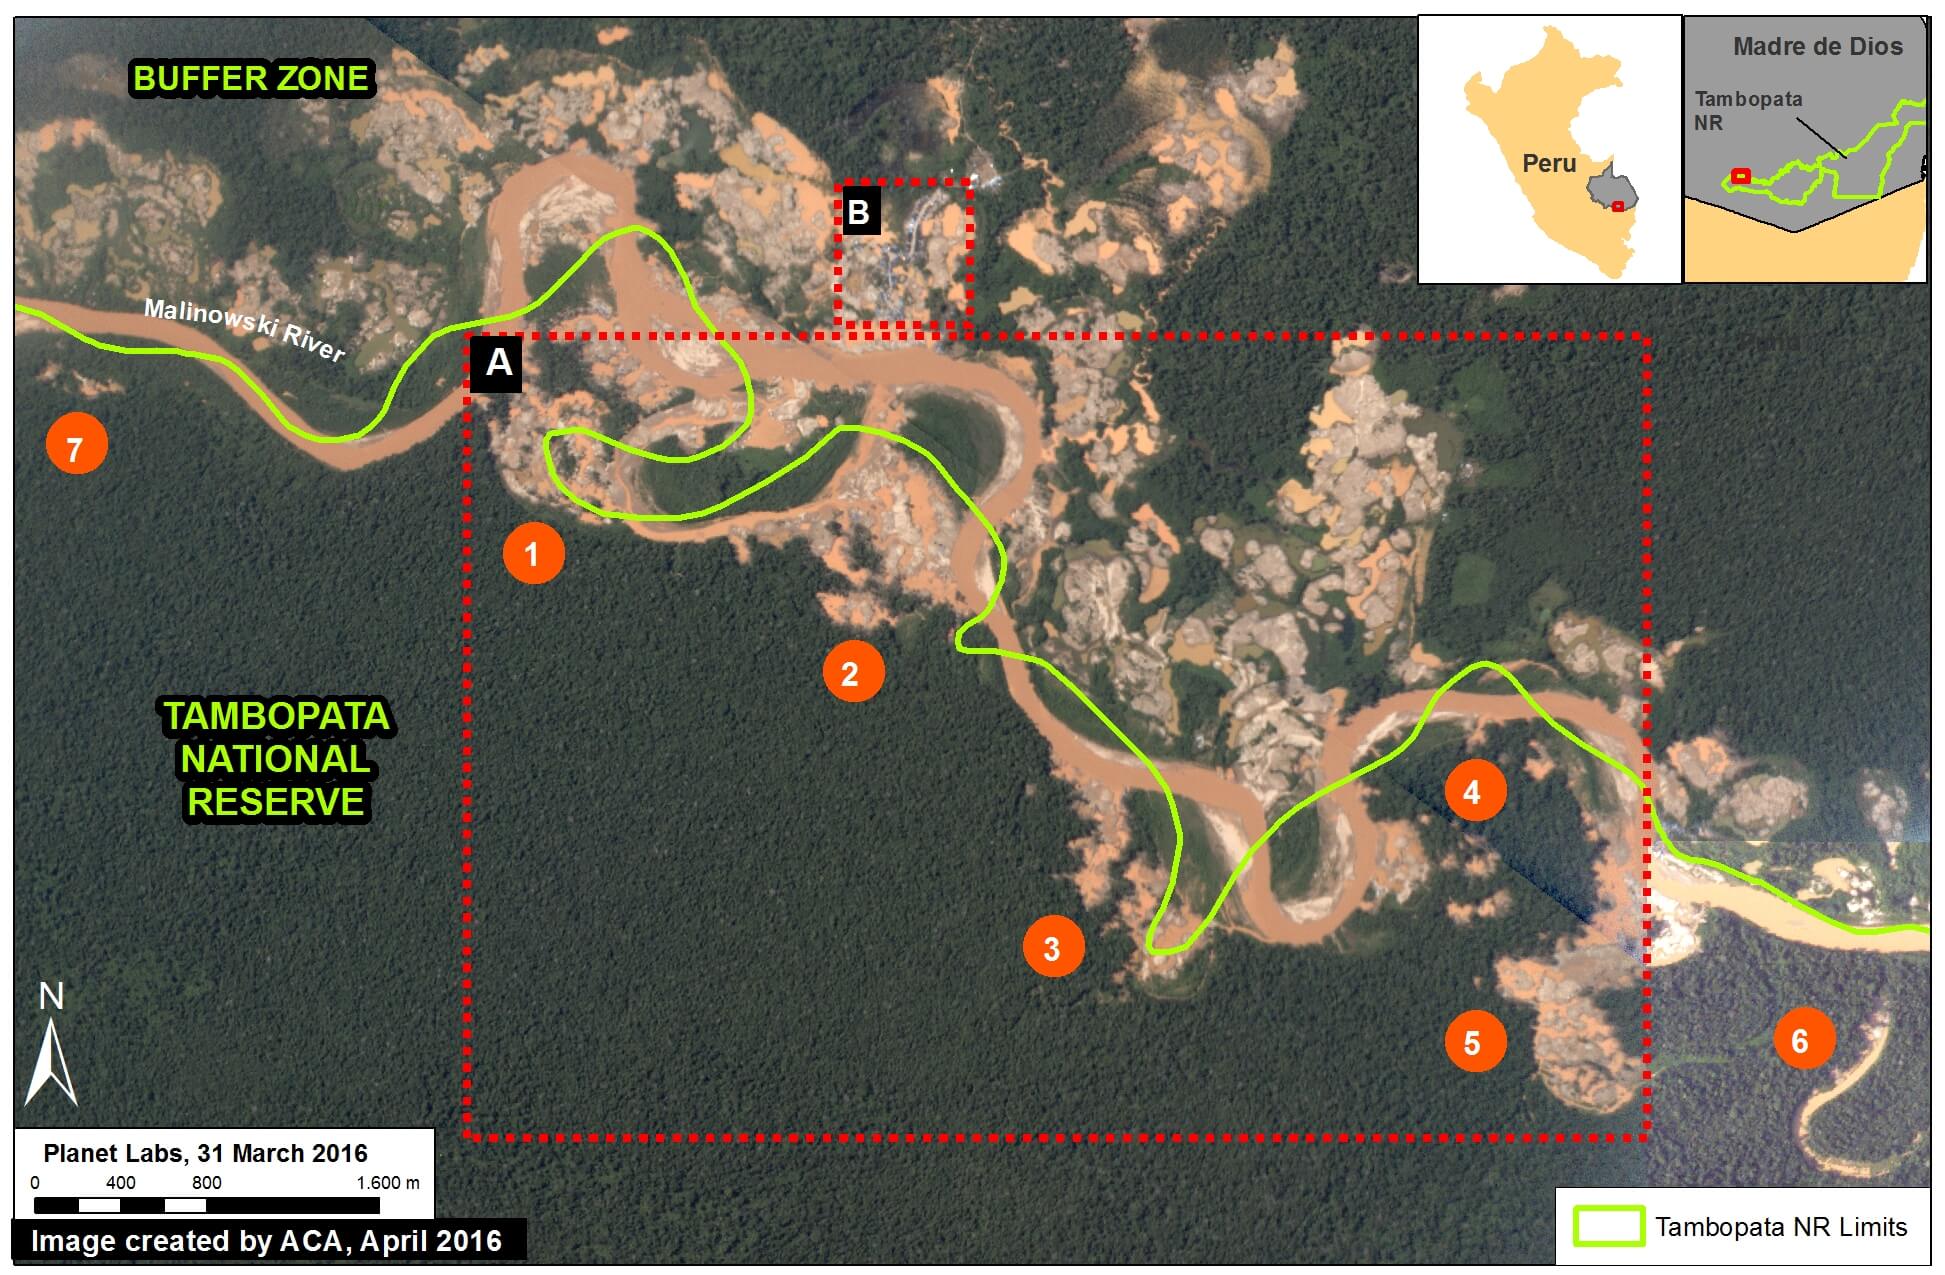
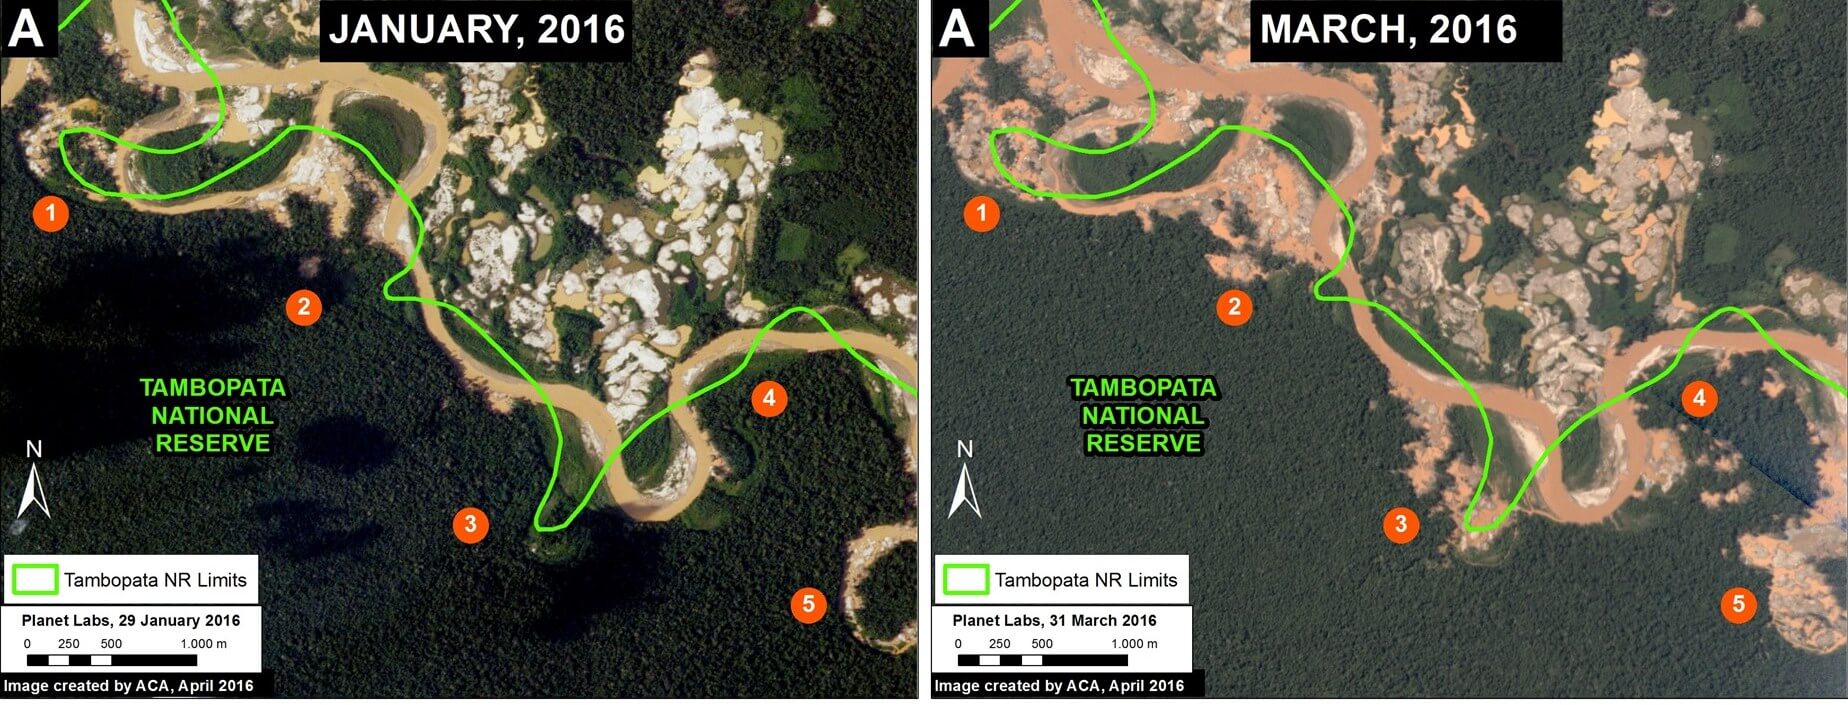
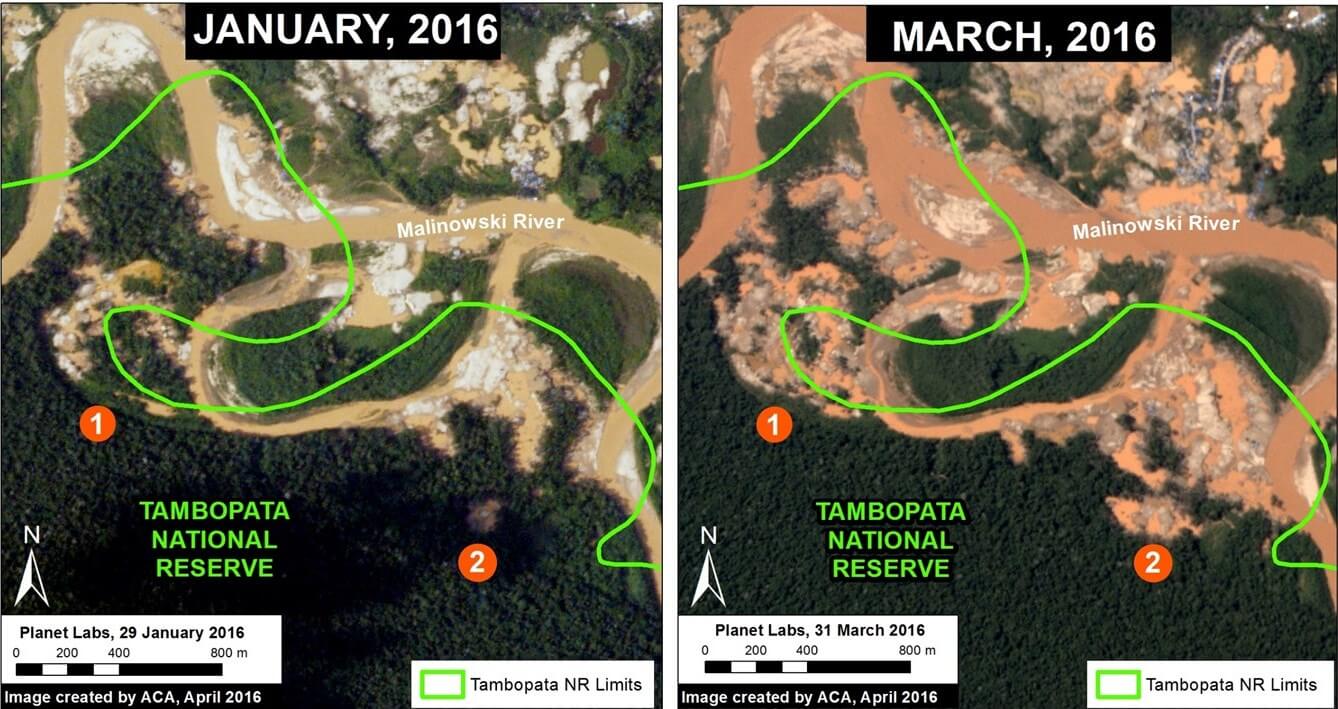
Image 32d shows a zoom of the southern Peruvian Amazon for 2013 (left panel) and 2015 (right panel). In general, there is a pattern of small- and medium-scale deforestation along the Interoceanic highway in Madre de Dios. Additionally, there is the persistence of large-scale deforestation in southern Madre de Dios related to illegal gold mining (see MAAP #12 for more details).
Citation
Finer M, Novoa S (2016) Large-scale vs. Small-scale Deforestation in the Peruvian Amazon. MAAP: 32.


 Loading...