MAAP #38: United Cacao Deforestation in Area Classified As “Forest Production”

The Peruvian Ministry of Agriculture and Irrigation (MINAGRI) recently issued a resolution approving the Update of the Soil and Optimum Land Use Suitability Studies for Areas in the Loreto Region. It is important to emphasize that “Optimum Land Use” (Capacidad de Uso Mayor in Spanish)  is not determined by forest cover, but the quantitative interpretation of the soil, climate, and topography.

This new resolution represents an important advance in forest management in Peru because, according to both the previous1 and current2 Forestry Law, if the Optimum Land Use of a particular area is classified as Forest Production or Protection, it is illegal to change the land use to agriculture and cause deforestation. Thus, it is only possible to request land use change if the area has been classified as “Agriculture” (Optimum Land Use Annual Crop, Permanent Crop, or Pasture).3

Here, we analyze the spatial data corresponding to the new resolution. In Image 38a, we show that 92.6% (2,200 hectares) of the deforestation4 associated with the United Cacao project occurred on areas with an Optimum Land Use classification of Forest Production5. This classification “groups the lands in which climatic, terrain and soil conditions are not favorable for intensive cultivation, permanent crops, nor pastures, but for the production of timber species.”
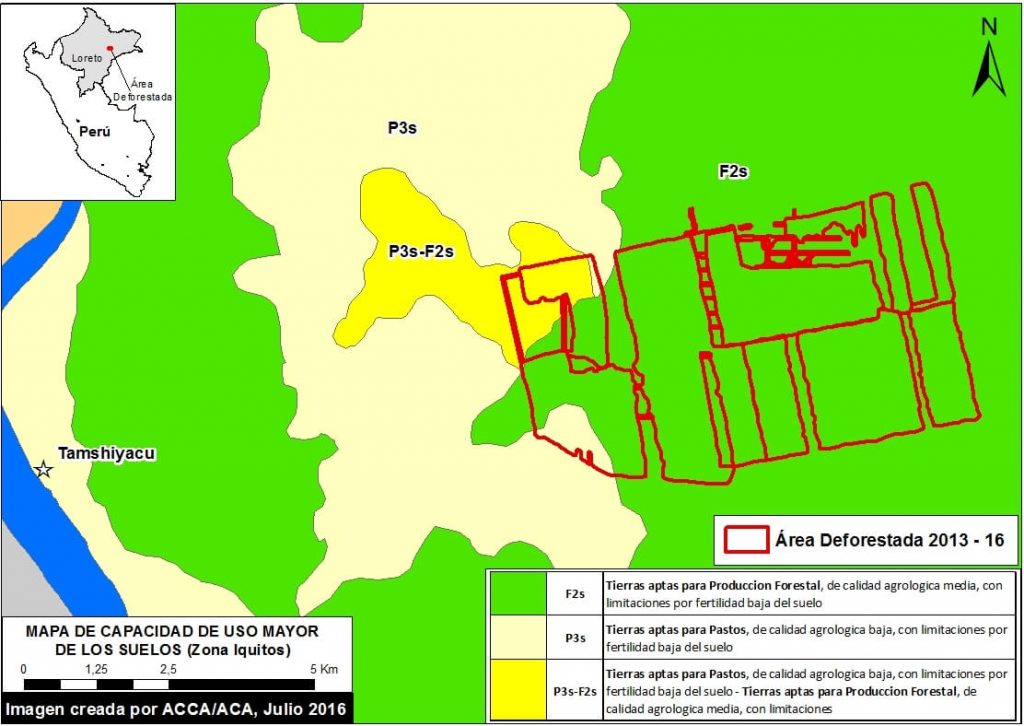
Image 38a. Data: MINAGRI 2016. Red lines indicate areas deforested by United Cacao between 2013 and 2016. Green indicates areas with Optimum Land Use classification of Forest Production, while the yellows indicate areas with Optimum Land Use classification of Agriculture.

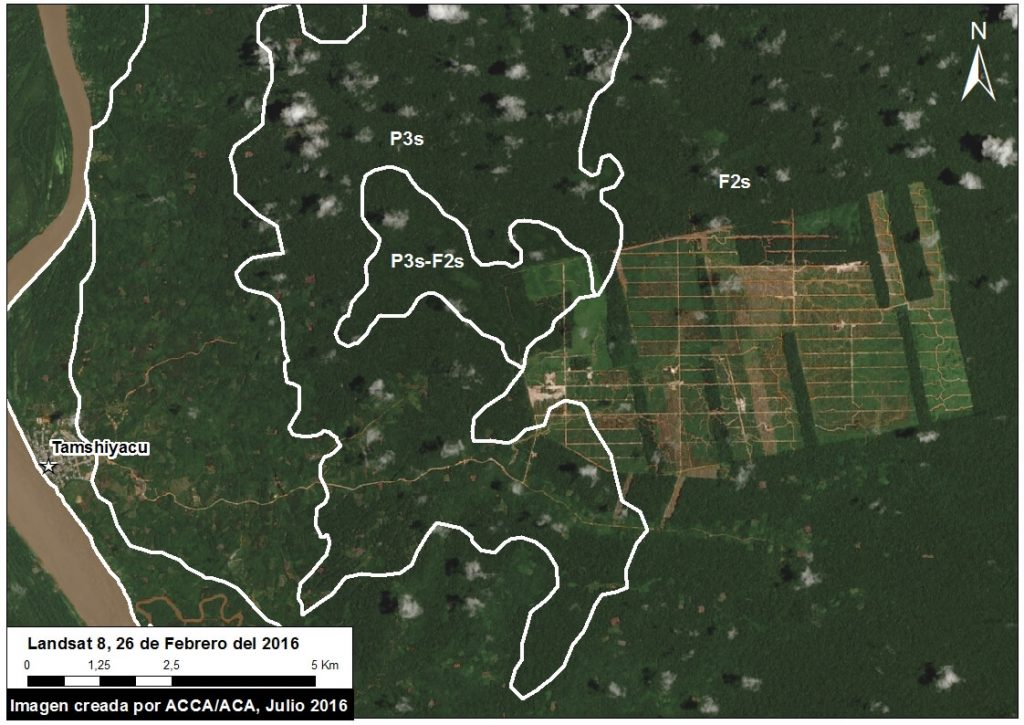
In addition, 3.8% of the deforestation occurred in areas with an Optimum Land Use classification of Pasture/Forestry, while the remaining 3.6% occurred in areas with classification of Pasture. However, it is important to emphasize that even in these areas with an agricultural classification, our analysis of satellite imagery found that they were actually covered with primary forest (see Image 38b).

In conclusion, the vast majority of deforestation caused by United Cacao occurred in areas classified as optimally suited for forest production, where changes in land-use and associated deforestation are not permitted.

Imagen 38b. Data: Landsat/NASA/USGS

Notes

1Ley 27308 Articulo 7. Decreto Supremo 014-2001-AG, Reglamento de la Ley Forestal y de Fauna Silvestre, Art. 36.

2 LEY FORESTAL Y DE FAUNA SILVESTRE (LEY Nº 29763), Artículo 37

3 Decreto Legislativo No. 653, Ley de Promocion de las Inversiones en el Sector Agrario (1991)

4 See MAAP #35 for more information regarding this deforestation.

Specifically, this area is classified as F2s: Tierras Aptas para Producción Forestal (Símbolo F), Clase – Calidad Agrológica Media (Símbolo F2),  Subclase – Limitación por Suelo (Símbolo “s”)


Citation

Finer M, Novoa S, Cruz C (2016) United Cacao deforestation in area classified as “Forest Production.” MAAP: 38.

MAAP #37 Deforestation Hotspot in The Central Peruvian Amazon Driven By Cattle Pasture

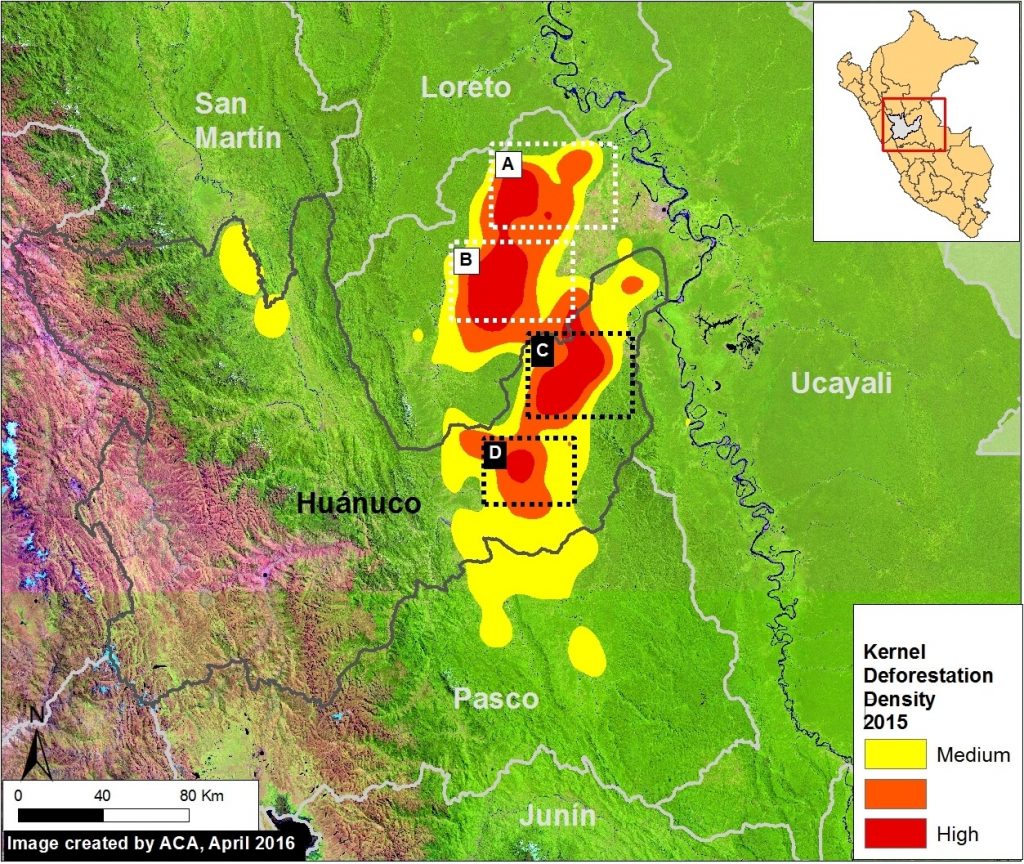
In the previous MAAP #26, we presented a map of Deforestation Hotspots in the Peruvian Amazon during 2015*. This analysis showed that the highest concentration of deforestation is in the central Peruvian Amazon.

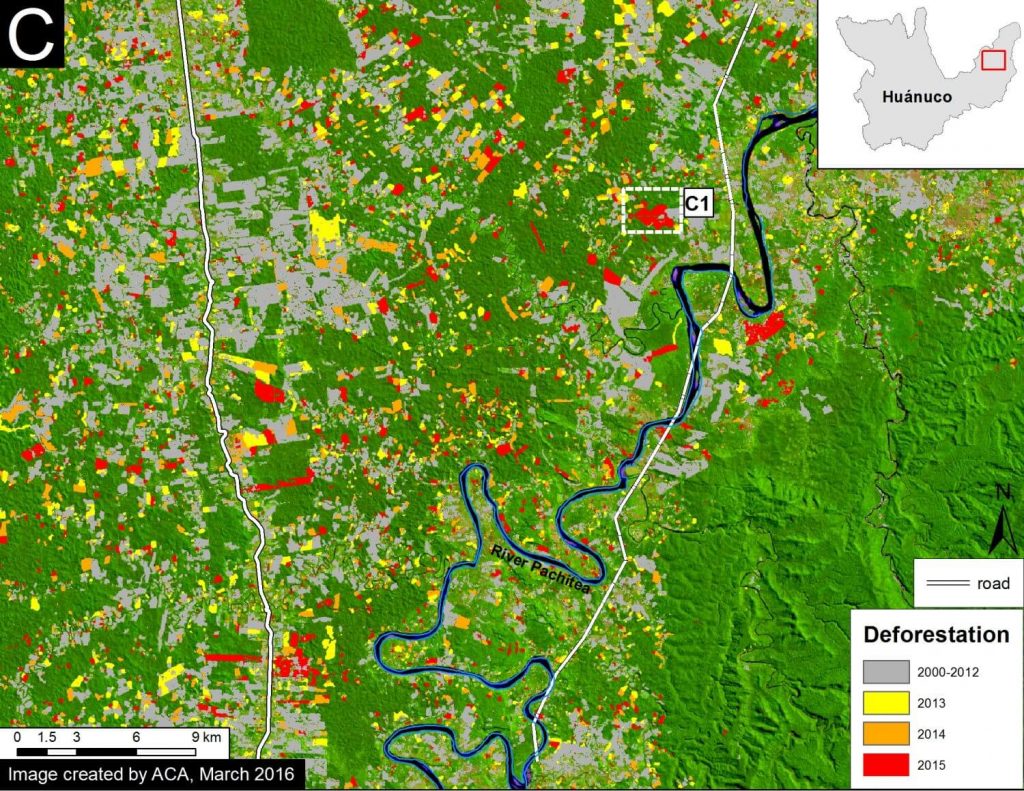
Here in MAAP #37, we focus on this region, as indicated by Image 37a. Specifically, we analyze the hotspots shown in Insets C and D, located in the eastern section of the department of Huanuco.

(Note that we previously described the hotspots indicated by Insets A and B, located in northwest Ucayali department, in MAAP #26).

For 2015, we calculated a total deforestation of 7,930 hectares (19,595 acres) in the area indicated by these two insets. The main deforestation driver is likely cattle pasture (see below). It is worth noting that the vast majority of the deforested area (87%) is outside of areas zoned for agriculture use.

We calculated an additional deforestation of 16,590 hectares (41,000 acres) in 2013 and 2014. Again, the vast majority of the forest loss appears to be outside areas zoned for agriculture use.

Image 37a. Data: UMD/GLAD

Deforestation Driver: Cattle Pasture

The predominant land use in the area is cattle pasture, so that is likely the leading driver of the documented deforestation.

We took a sample (1,500 hectares) of areas that were deforested in 2014, and found that 76% (1,140 hectares) were converted to cattle pasture in 2015. All sample areas were greater than 5 hectares and had available high-resolution imagery from September 2015. Based on an analysis of the imagery, we estimate that a similar amount of area was being cleared for pasture in 2015.

Below, we show a series of high-resolution images of this deforestation (click each image to enlarge).


Inset C Hotspot

Image 37b shows a detailed view of the deforestation inside the area indicated by Inset C.

In this area, we documented deforestation of 5,050 hectares in 2015. Of this total, 46% of the deforestation events were small-scale (<5 ha), 43% were medium-scale (5-50 ha), and 12% were large-scale (>50 ha).

We calculated an additional deforestation 0f 9,940 hectares in 2013 and 2014.

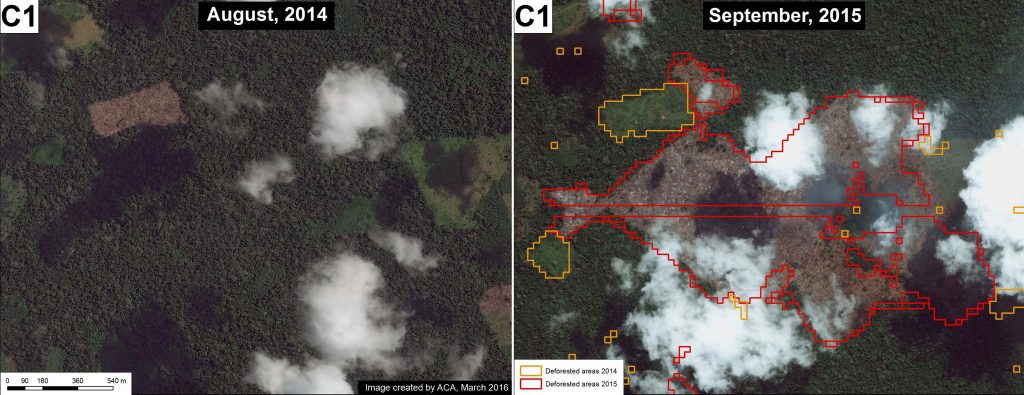
In Image 37c we show, in high resolution, an example of the recent deforestation in this area between August 2014 (left panel) and September 2015 (right panel). See Inset C1 for context.

Image 37b. Data: PNCB/MINAM, UMD/GLAD, MTC

Image 37c. Data: WorldView of Digital Globe (NextView).

Inset D Hotspot

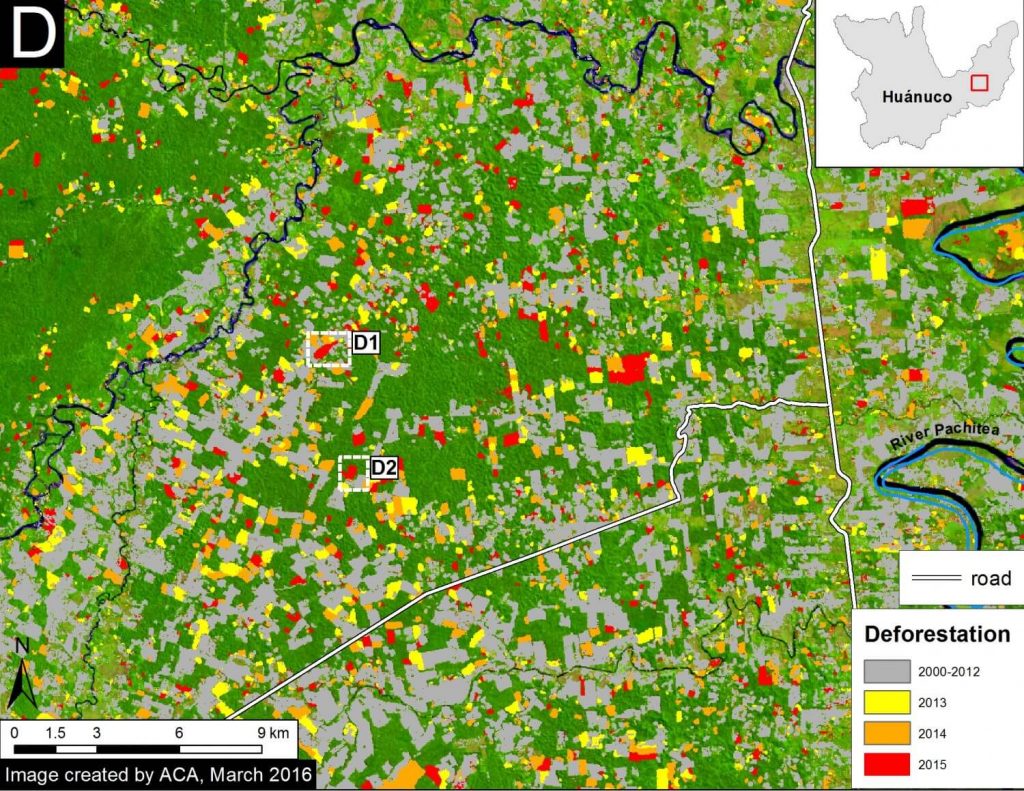
Image 37d shows a detailed view of the deforestation inside the area indicated by Inset D.

In this area, we documented deforestation of 2,883 hectares in 2015. Of this total, 44% of the deforestation events were small-scale (<5 ha), 51% were medium-scale (5-50 ha), and 6% were large-scale (>50 ha).

We calculated an additional deforestation of 6,650 hectares in 2013 and 2014.

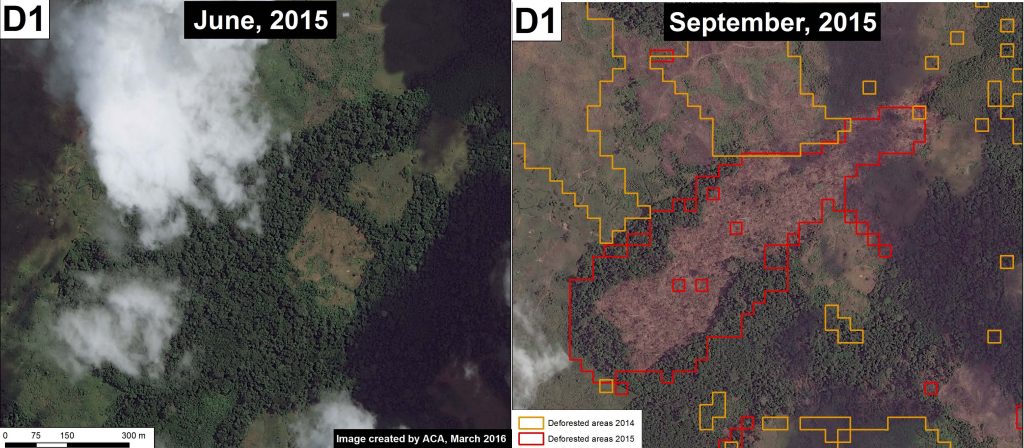
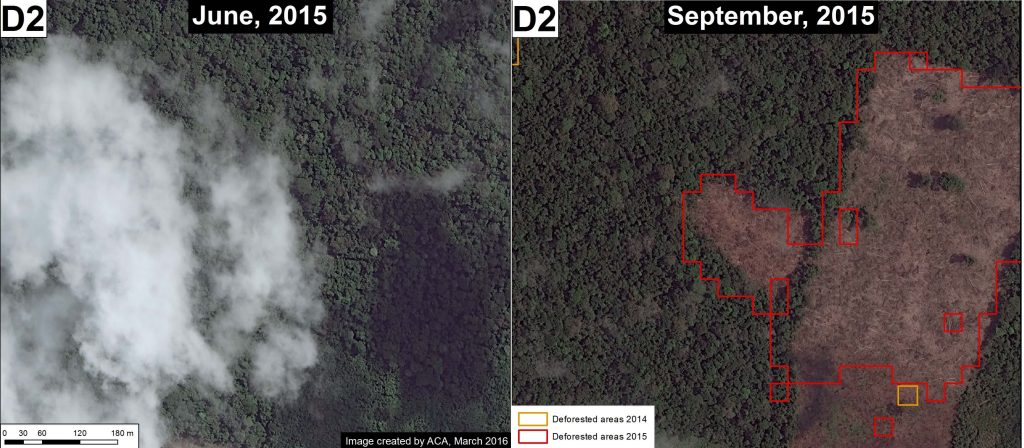
In Images 37e – 37f, we show, in high resolution, two examples of the recent deforestation in this area between June (left panel) and September (right panel) of 2015. See Insets D1 and D2 for context.

Image 37d. Data: PNCB/MINAM, UMD/GLAD, MTC

Image 37e. Data: WorldView of Digital Globe (NextView).

Image 37f. Data: WorldView of Digital Globe (NextView).

References

* Based on the data from the GLAD alerts, produced by the University of Maryland, Google, and Global Forest Watch. http://www.globalforestwatch.org/map/5/-9.31/-75.01/PER/grayscale/umd_as_it_happens

*Hansen, M.C., A. Krylov, A. Tyukavina, P.V. Potapov, S. Turubanova, B. Zutta, S. Ifo, B. Margono, F. Stolle, and R. Moore. Humid tropical forest disturbance alerts using Landsat data. Environ. Res. Lett. 11: 034008.


Citation

Finer M, Novoa S, Cruz C, Peña N (2016) Deforestation Hotspot in the central Peruvian Amazon. MAAP: 37.