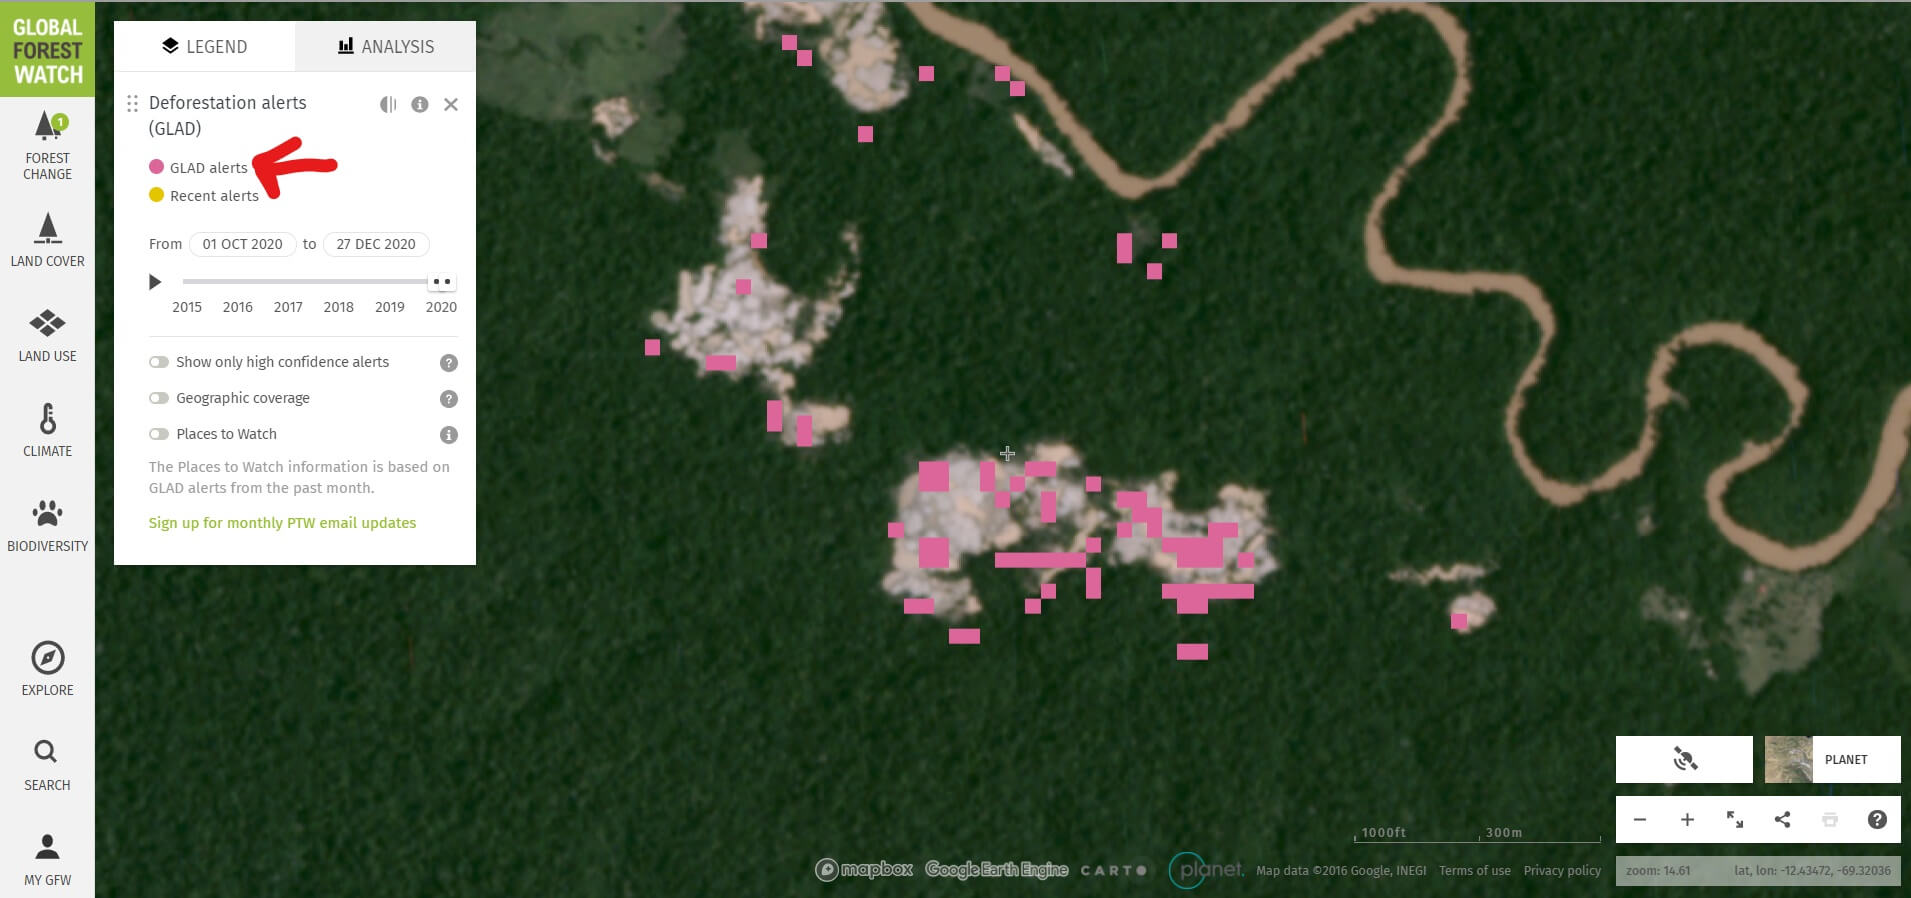
We present a first look at the major hotspots of primary forest loss across the Amazon in 2020 (see Base Map).*
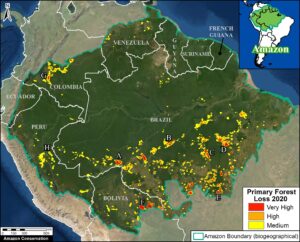
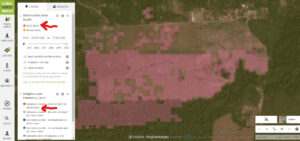
Base Map. Forest loss hotspots across the Amazon in 2020. Data: UMD/GLAD, RAISG, MAAP. The letters A-G correspond to the zoom examples below.
There are several major headlines:
- We estimate over 2 million hectares (5 million acres) of primary forest loss across the nine countries of the Amazon in 2020.*
- The countries with the highest 2020 primary forest loss are 1) Brazil, 2) Bolivia, 3) Peru, 4) Colombia, 5) Venezuela, and 6) Ecuador.
- The majority of the hotspots occurred in the Brazilian Amazon, where massive deforestation stretched across nearly the entire southern region. Many of these areas were cleared in the first half of the year and then burned in July and August. In September, there was a shift to actual forest fires (see MAAP #129).
- Several of the most intense hotspots were in the Bolivian Amazon, where fires raged through the dry forests (known as the Chiquitano) in the southeast region.
- There continues to be an arc of deforestation in the northwestern Colombian Amazon, impacting numerous protected areas.
- In the Peruvian Amazon, deforestation continues to impact the central region. On the positive, the illegal gold mining that plagued the southern region has decreased thanks to effective government action (see MAAP #130).
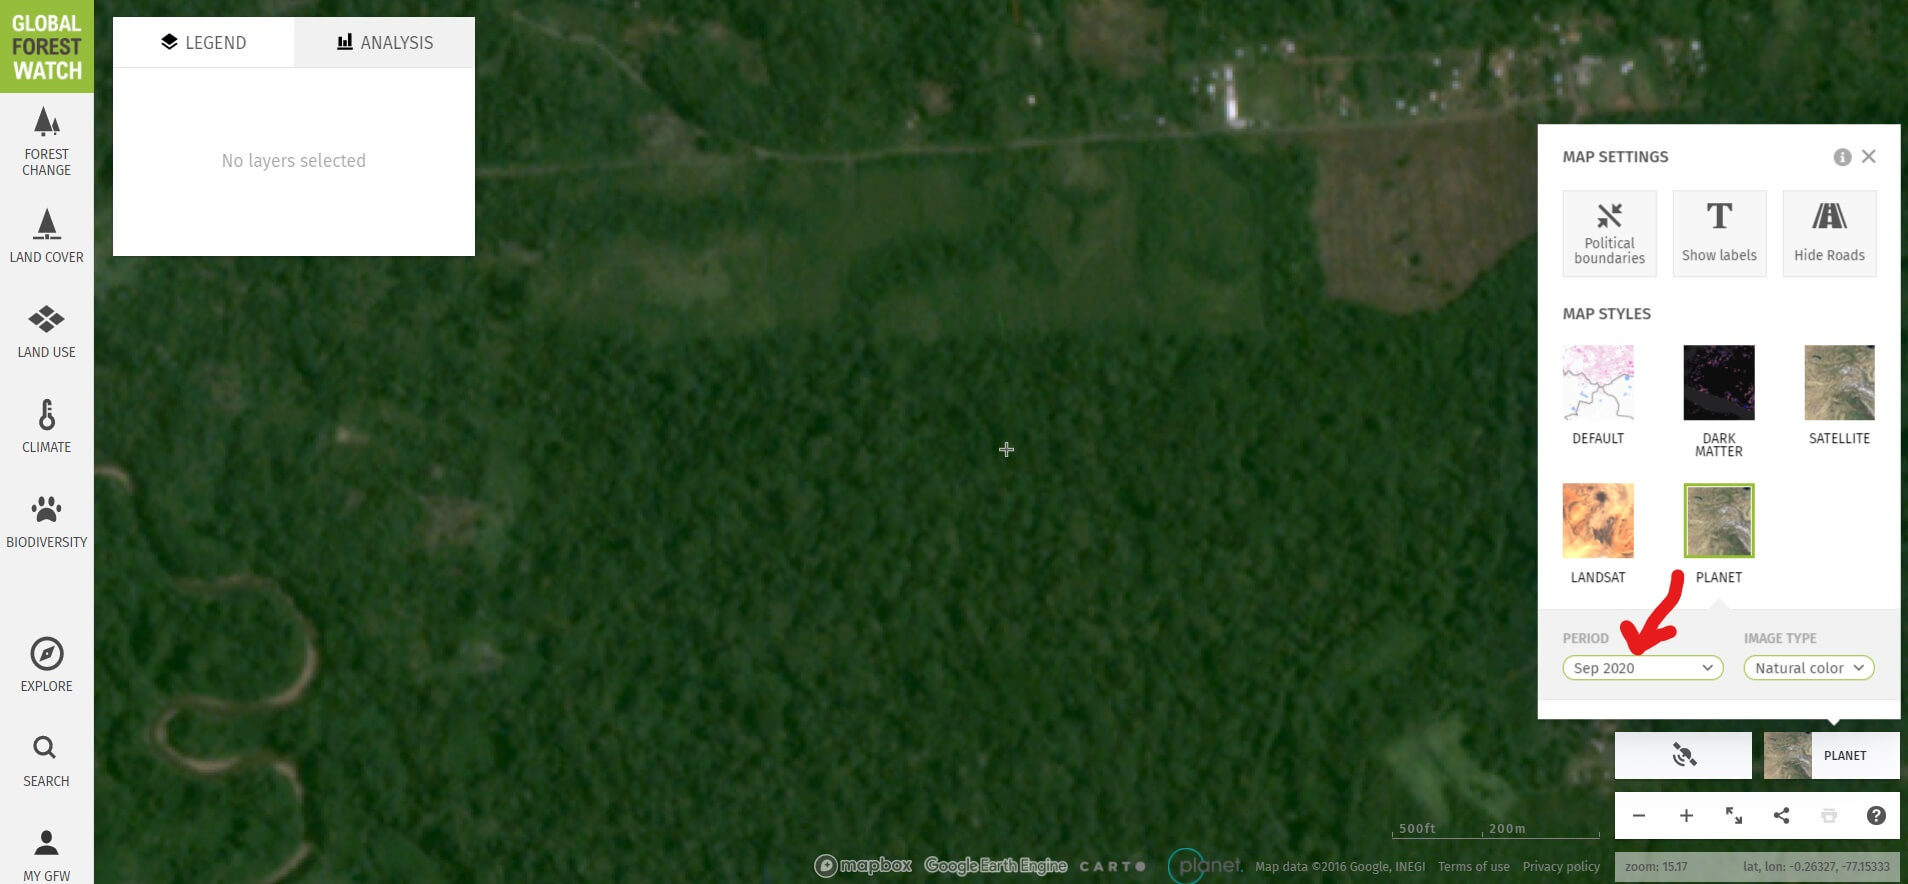
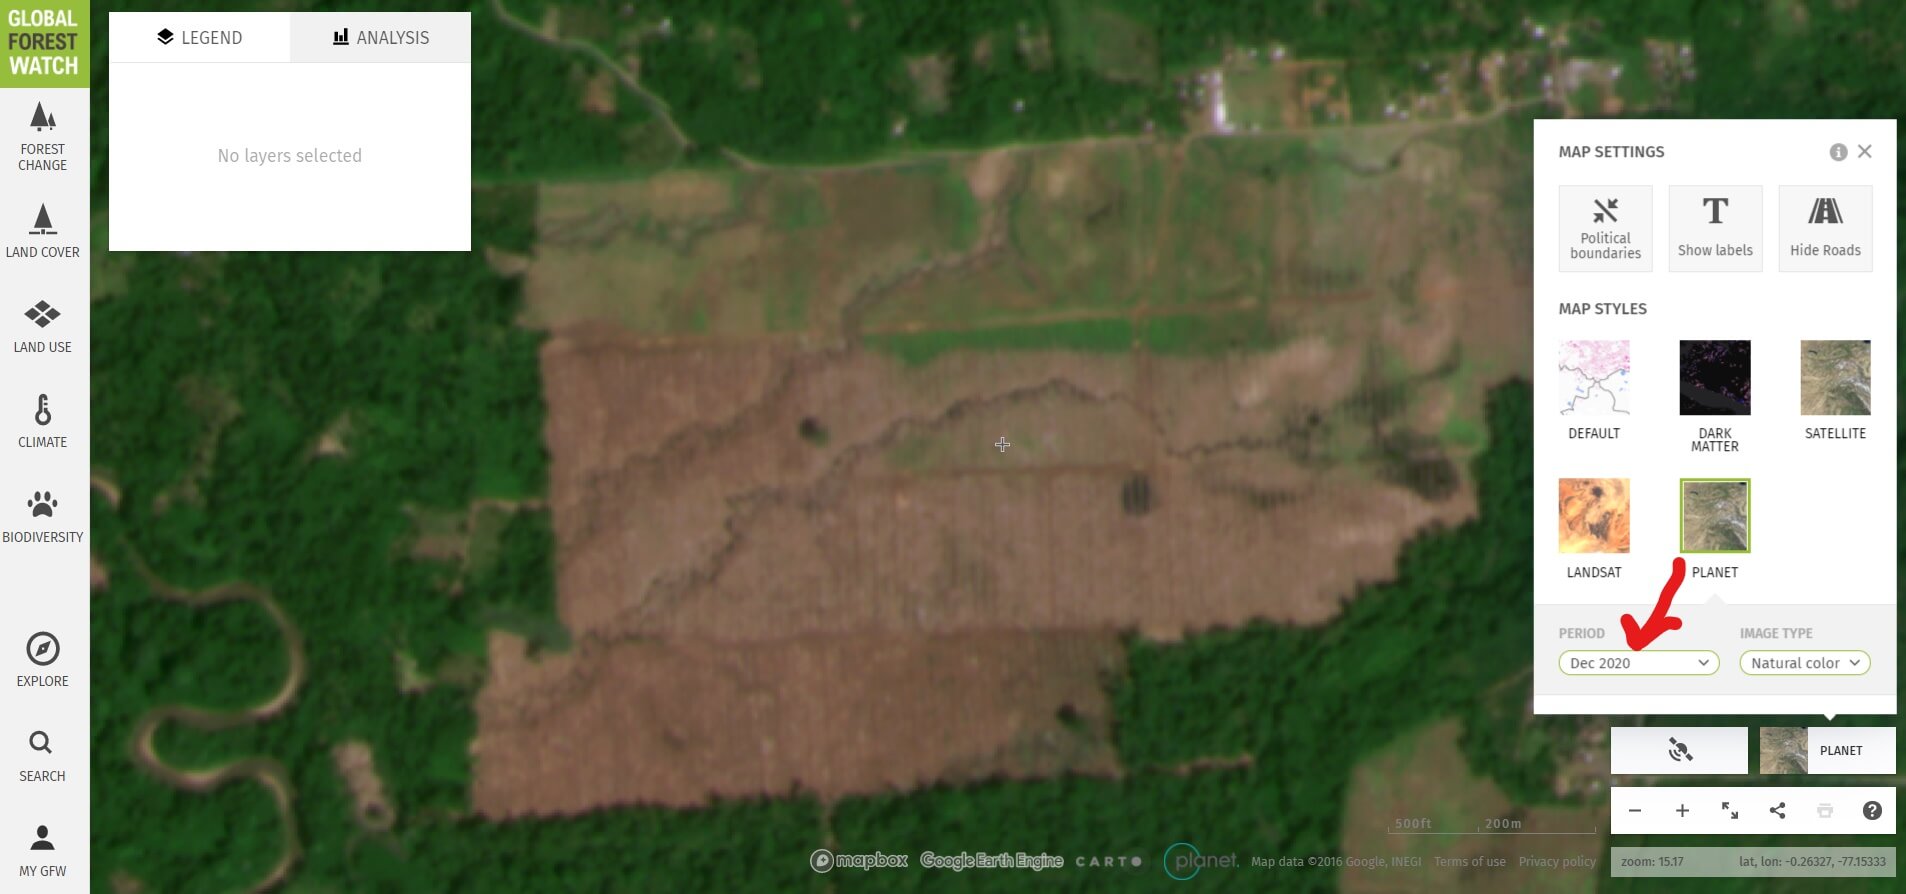
Below, we show a striking series of high-resolution satellite images that illustrate some of the major deforestation events across the Amazon in 2020 (indicated A-G on the Base Map).
Widespread Deforestation in the Brazilian Amazon
Zooms A-C show examples of a troublingly common phenomenon in the Brazilian Amazon: large-scale deforestation events in the first half of the year that are later burned in July and August, causing major fires due to the abundant recently-cut biomass. Much of the deforestation in these areas appears to associated with clearing rainforests for cattle pastures. The three examples below show the striking loss of over 21,000 hectares of primary forest in 2020.
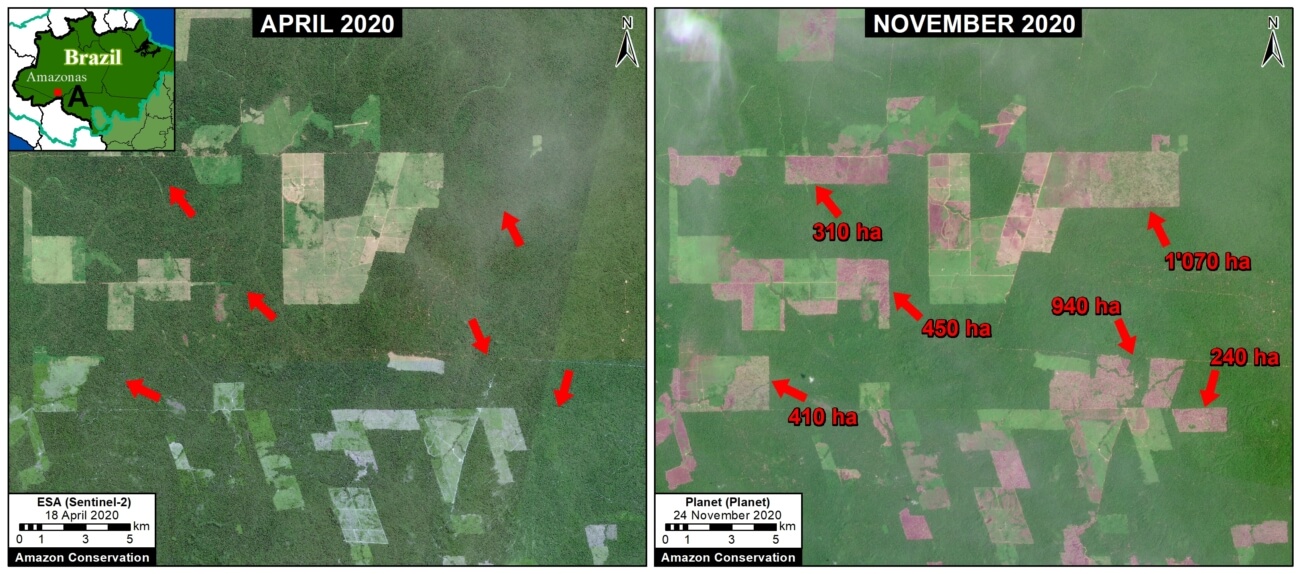
Zoom A. Deforestation in the Brazilian Amazon (Amazonas state) of 3,400 hectares between April (left panel) and November (right panel) 2020. Data: ESA, Planet.
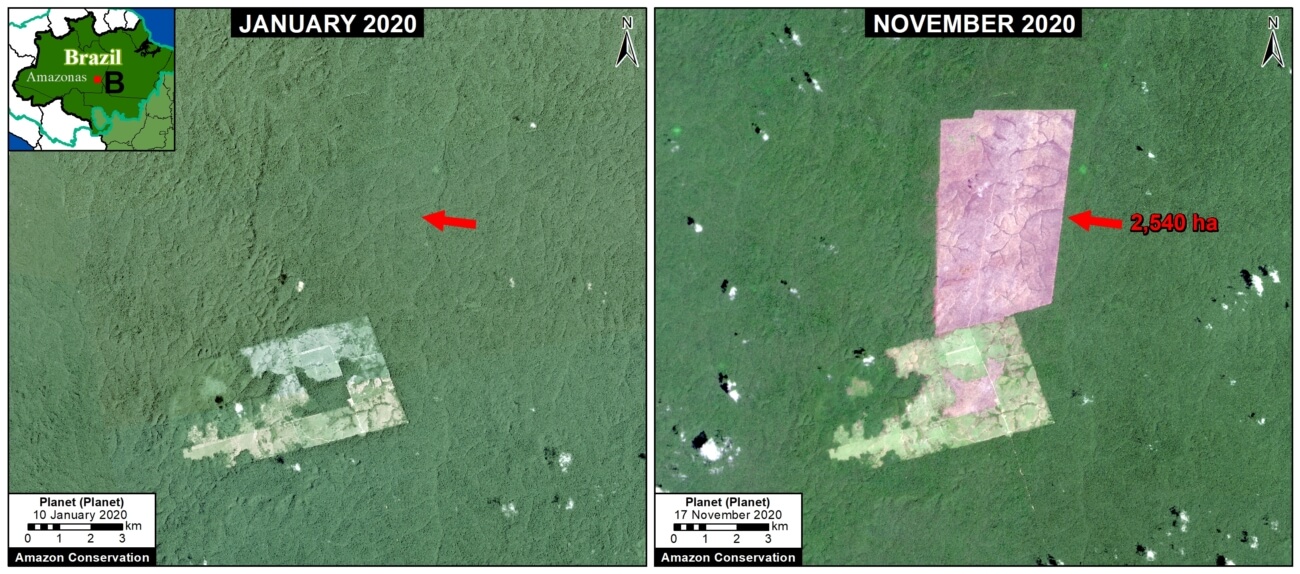
Zoom B. Deforestation in Brazilian Amazon (Amazonas state) of 2,540 hectares between January (left panel) and November (right panel) 2020. Data: Planet.
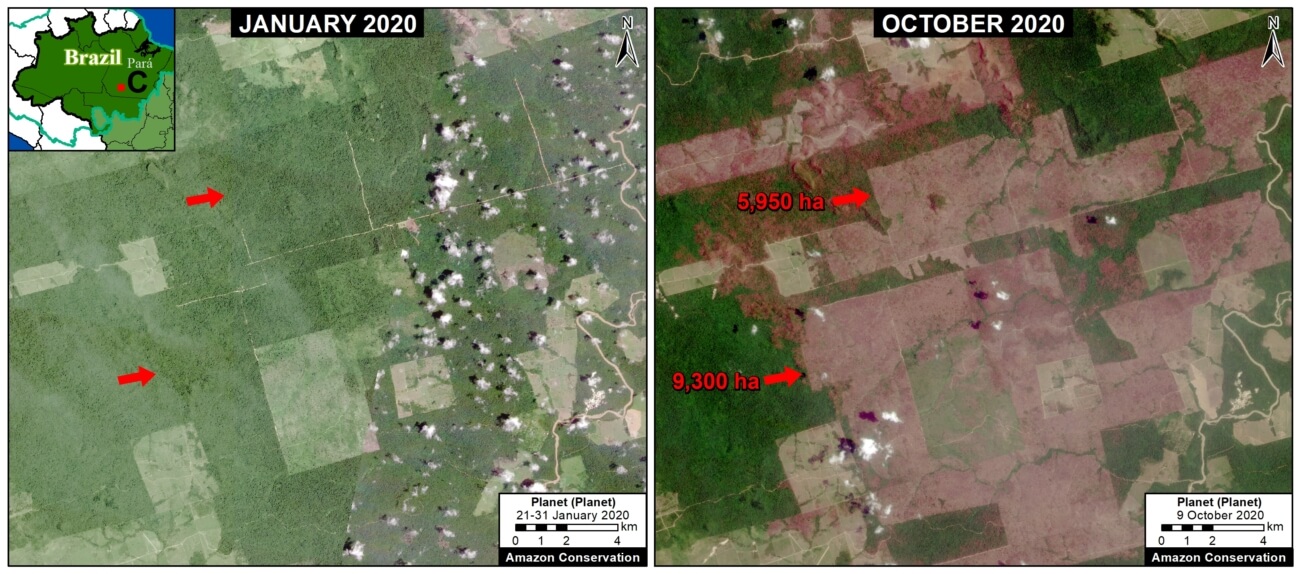
Zoom C. Deforestation in Brazilian Amazon (Para state) of 15,250 hectares between January (left panel) and October (right panel) 2020. Data: Planet.
Forest Fires in the Brazilian Amazon
In September, there was a shift to actual forest fires in the Brazilian Amazon (see MAAP #129). Zoom D and E show examples of these major forest fires, which burned over 50,000 hectares in the states of Pará and Mato Grosso. Note both fires impacted indigenous territories (Kayapo and Xingu, respectively).
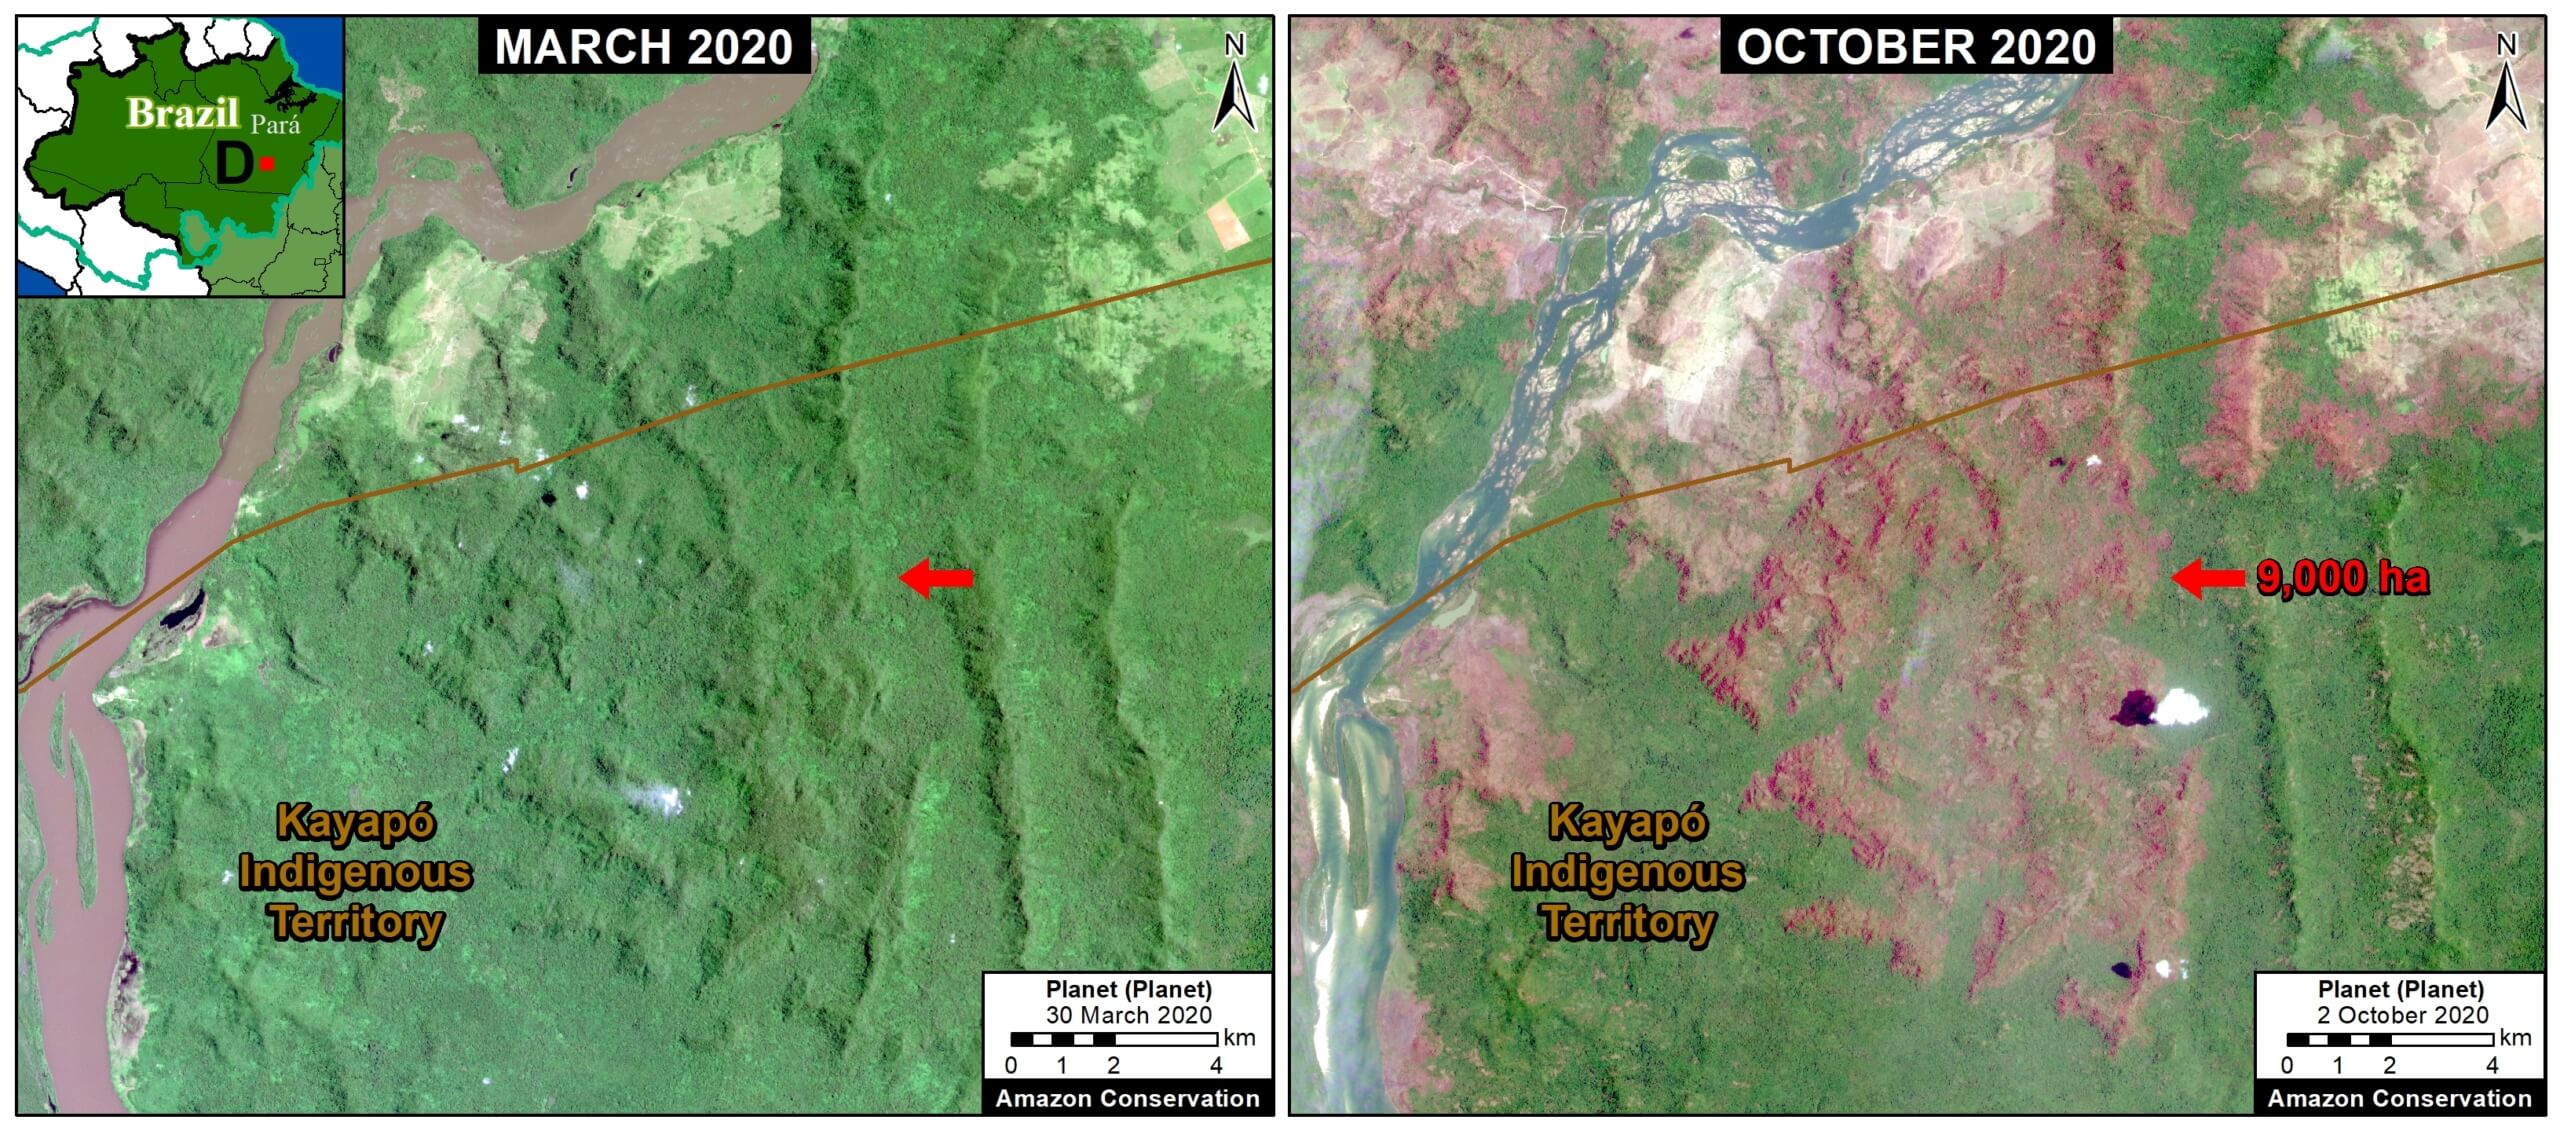
Zoom D. Forest fire in Brazilian Amazon (Para state) that burned 9,000 hectares between March (left panel) and October (right panel) 2020. Data: Planet.
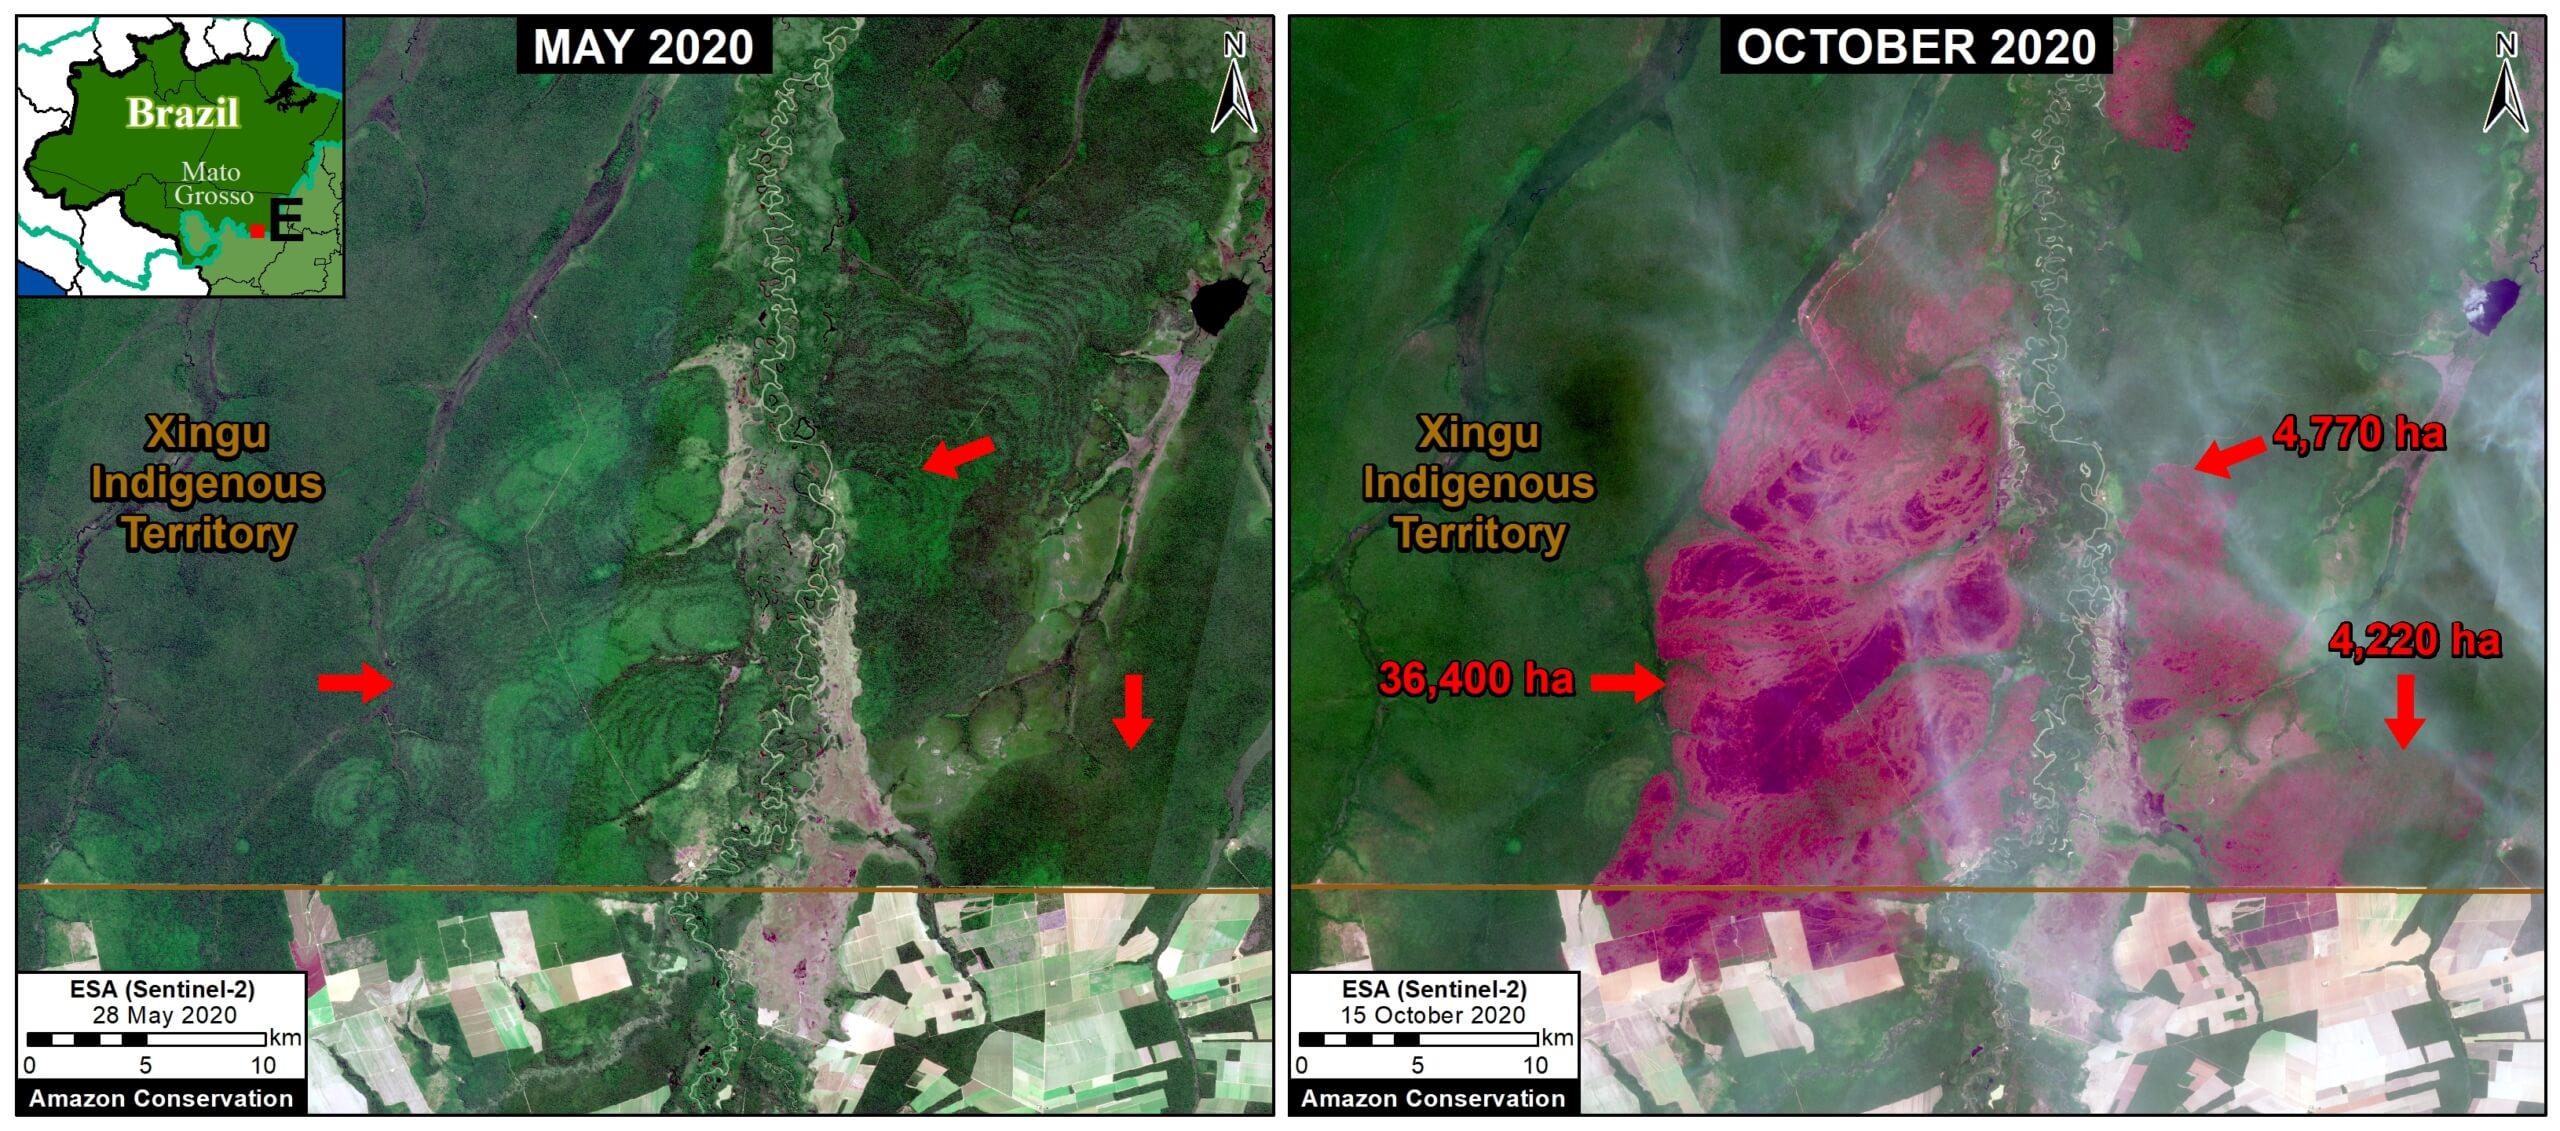
Zoom E. Forest fire in Brazilian Amazon (Mato Grosso state) that burned over 44,000 hectares between May (left panel) and October (right panel) 2020. Data: Planet.
Forest Fires in the Bolivian Amazon
The Bolivian Amazon also experienced another intense fire season in 2020. Zoom F shows the burning of a massive area (over 260,000 hectares) in the Chiquitano dry forests (Santa Cruz department).
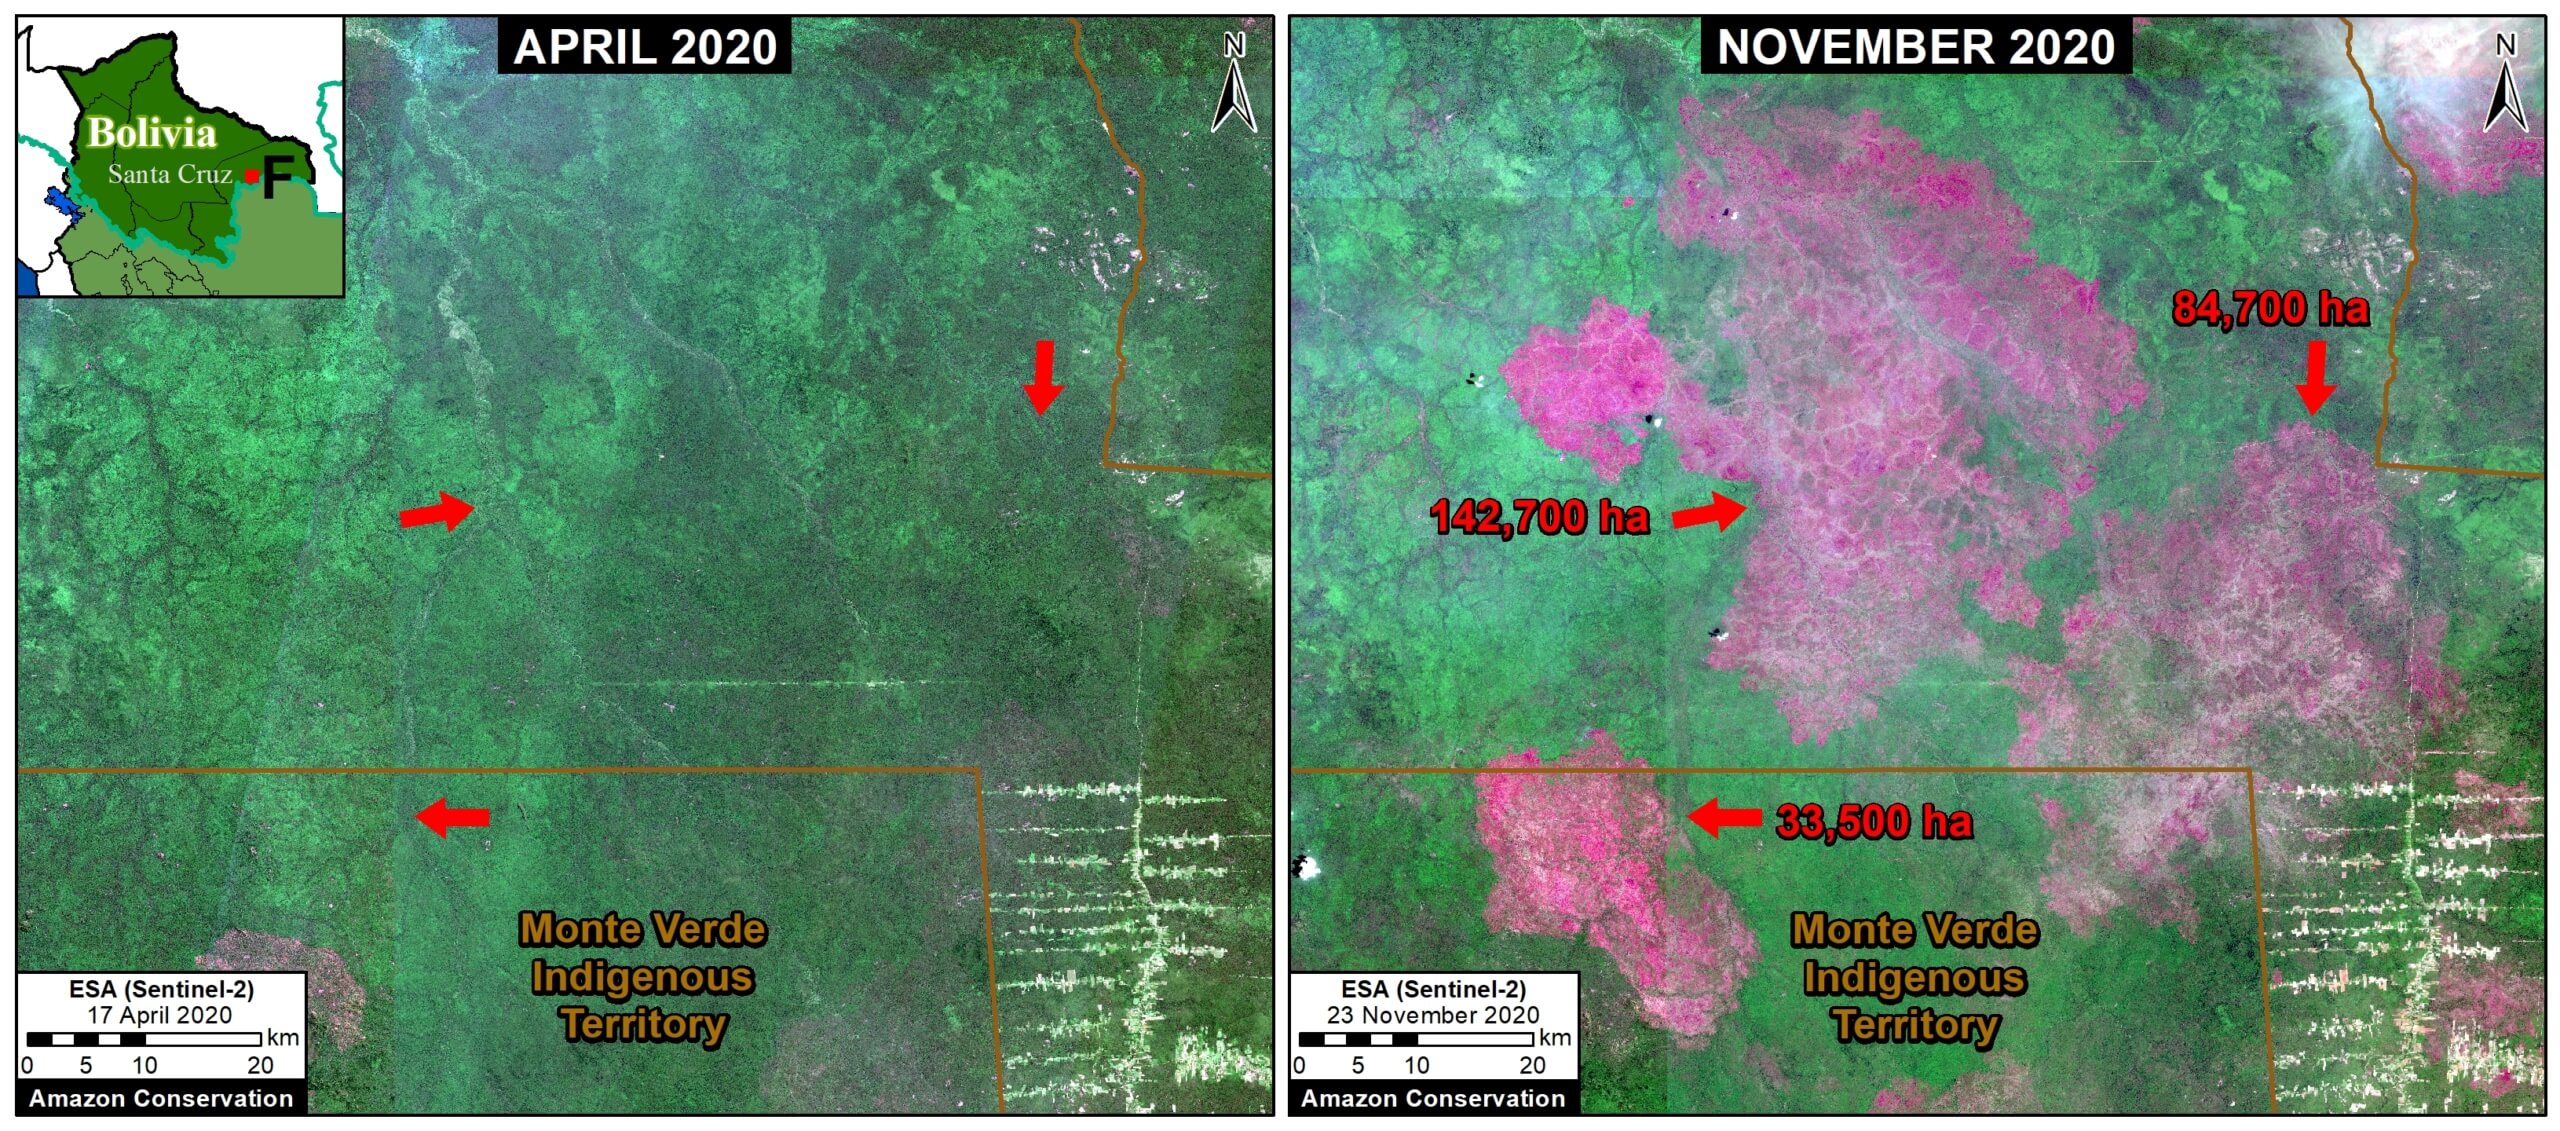
Zoom F. Forest fire in Bolivian Amazon (Santa Cruz) that burned over 260,000 hectares between April (left panel) and November (right panel) 2020. Data: ESA.
Arc of Deforestation in the Colombian Amazon
As described in previous reports (see MAAP #120), there is an “arc of deforestation” concentrated in the northwest Colombian Amazon. This arc impacts numerous protected areas (including national parks) and Indigenous Reserves. For example, Zoom G shows the recent deforestation of over 500 hectares in Chiribiquete National Park. Similar deforestation in that sector of the park appears to be conversion to cattle pasture.
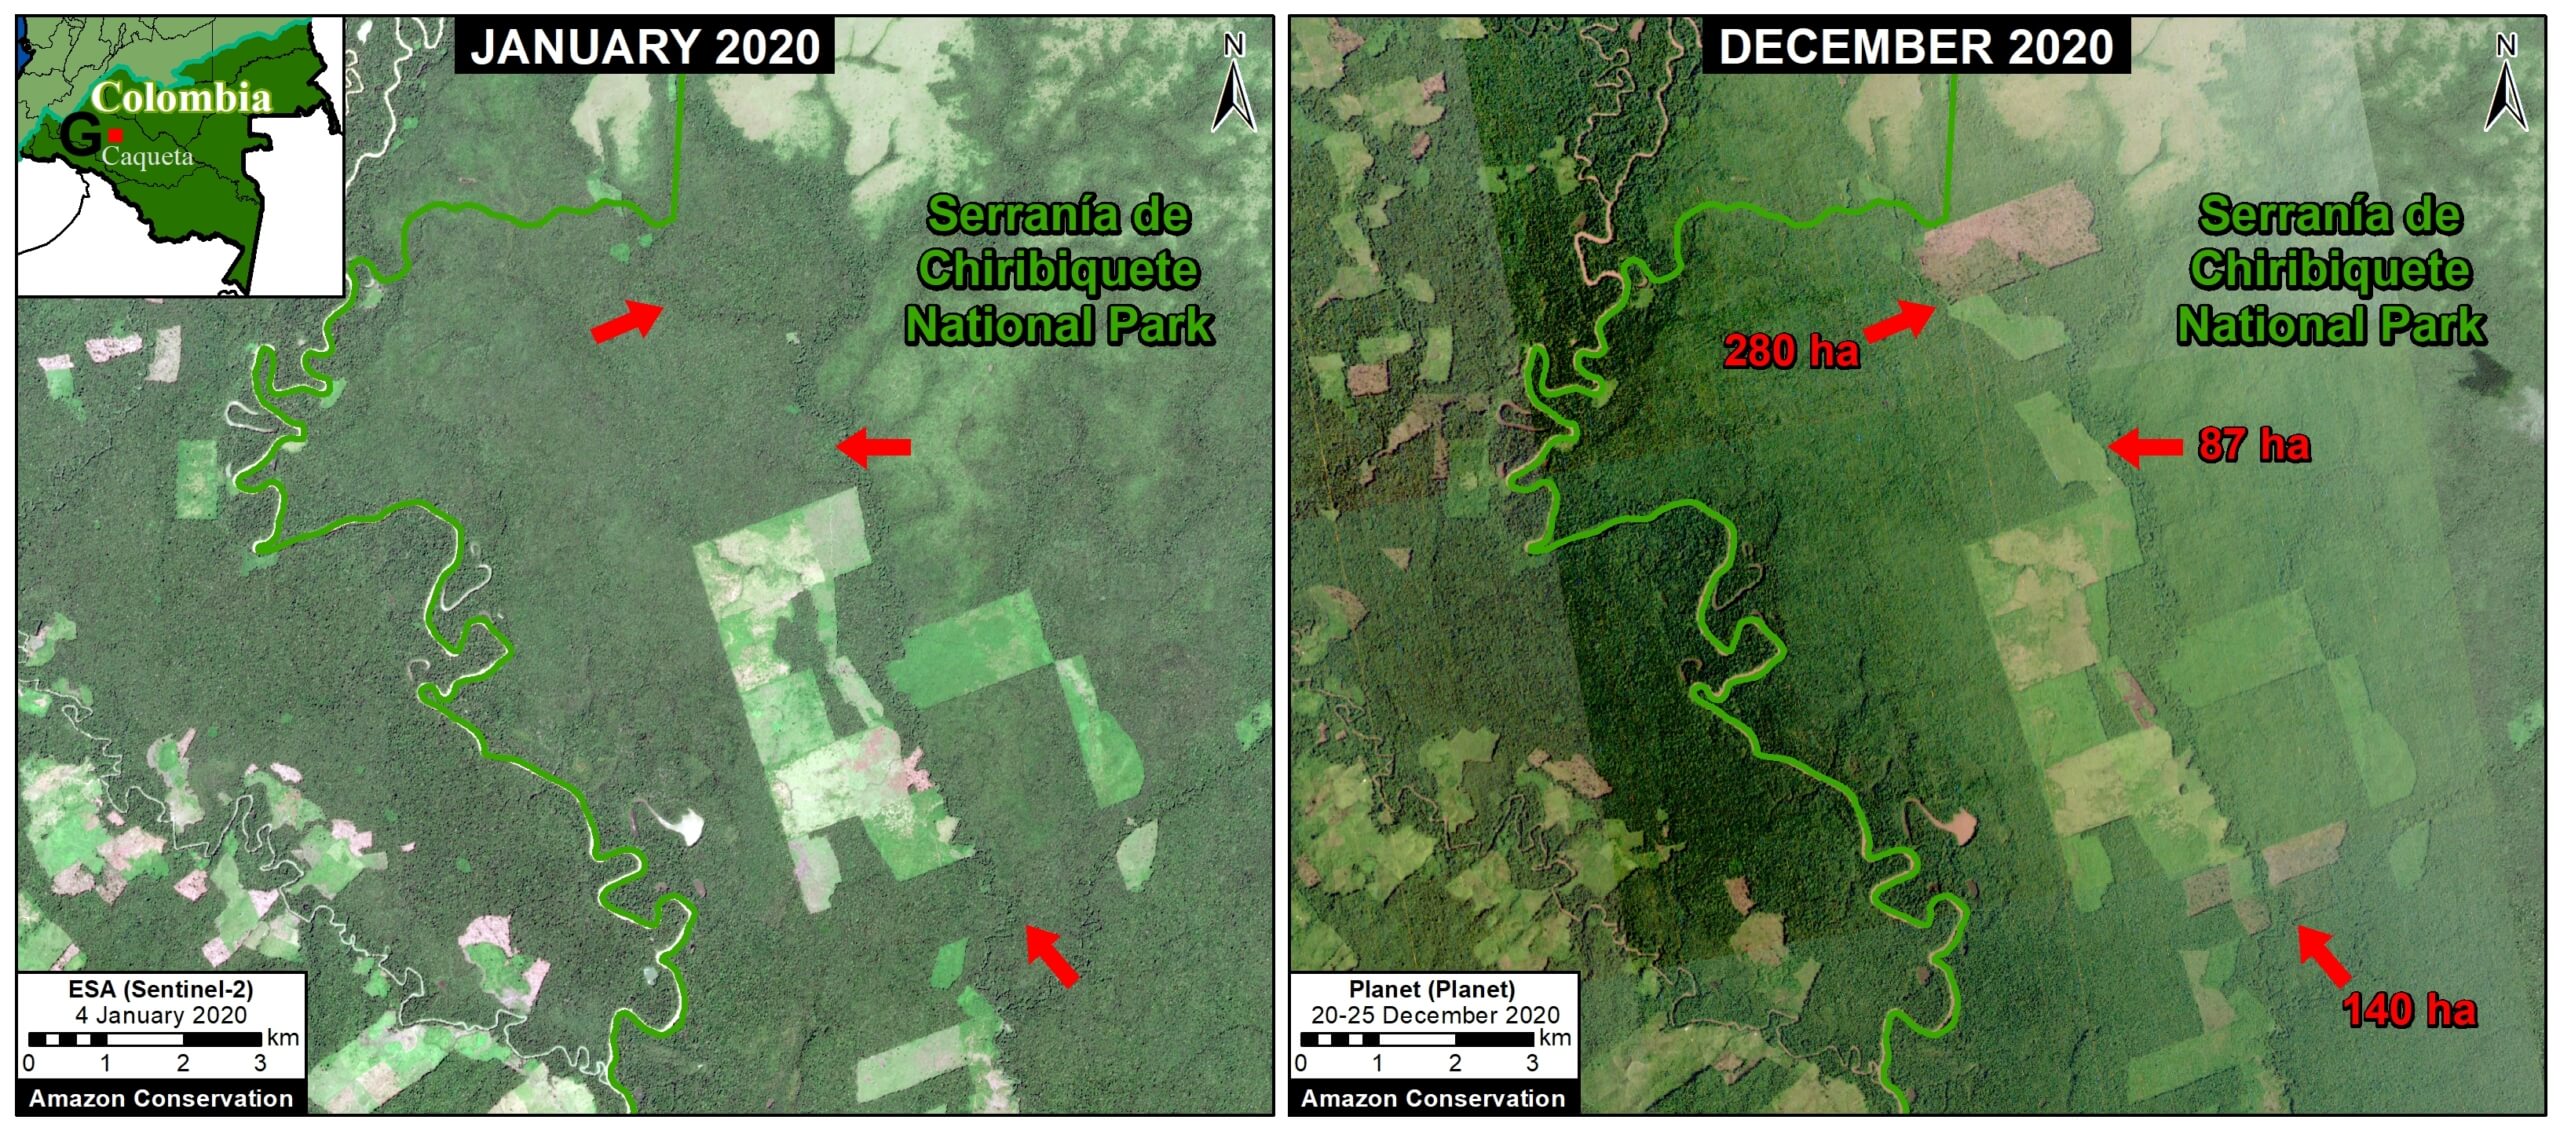
Zoom G. Deforestation in Colombian Amazon of over 500 hectares in Chiribiqete National Park between January (left panel) and December (right panel) 2020. Data: ESA, Planet.
Deforestation in the central Peruvian Amazon
Finally, Zoom H shows expanding deforestation (over 110 hectares), and logging road construction (3.6 km), in an indigenous territory south of Sierra del Divisor National Park in the central Peruvian Amazon (Ucayali region). The deforestation appears to be associated with an expanding small-scale agriculture or cattle pasture frontier.
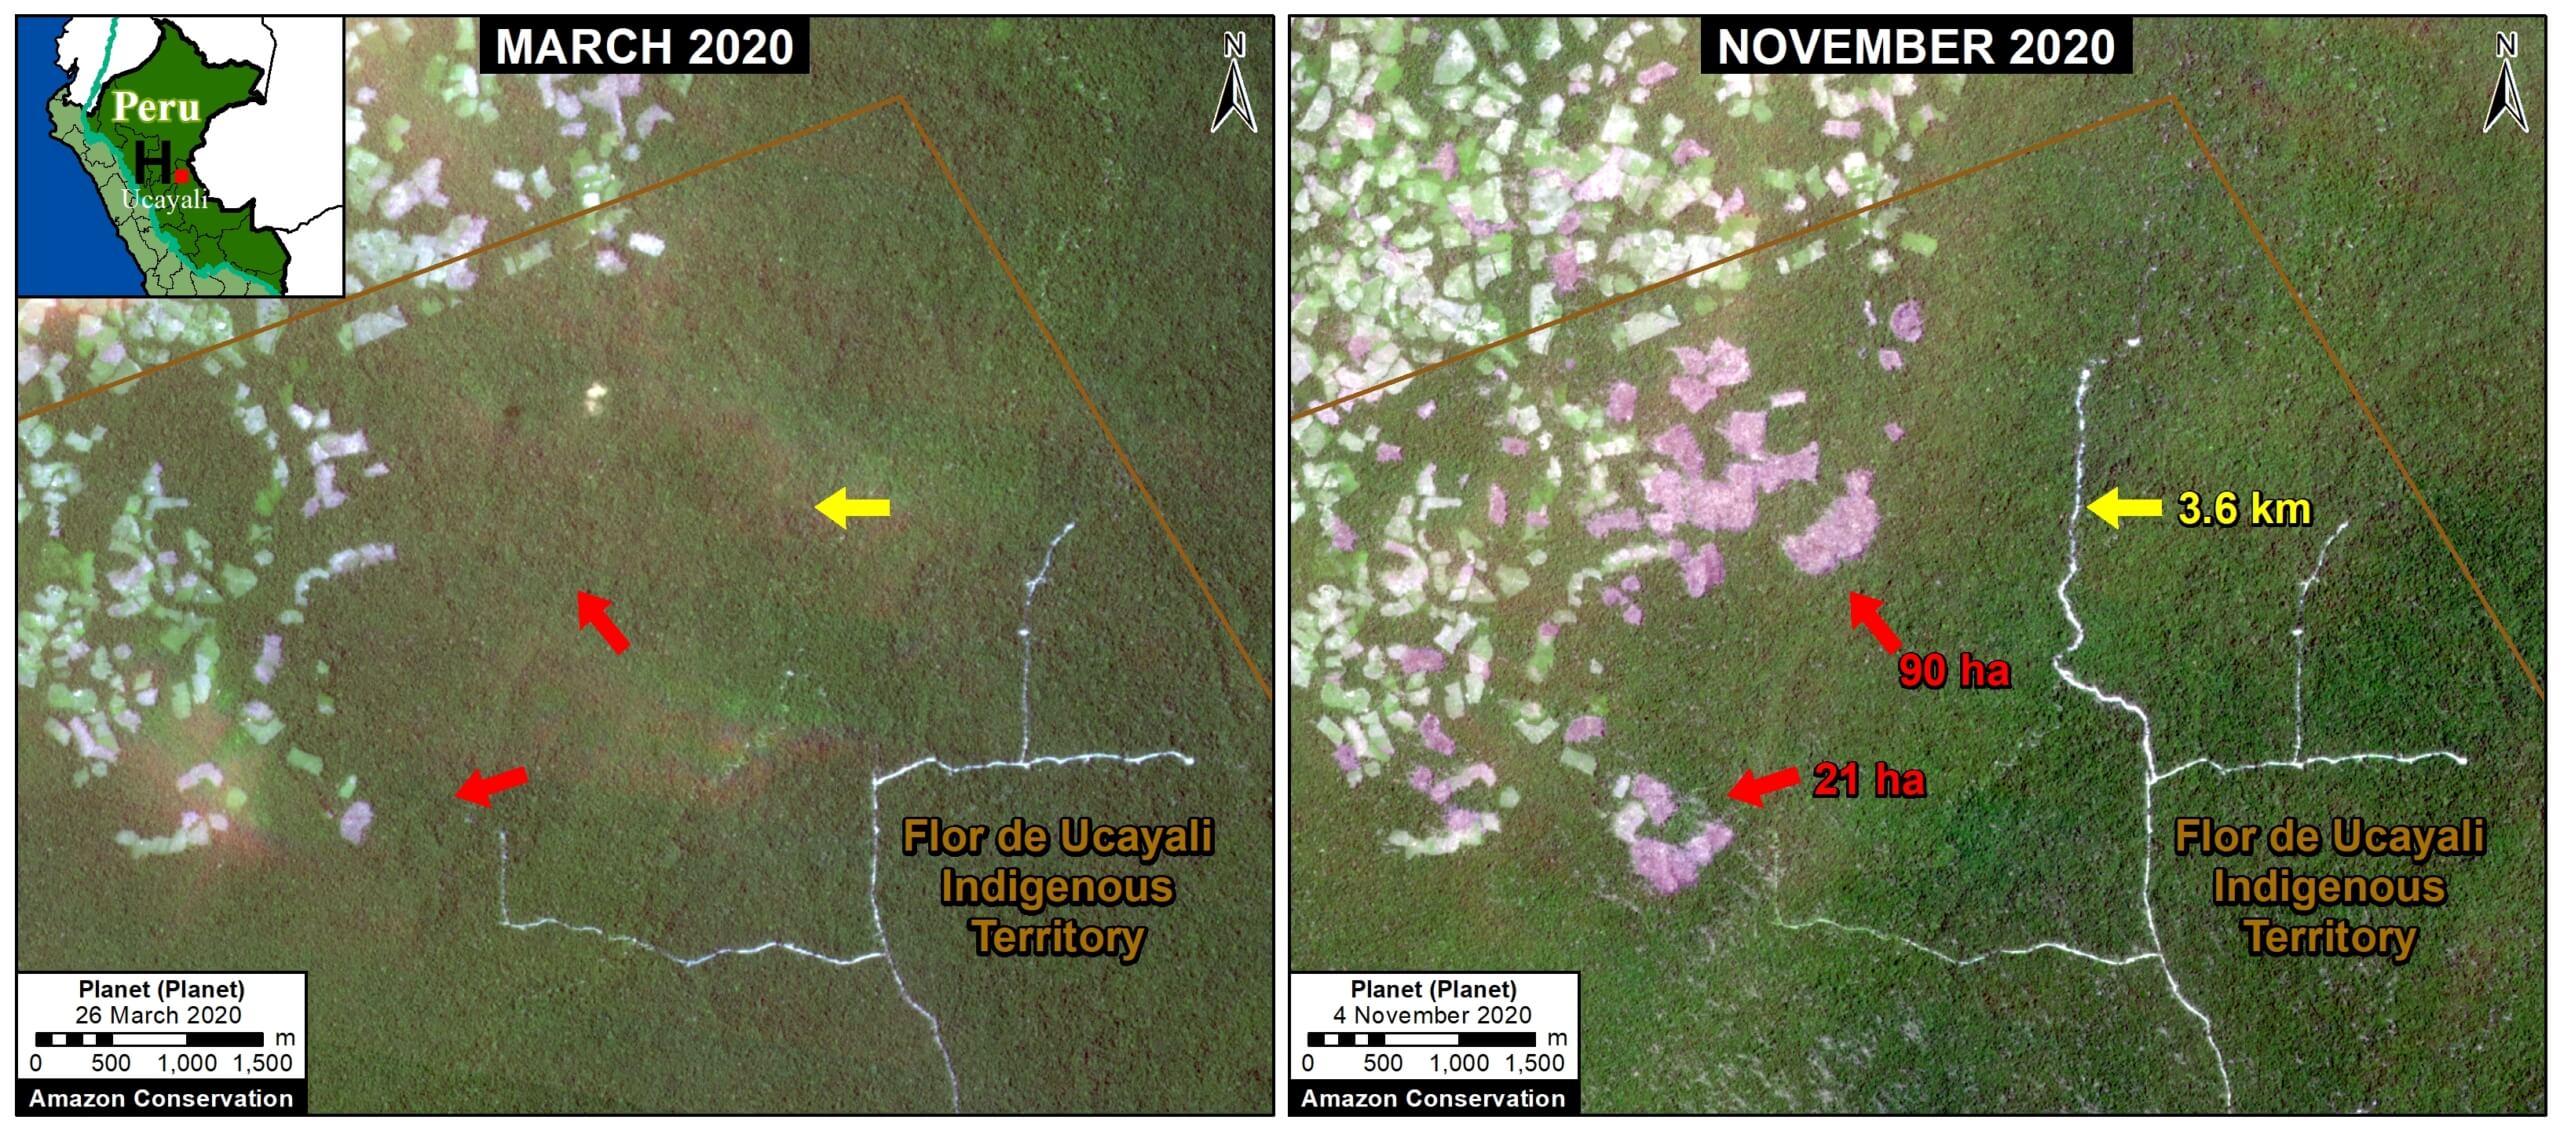
Zoom H. Deforestation and logging road construction in Peruvian Amazon (Ucayali region) between March (left panel) and November (right panel) 2020. Data: Planet.
*Notes and Methodology
The analysis was based on early warning forest loss alerts known as GLAD alerts (30-meter resolution) produced by the University of Maryland and also presented by Global Forest Watch. It is critical to highlight that this data represents a preliminary estimate and more definitive data will come later in the year. For example, our estimate does include some forest loss caused by natural forces. Note that this data detects and classifies burned areas as forest loss. Our estimate includes both confirmed (1,355,671 million hectares) and unconfirmed (751,533 ha) alerts.
Our geographic range is the biogeographic boundary of the Amazon as defined by RAISG (see Base Map above). This range includes nine countries.
We applied a filter to calculate only primary forest loss. For our estimate of primary forest loss, we intersected the forest cover loss data with the additional dataset “primary humid tropical forests” as of 2001 (Turubanova et al 2018). For more details on this part of the methodology, see the Technical Blog from Global Forest Watch (Goldman and Weisse 2019).
To identify the deforestation hotspots, we conducted a kernel density estimate. This type of analysis calculates the magnitude per unit area of a particular phenomenon, in this case forest cover loss. We conducted this analysis using the Kernel Density tool from Spatial Analyst Tool Box of ArcGIS. We used the following parameters:
Search Radius: 15000 layer units (meters)
Kernel Density Function: Quartic kernel function
Cell Size in the map: 200 x 200 meters (4 hectares)
Everything else was left to the default setting.
For the Base Map, we used the following concentration percentages: Medium: 7-10%; High: 11-20%; Very High: >20%.
Acknowledgements
We thank E. Ortiz (AAF), M.E. Gutierrez (ACCA), and S. Novoa for their helpful comments on this report.
Citation
Finer M, Mamani N (2020) Amazon Deforestation Hotspots 2020. MAAP: 132.

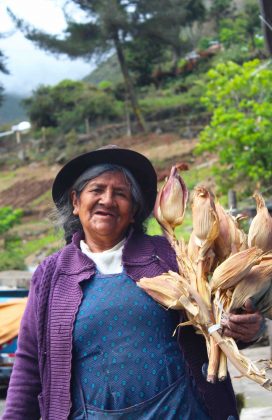 Marcapata Ccollana, an indigenous community of Quechua origin in Cuzco, Peru has just been established as an agrobiodiversity zone with the help of our sister organization, Conservación Amazónica – ACCA. More than 55,800 acres of vast agricultural genetic diversity and ancestral lands are officially protected, which preserves various types of endemic Andean root vegetables.
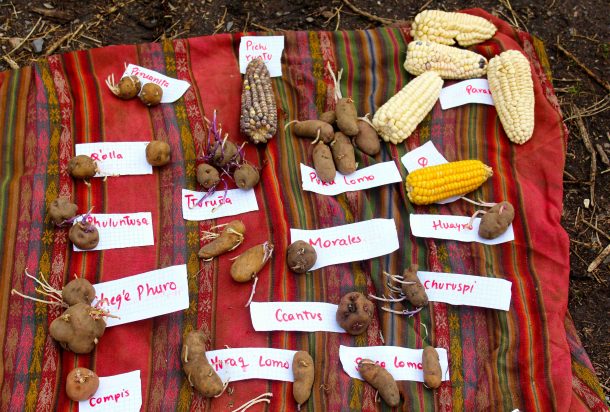 Conservación Amazónica – ACCA, the Peruvian National Protected Areas Service (SERNANP), the United Nations Development Program (UNDP), and the Regional Government of Cusco.
 Loading...