The Amazon lowlands have been connected to the Andes Mountains for millions of years by only six major rivers: the Caqueta, Madeira, Maranon, Napo, Putumayo, and Ucayali* (see Image 34a). This intimate connection allows rich Andean nutrients to fuel the Amazon floodplain and enables long-distance catfish migration between feeding grounds in the lowlands and spawning grounds in the highlands.

Image 34a. Data: Esri, DigitalGlobe, GeoEye, Earthstar Geographics, CNES/Airbus DS, USDA, AEX, Getmapping, Aerogrid, IGN, IGP, swisstopo
However, one of these six major Andean tributaries has recently been dammed on its main channel: the Madeira River in western Brazil (See Inset A). The Santo Antônio dam was completed in 2011, followed by the upstream Jirau dam in 2013.
Note in Image 34a that these dams are are located downstream of the Madre de Dios River in southern Peru. Thus, major ecological impacts — such as blocking the route of migratory catfish**— are also very relevant to Peru.
Here in MAAP #34, we describe the forest loss—over 36,100 hectares—associated with the flooding caused by these two dams (with a focus on the Jirau dam).
Zoom A: Forest Loss due to Flooding
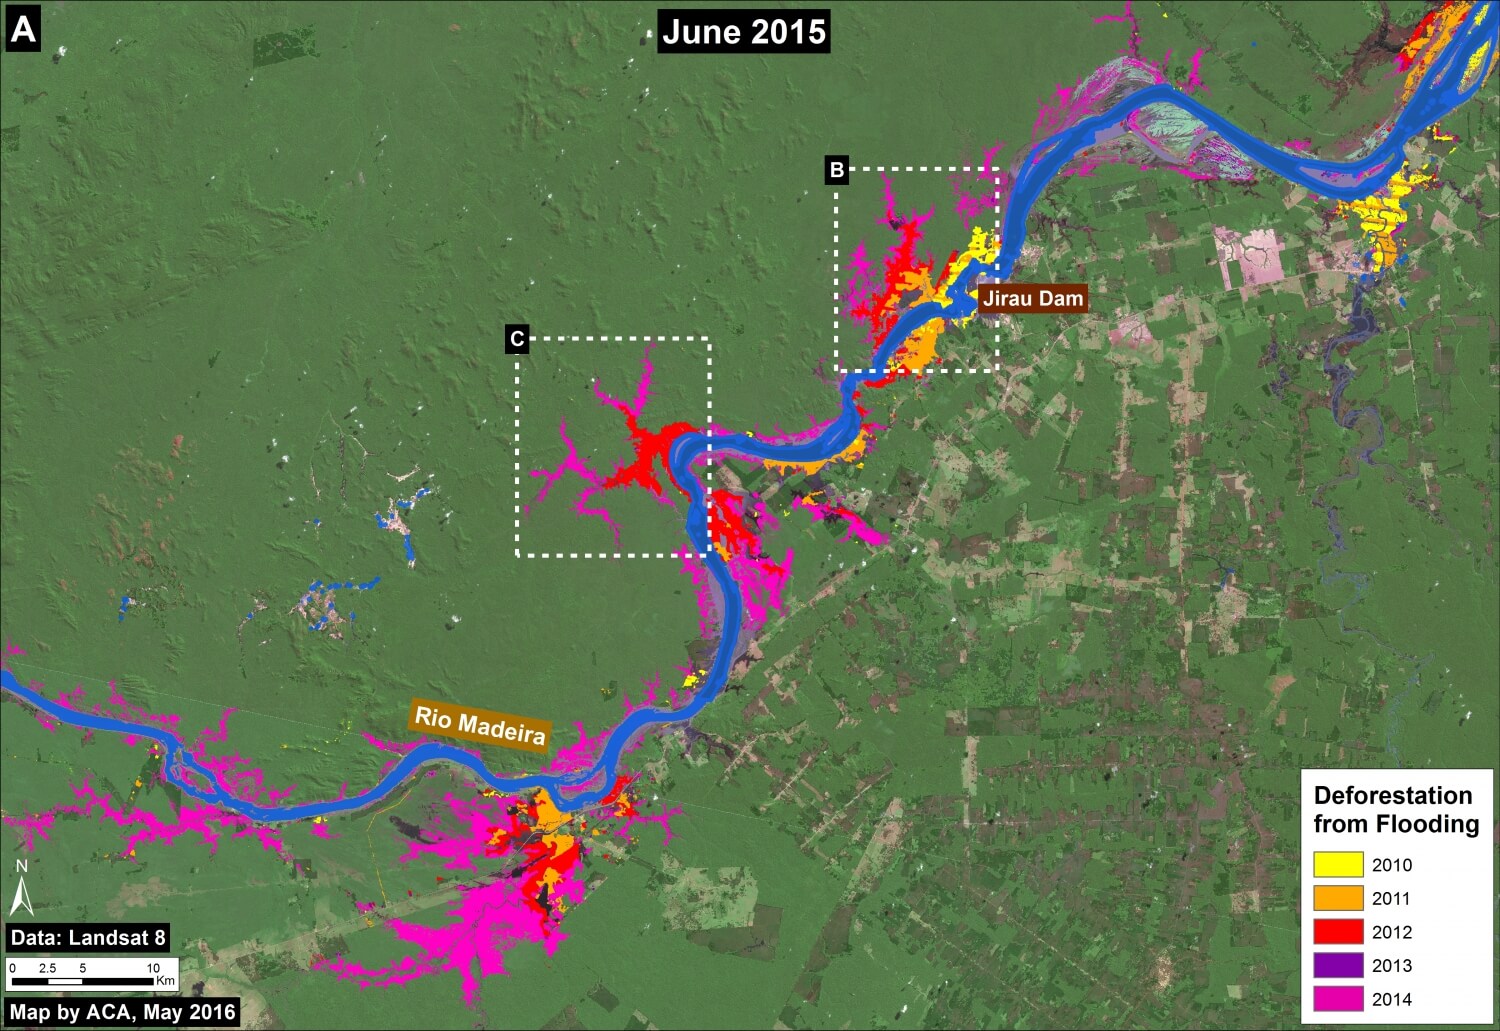
Image 34b shows the forest loss due to flooding immediately upstream of the Jirau dam. As of 2015, the total flooded area for both dams is 36,139 hectares (89,301 acres). Major flooding was first detected in 2010, rose substantially in 2011-12, and peaked in 2014.
According to Fearnside 2014, although much of the forest along the Madeira is seasonally flooded, it dies when permanently flooded.*** Therefore, the flooded area is an appropriate measure of forest loss.
Further below, we show a series of satellite images of the areas indicated by Inset B (see Images 34c-e) and Inset C (see Image 34f).

Image 34b. Flooding-related forest loss along the Upper Madeira River. Data: USGS, CLASlite, Hansen/UMD/Google/USGS/NASA.
Zoom B: Flooding Immediately Upstream Jirau Dam
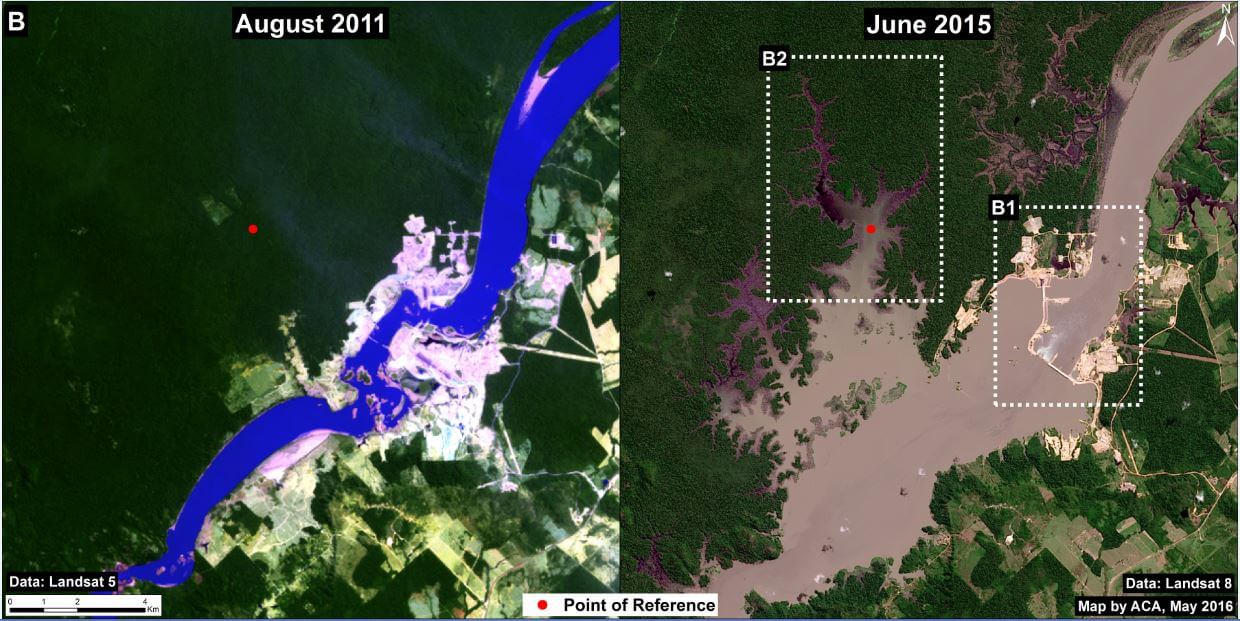
Image 34c shows the flooding immediately upstream of the Jirau dam between 2011 (left panel) and 2015 (right panel). The red dot is a point of reference that indicates the same place in both images. Below, we show high-resolution images of the areas indicated by Insets B1 and B2.

Image 34c shows the flooding immediately upstream of the Jirau dam between 2011(left panel) and 2015 (right panel).
Zooms B1 and B2: Jirau Dam and Flooding
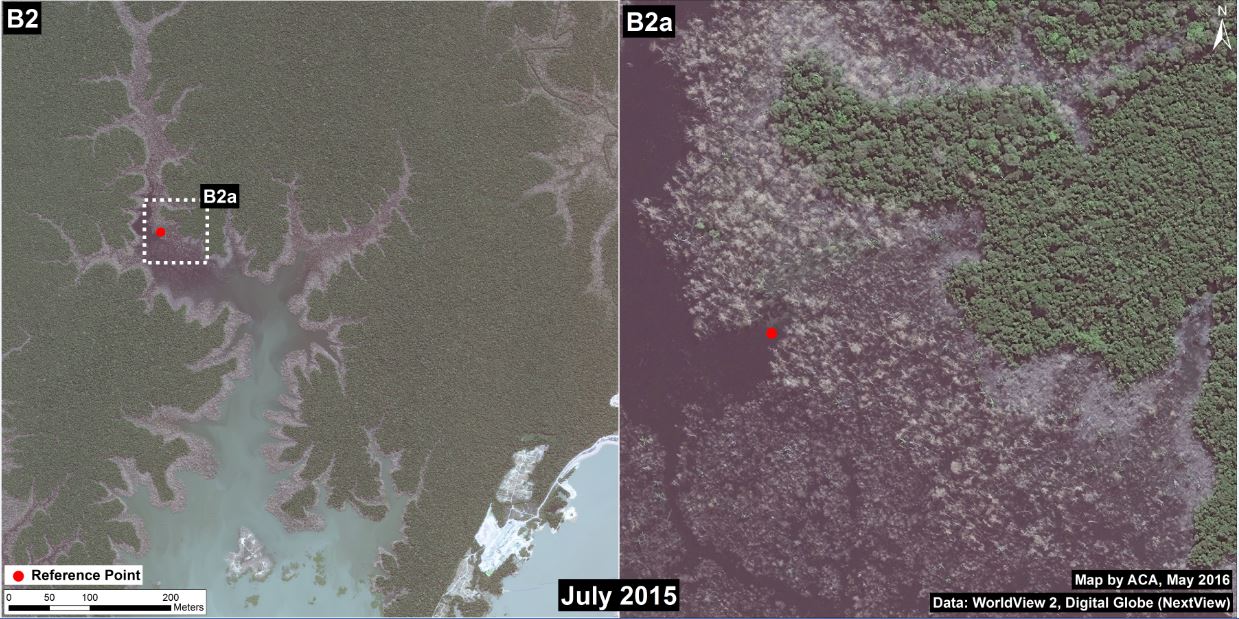
Image 34d shows a high-resolution view of the Jirau dam in July 2015. Image 34e shows a high-resolution view of a portion of the flooded area immediately upstream of the Jirau dam in August 2015. The red dot is a point of reference that indicates the same place in both panels.
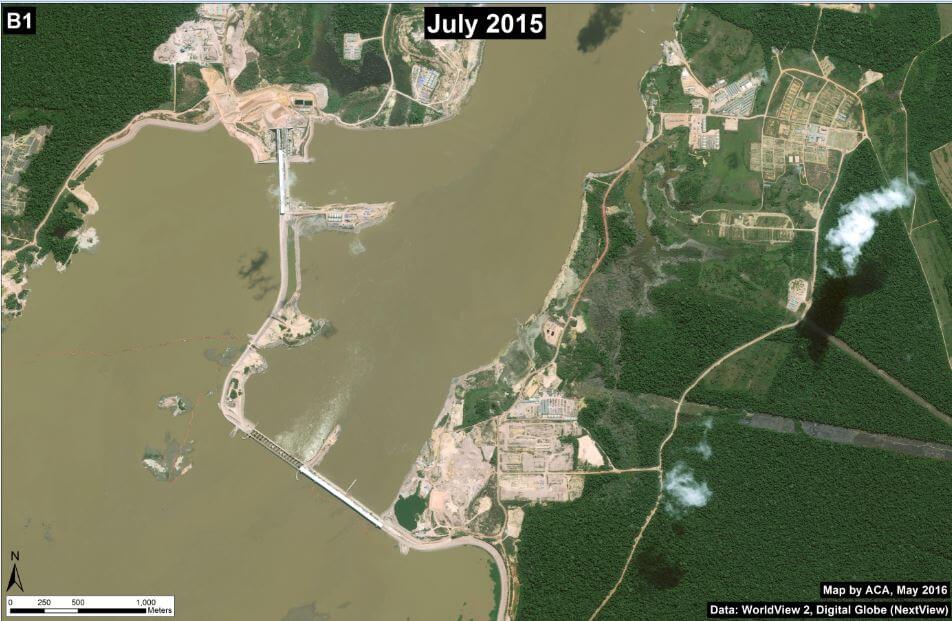
Image 34d. High-resolution view of the Jirau dam. Data: WorldView-2 from Digital Globe (NextView).
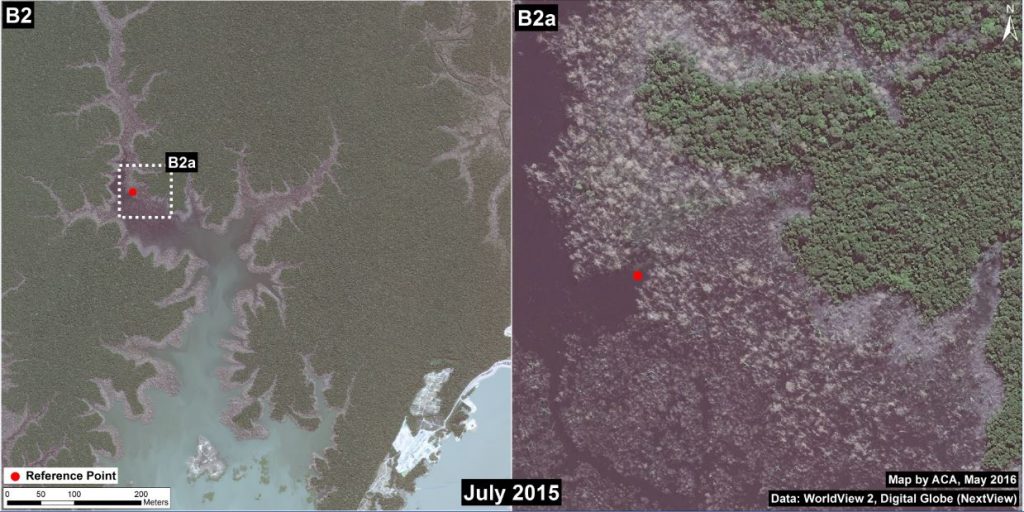
Image 34e: High-resolution view of flooded area immediately upstream of the Jirau dam. Data: WorldView-2 from Digital Globe (NextView).
Zoom C: Flooding Further Upstream of Jirau Dam
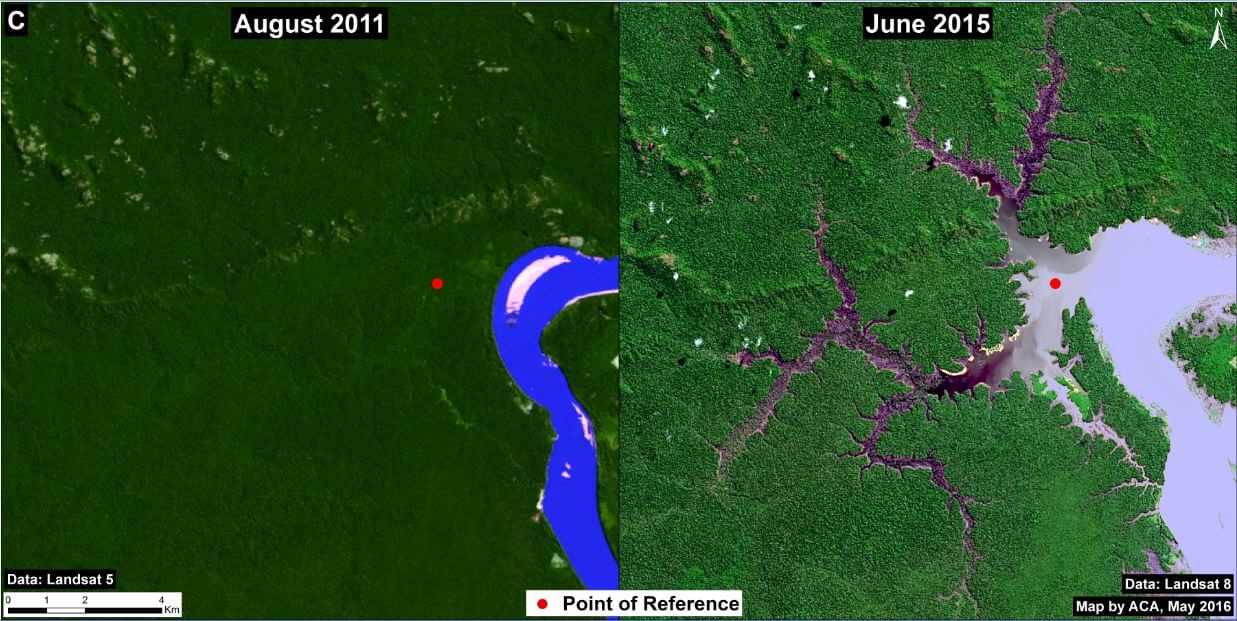
Image 34f shows the flooding further upstream of the Jirau dam between 2011 (left panel) and 2015 (right panel). The red dot is a point of reference that indicates the same point in both images.

Image 34e: High-resolution view of flooded area immediately upstream of the Jirau dam. Data: WorldView-2 from Digital Globe (NextView).
References
*Finer M, Jenkins CN (2012) Proliferation of Hydroelectric Dams in the Andean Amazon and Implications for Andes-Amazon Connectivity. PLOS ONE: 7(4): e35126. Link: http://journals.plos.org/plosone/article?id=10.1371/journal.pone.0035126
**Duponchelle F et al (2016) Trans-Amazonian natal homing in giant catfish. J. Appl. Ecol. http://doi.org/bd45
***Fearnside PM (2014) Impacts of Brazil’s Madeira River dams: Unlearned lessons for hydroelectric development in Amazonia. Environmental Science & Policy 38: 164-172.
Citation
Finer M, Olexy T (2015) New Dams on the Madeira River (Brazil) Cause Forest Flooding. MAAP: 34.

 For two decades now, Alessandro Catenazzi, Ph.D., an assistant professor of zoology at Southern Illinois University, Carbondale, has been using the ACA biological stations in the Peruvian rainforest to learn more about the frog population in the region.
 “Now the creeks are dead zones.”
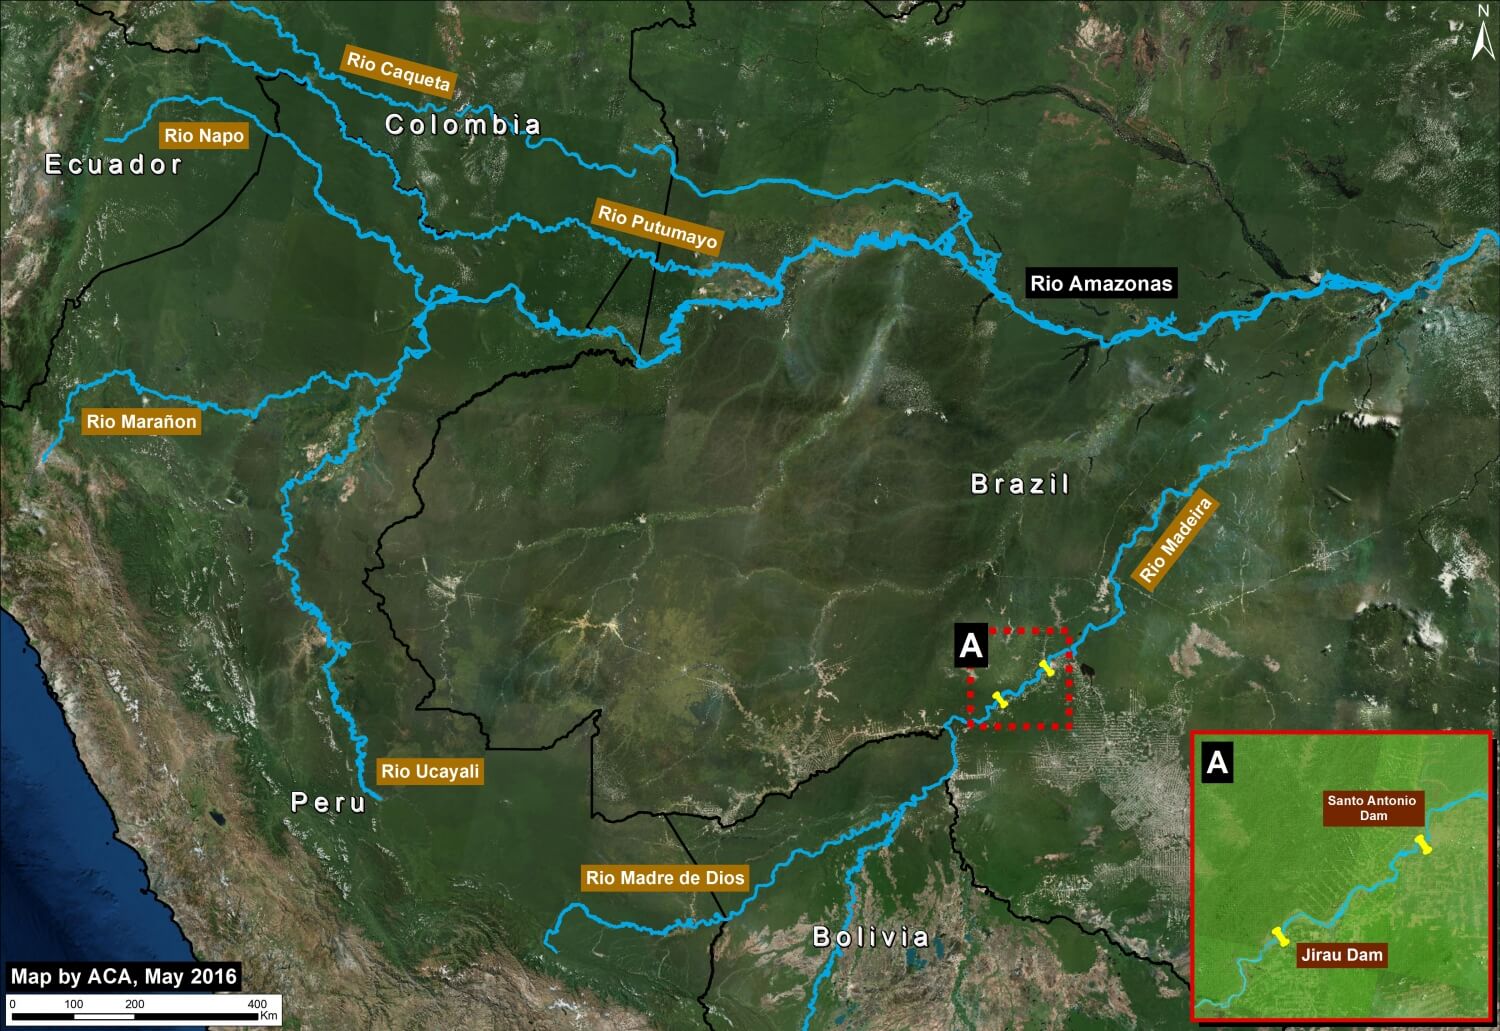
 Loading...