MAAP #42: Papaya – New Deforestation Driver in Peruvian Amazon

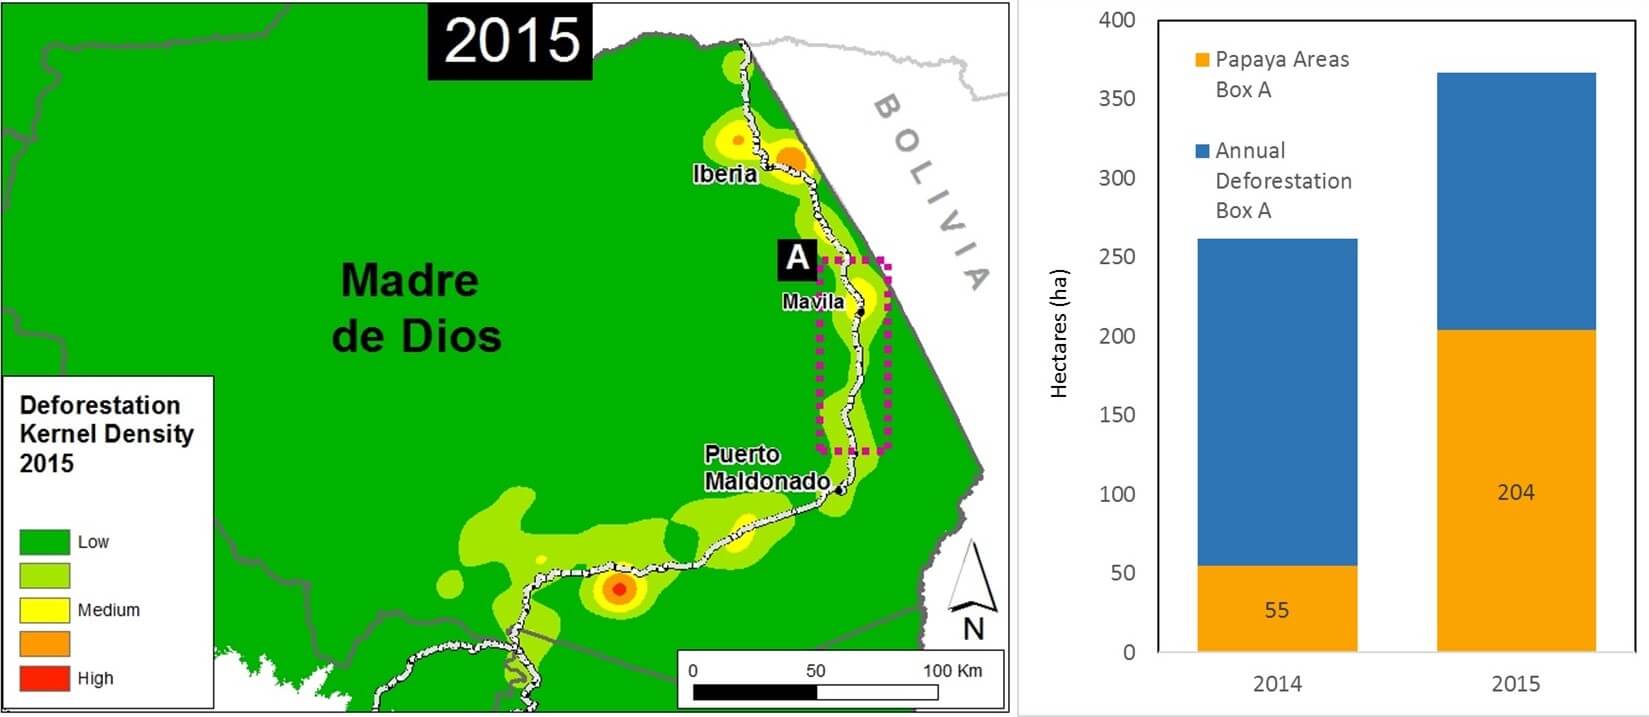
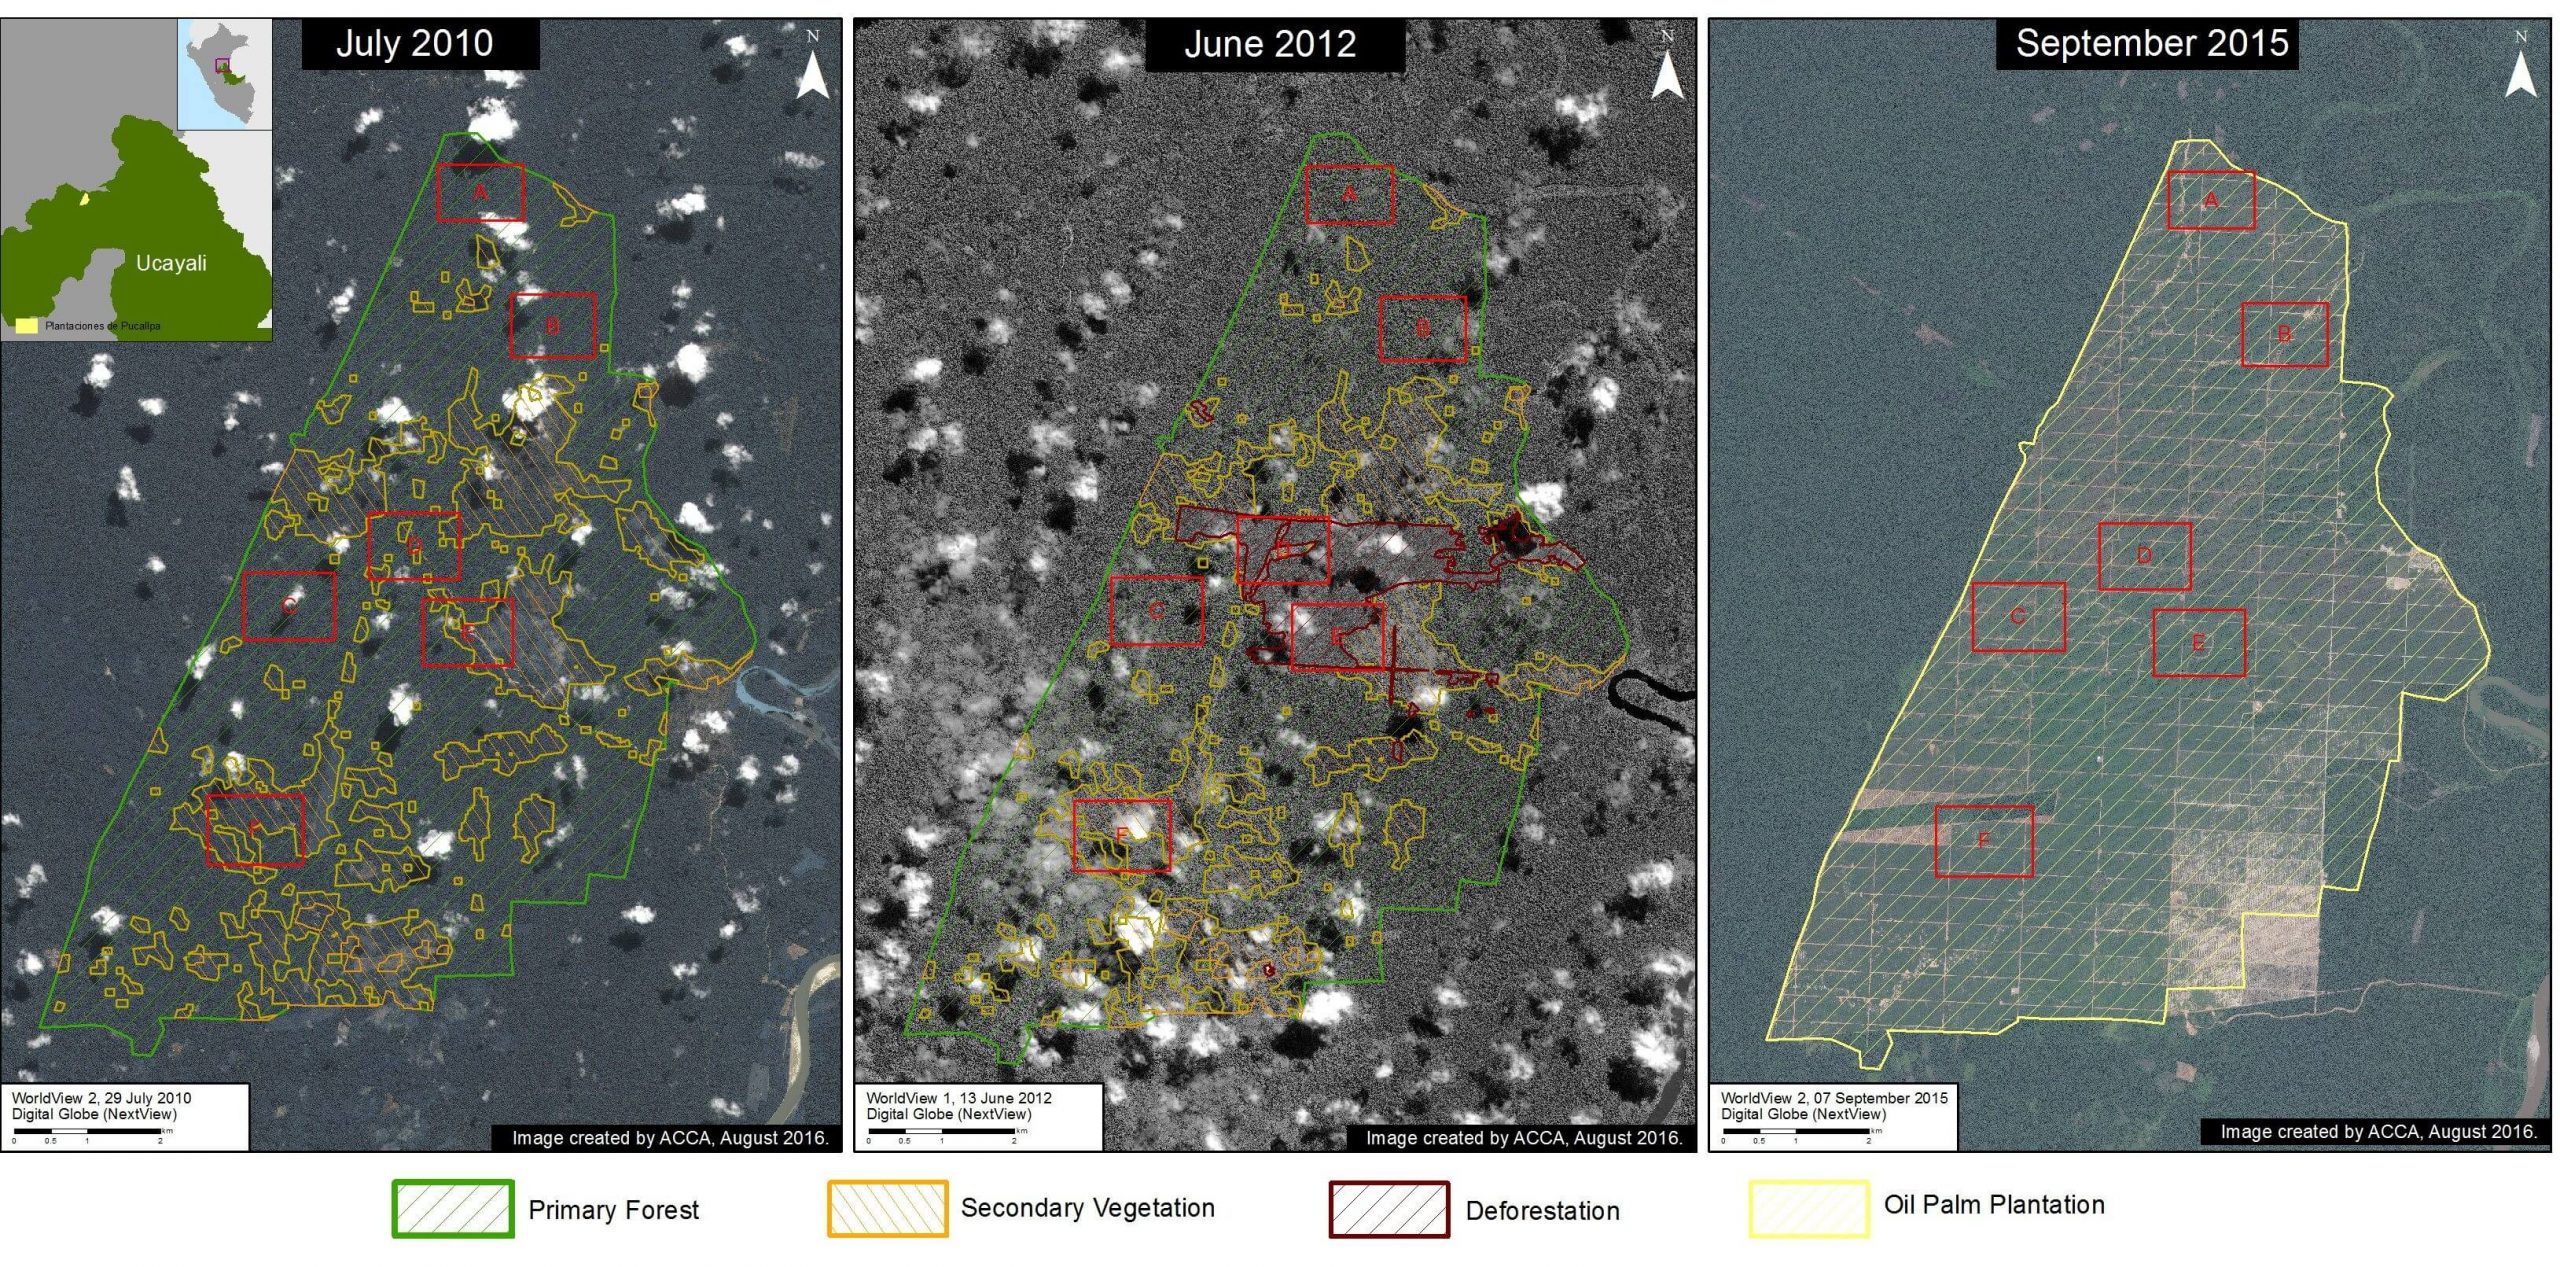
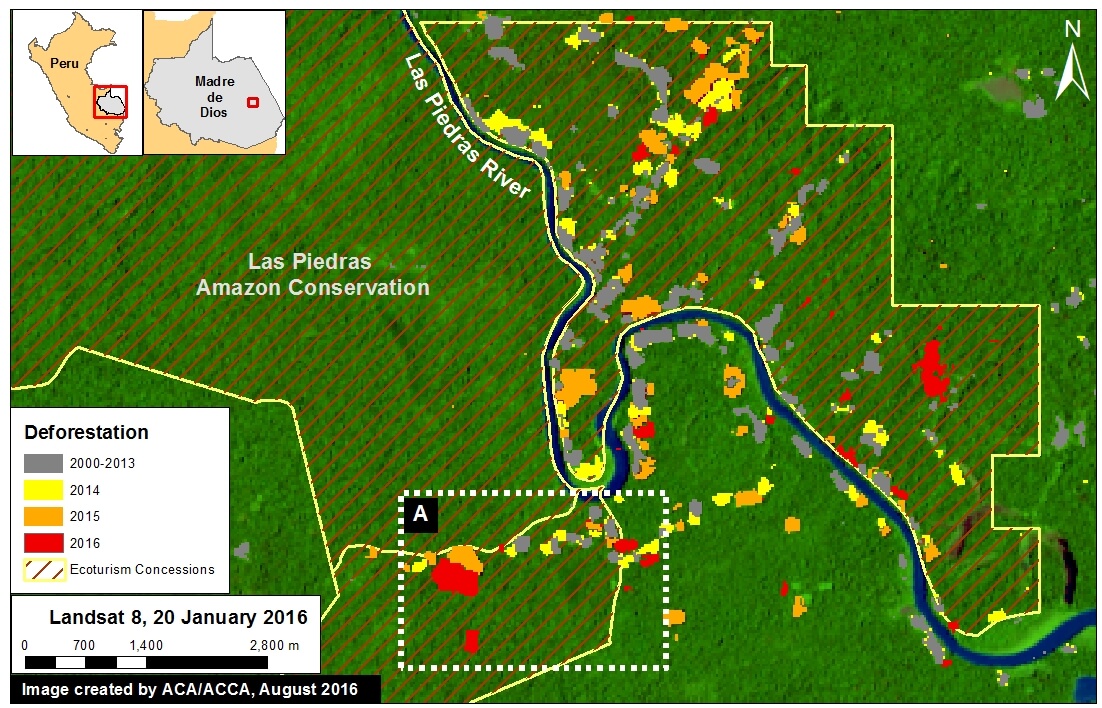
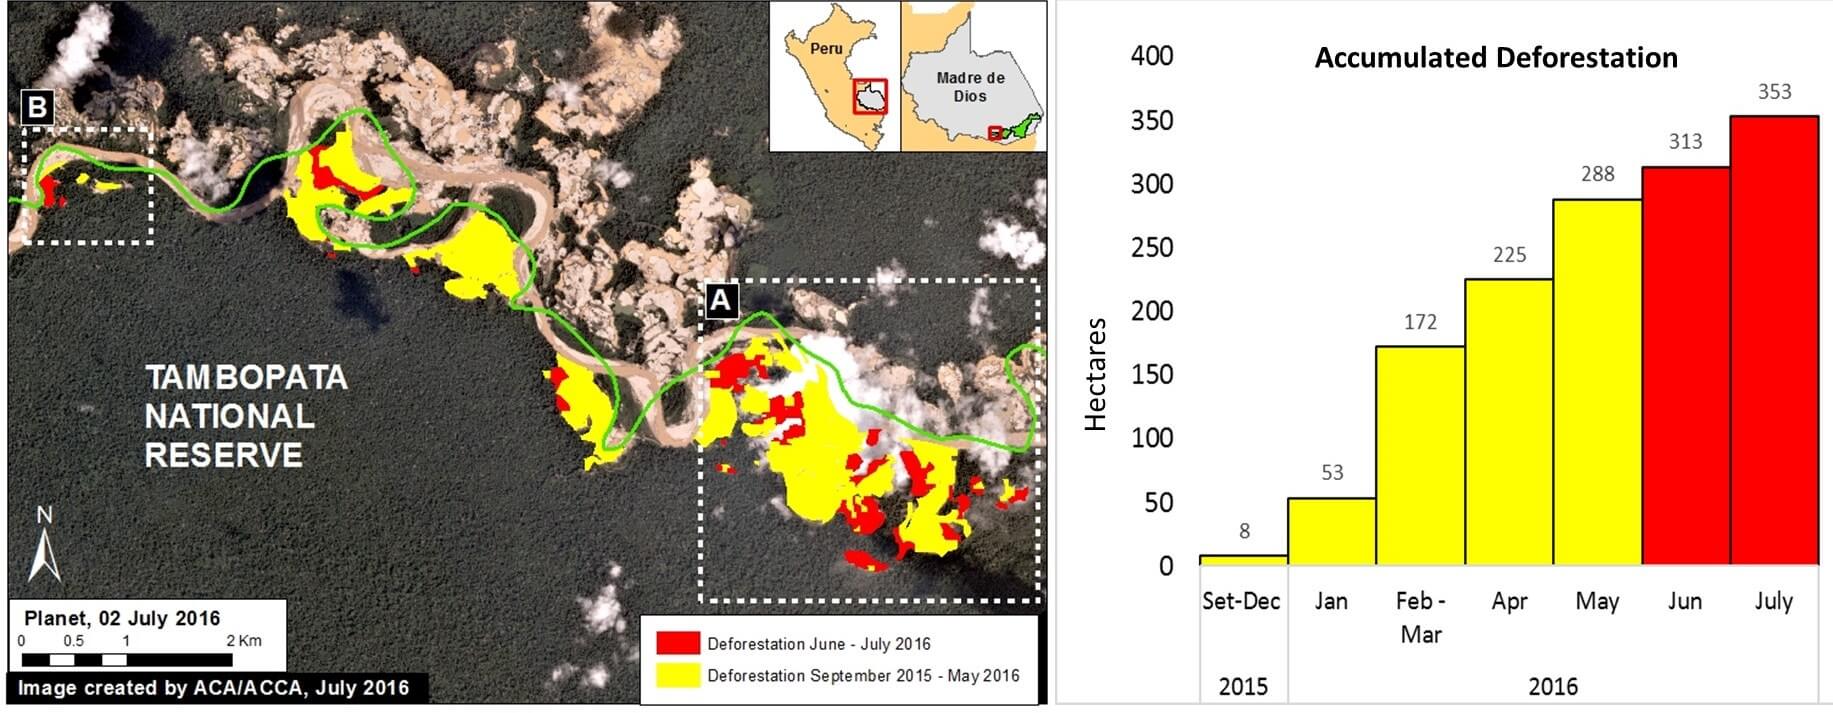
In the previous MAAP #26, we published a preliminary map of Deforestation Hotspots in the Peruvian Amazon for 2015. Subsequently in 2016, we have been compiling information to improve understanding on the potential causes (drivers) of deforestation in the identified hotspots. In this article, we focus on a medium-intensity hotspot located along the newly paved Interoceanic Highway in the eastern part of the Madre de Dios region (see Inset A in Image 42a).


Image 42a. Data. UMD/GLAD, MTC, MAAP

The analysis in this article is based on field work carried out by the Peruvian Ministry of Environment, in collaboration with Terra-i. This team has verified the presence of papaya plantations in the area indicated by Inset A and shared their photos and coordinates with MAAP to allow us to search for and analyze relevant satellite imagery.

Synthesizing all of the available information, we found that the establishment of papaya plantations was an important deforestation driver in the area in 2015. Within the focal area (Inset A), we estimate the deforestation of 204 hectares (504 acres) for papaya plantations in 2015, a major increase relative to 2014 (see bar graph in Image 42a).

All of the papaya deforestation is small (< 5 hectares) or medium (5-50 hectares) scale. According to the analysis presented in MAAP #32, these two scales represented 99% of the deforestation events in Peru in 2015. Approximately 90% of the observed deforestation is within areas zoned for agricultural activity. Therefore, the legality of the deforestation in not known (i.e. if all the required permits were obtained).

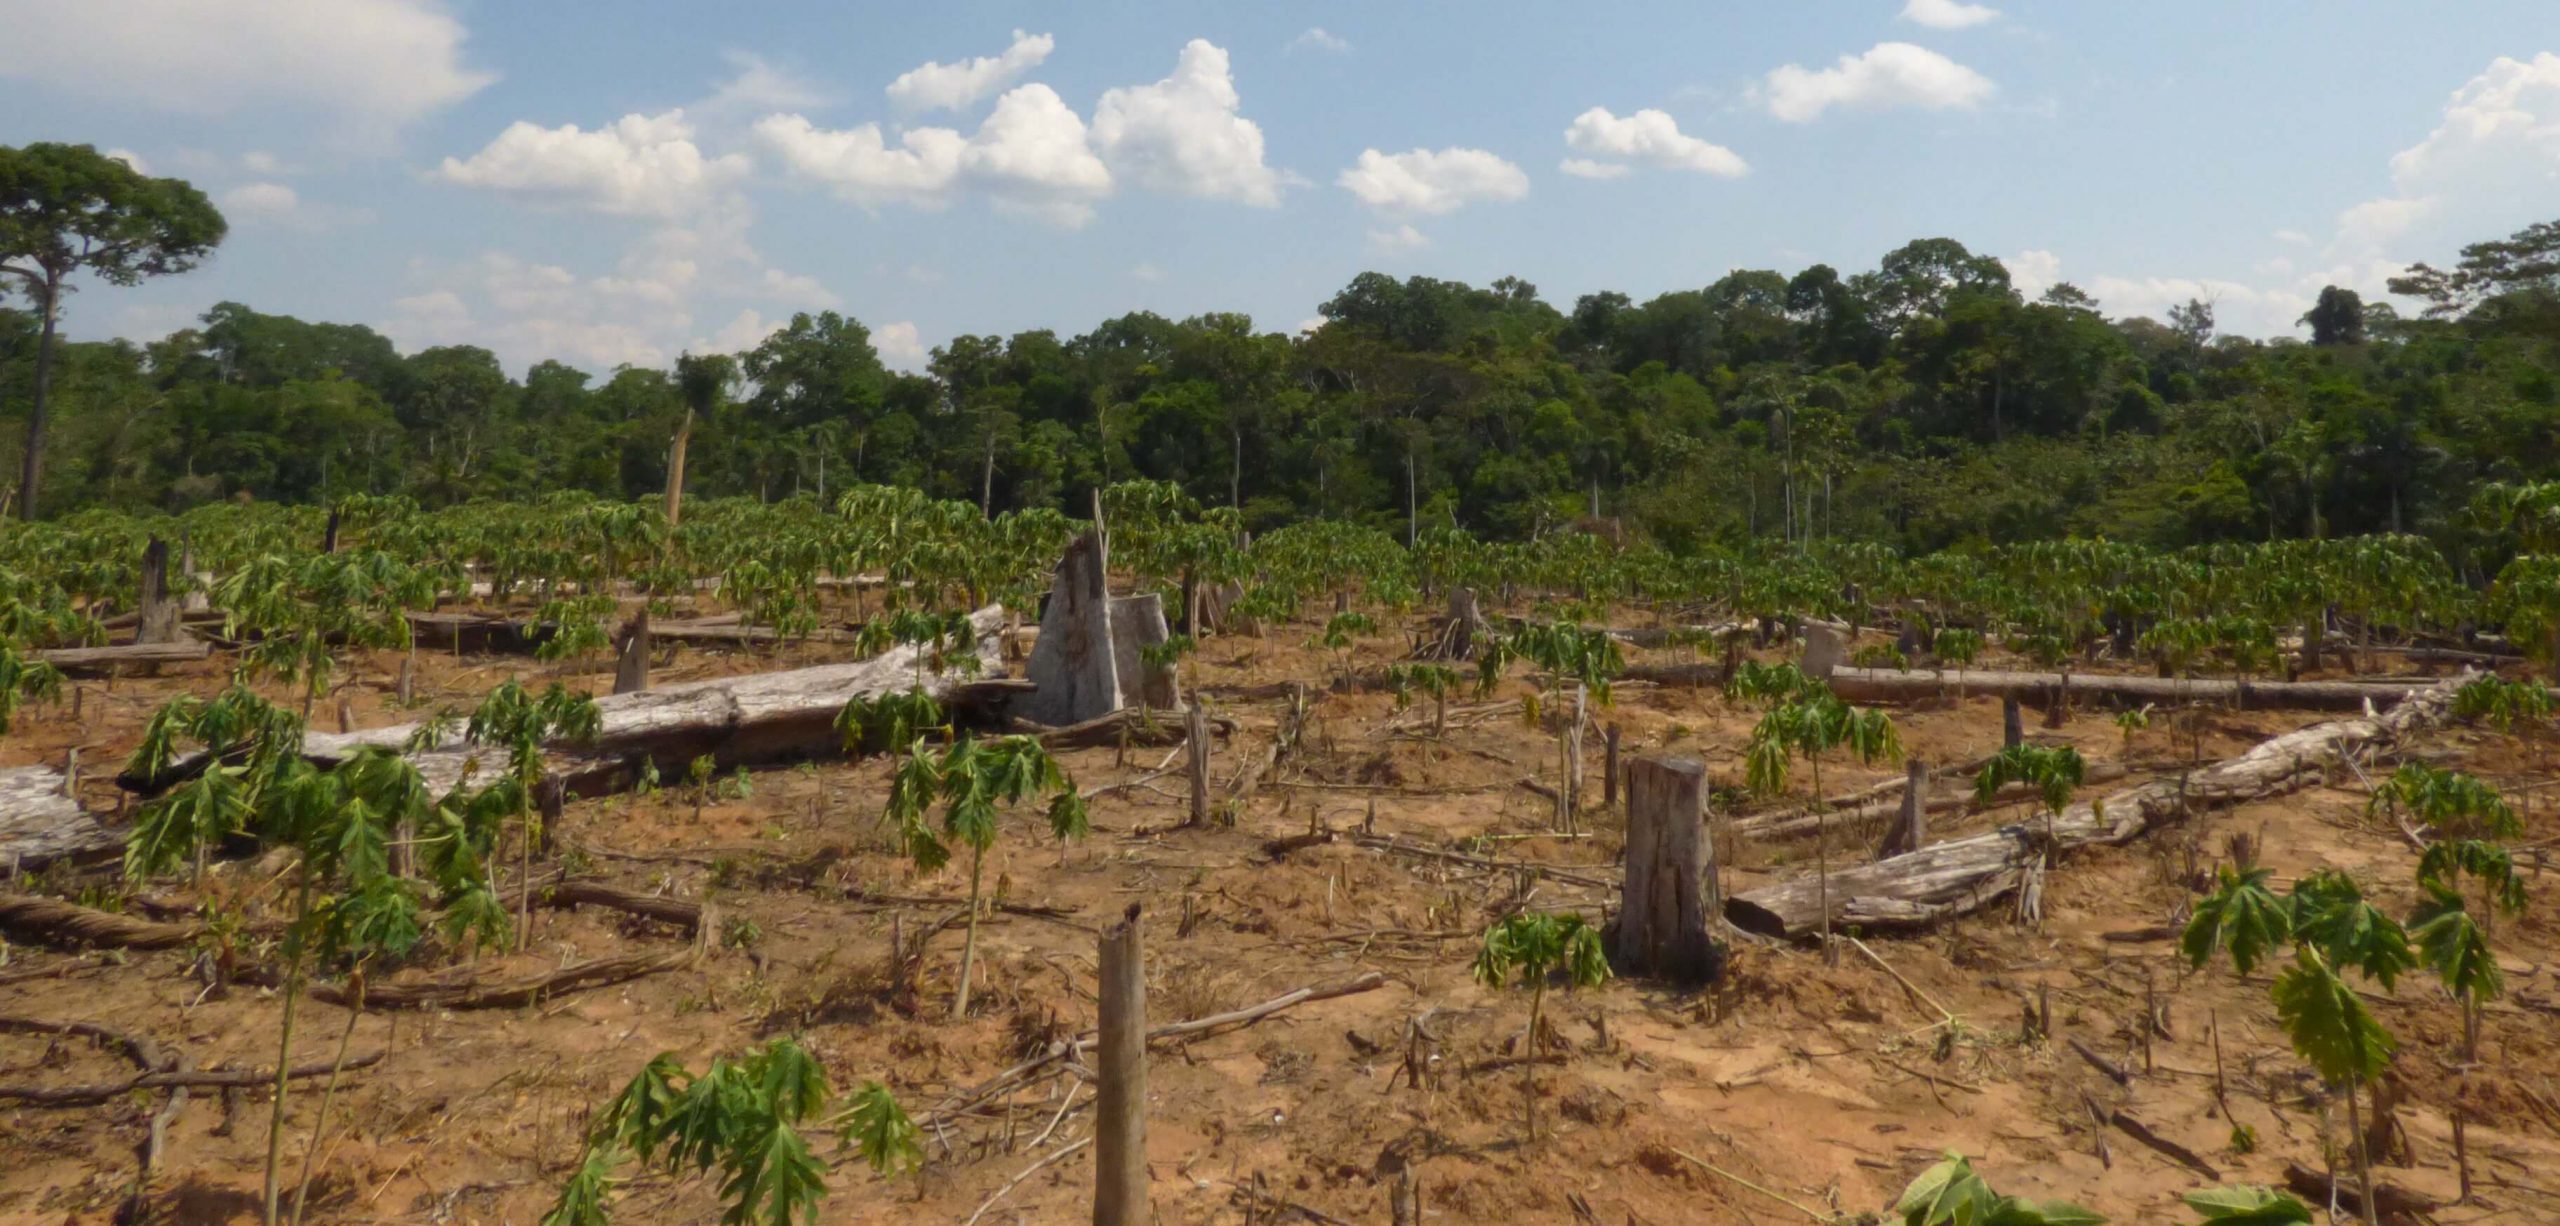
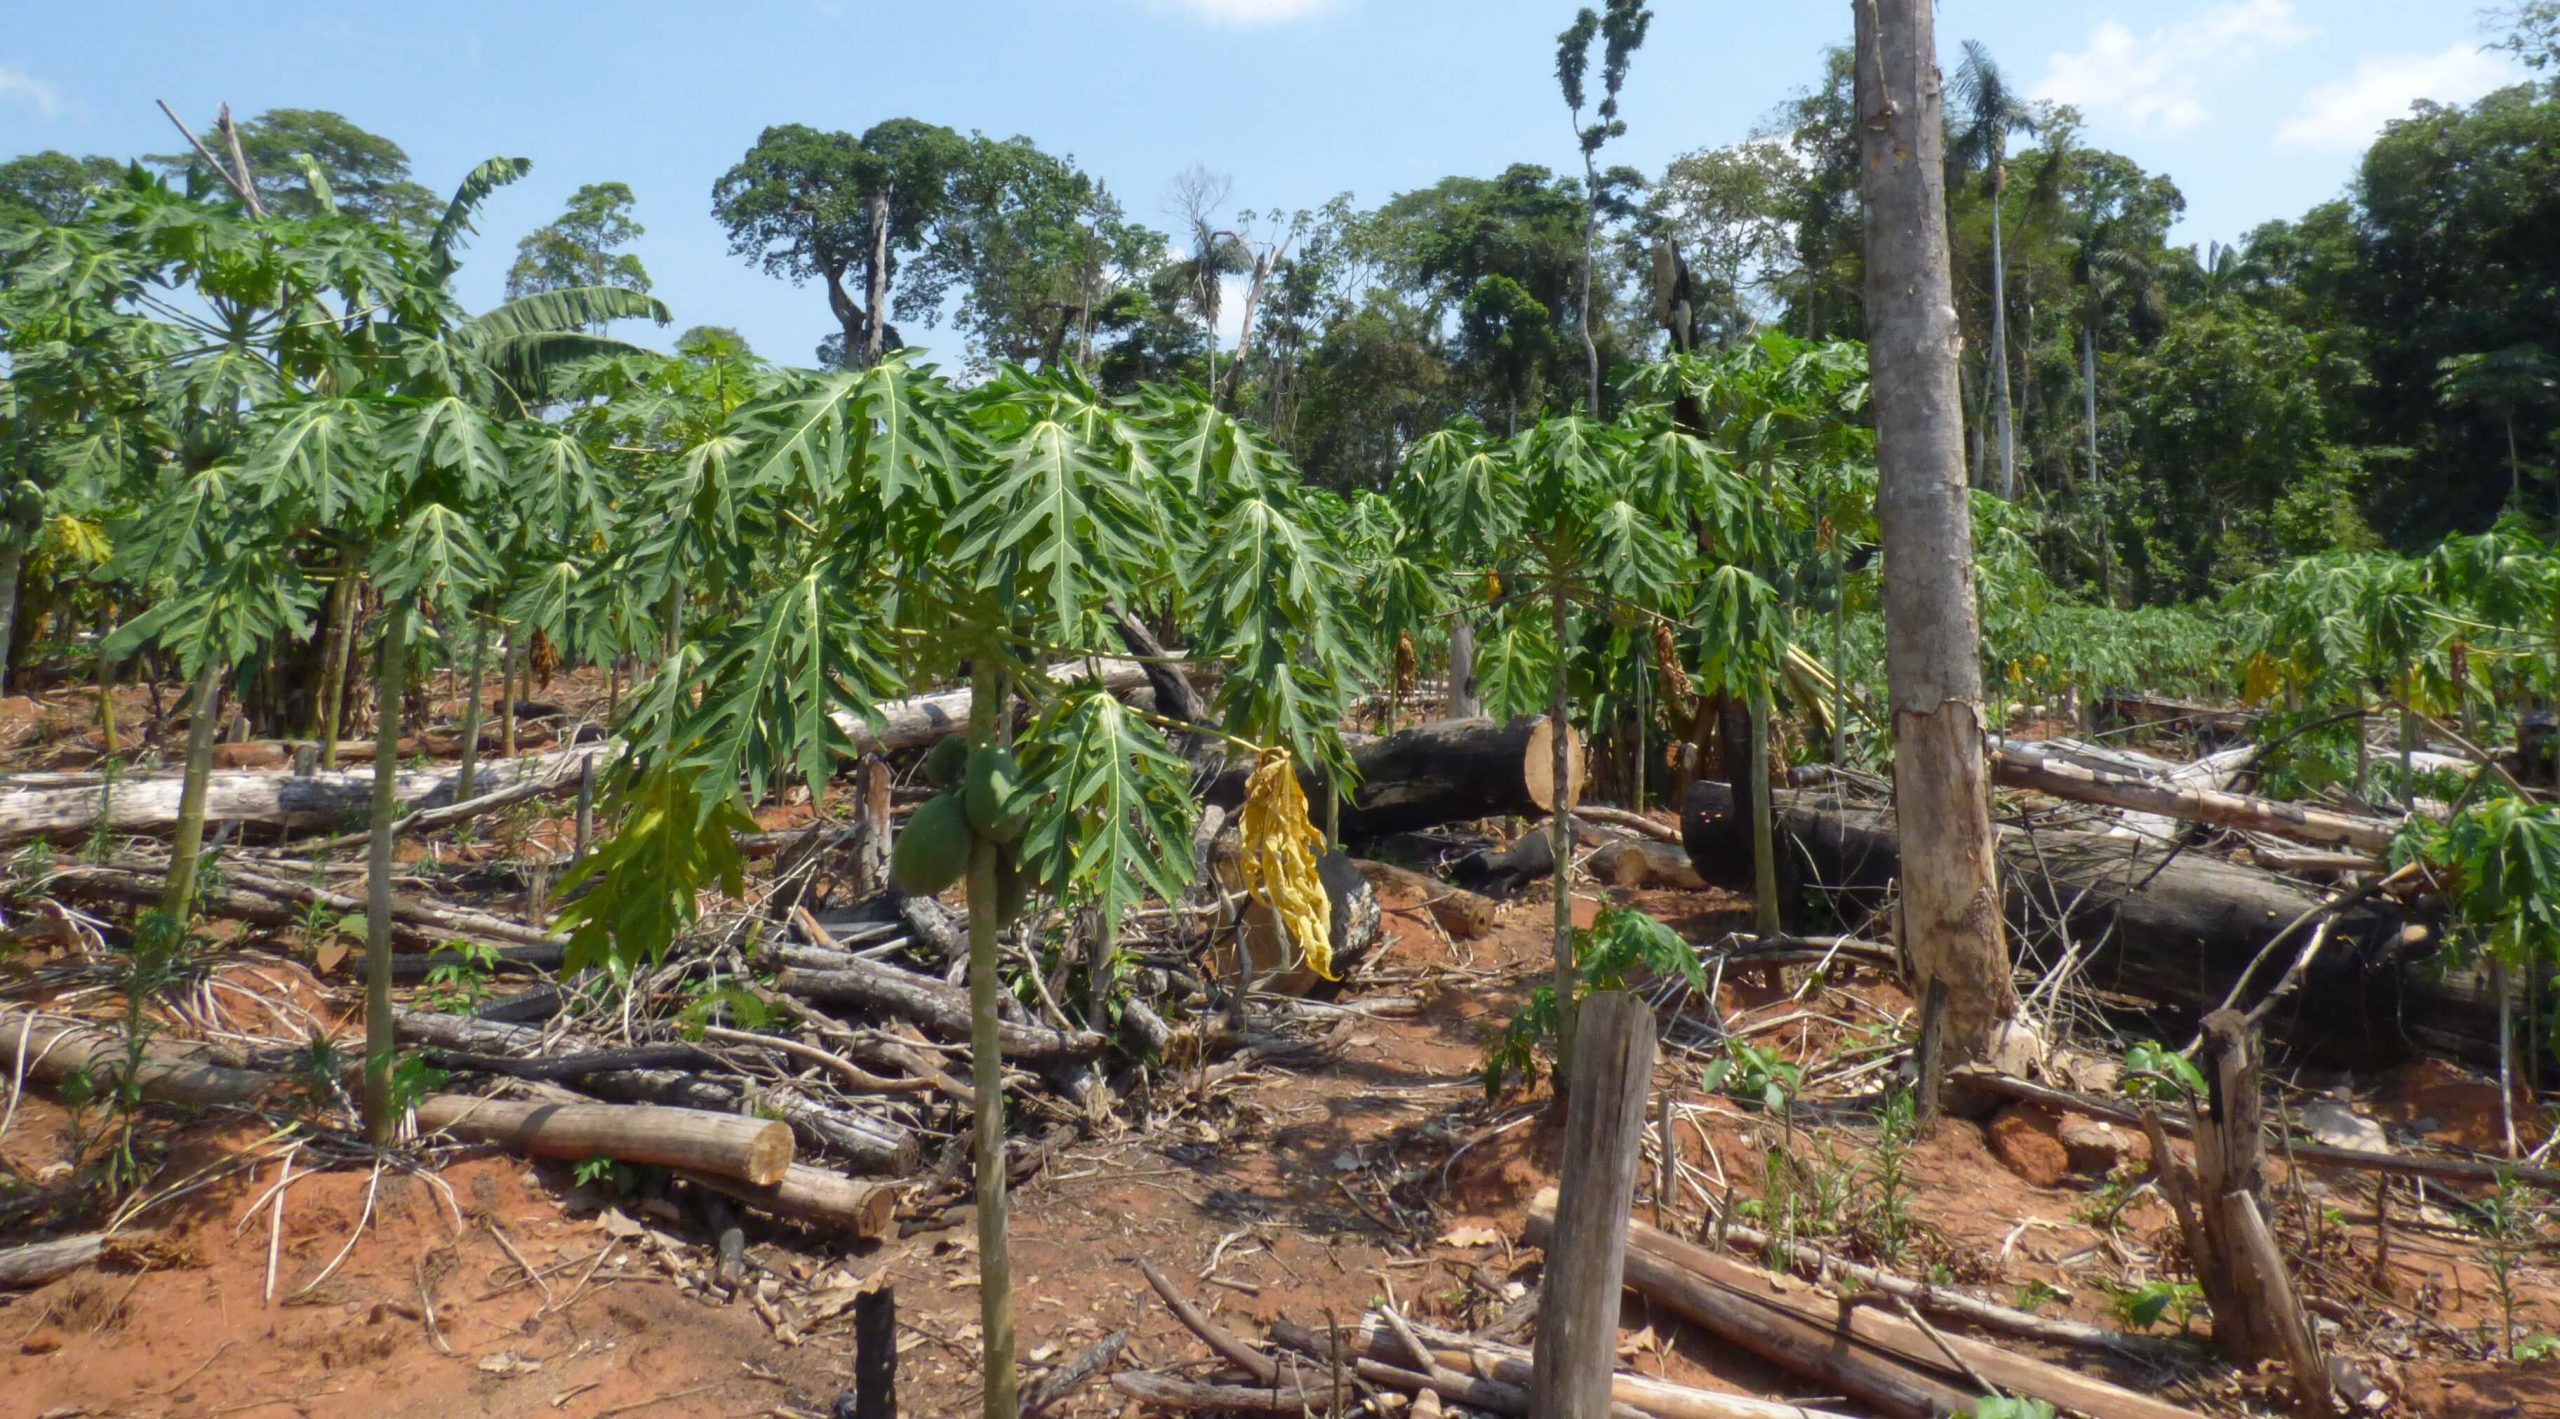
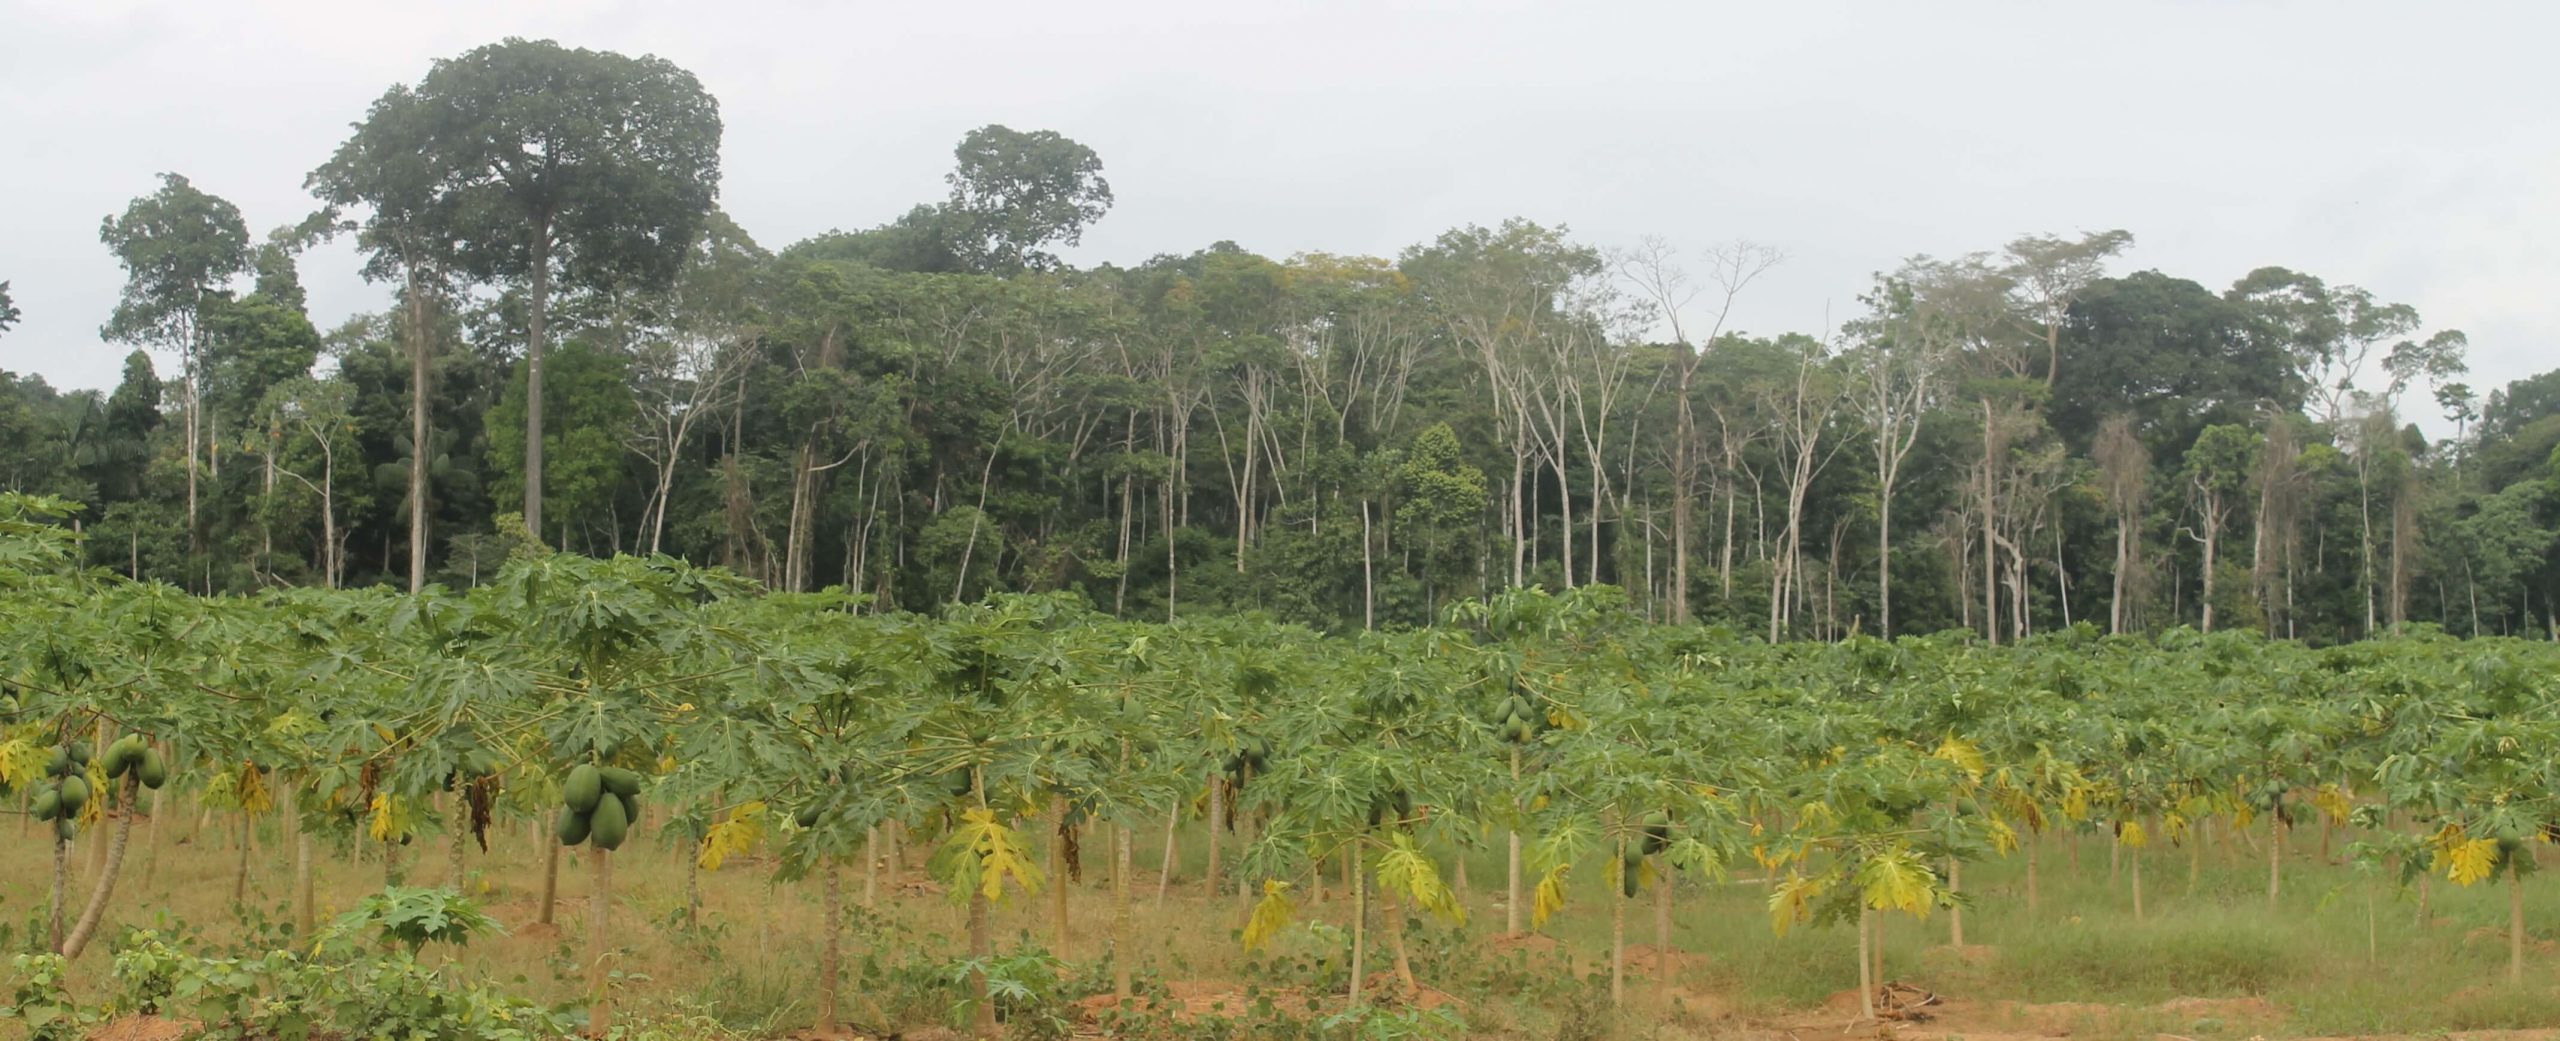
Below, we show satellite images and field photos of 5 examples of the recent deforestation caused by papaya cultivation.
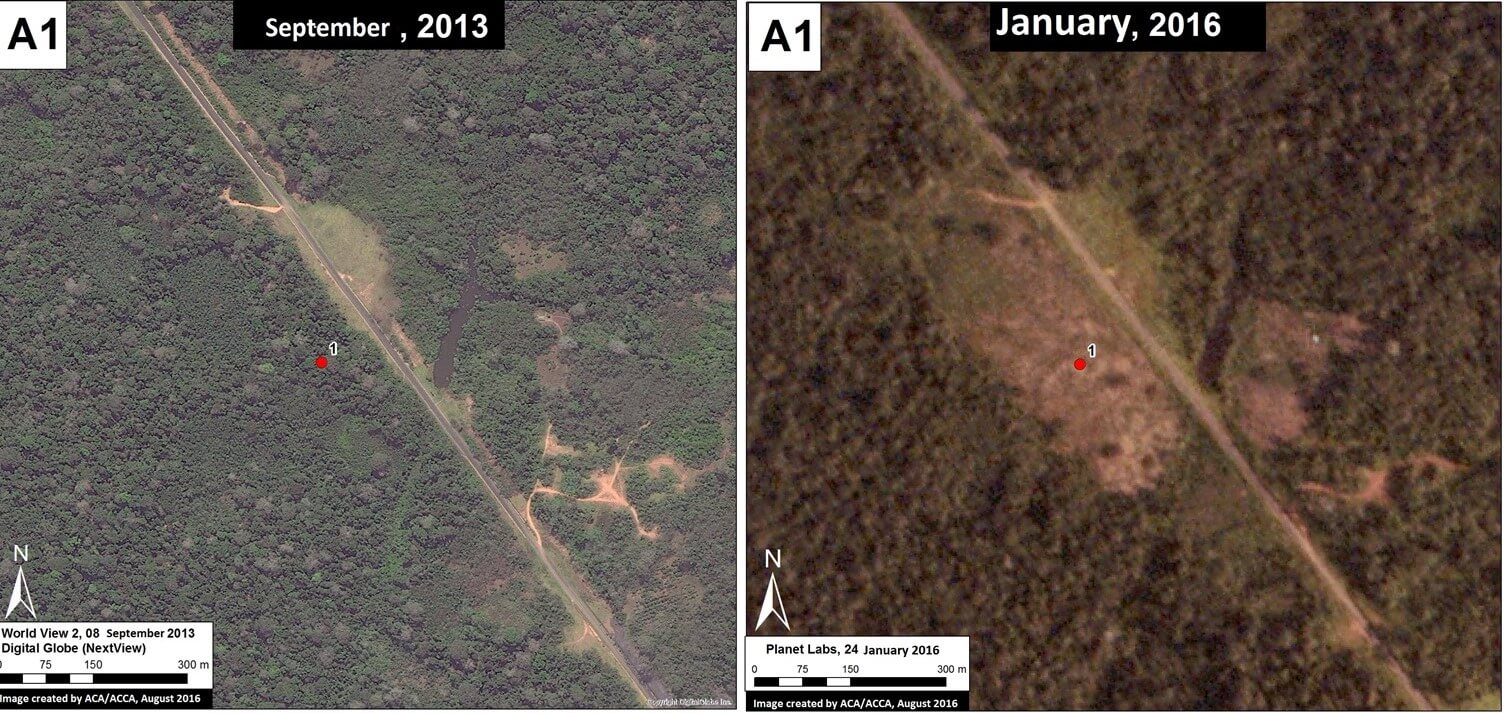
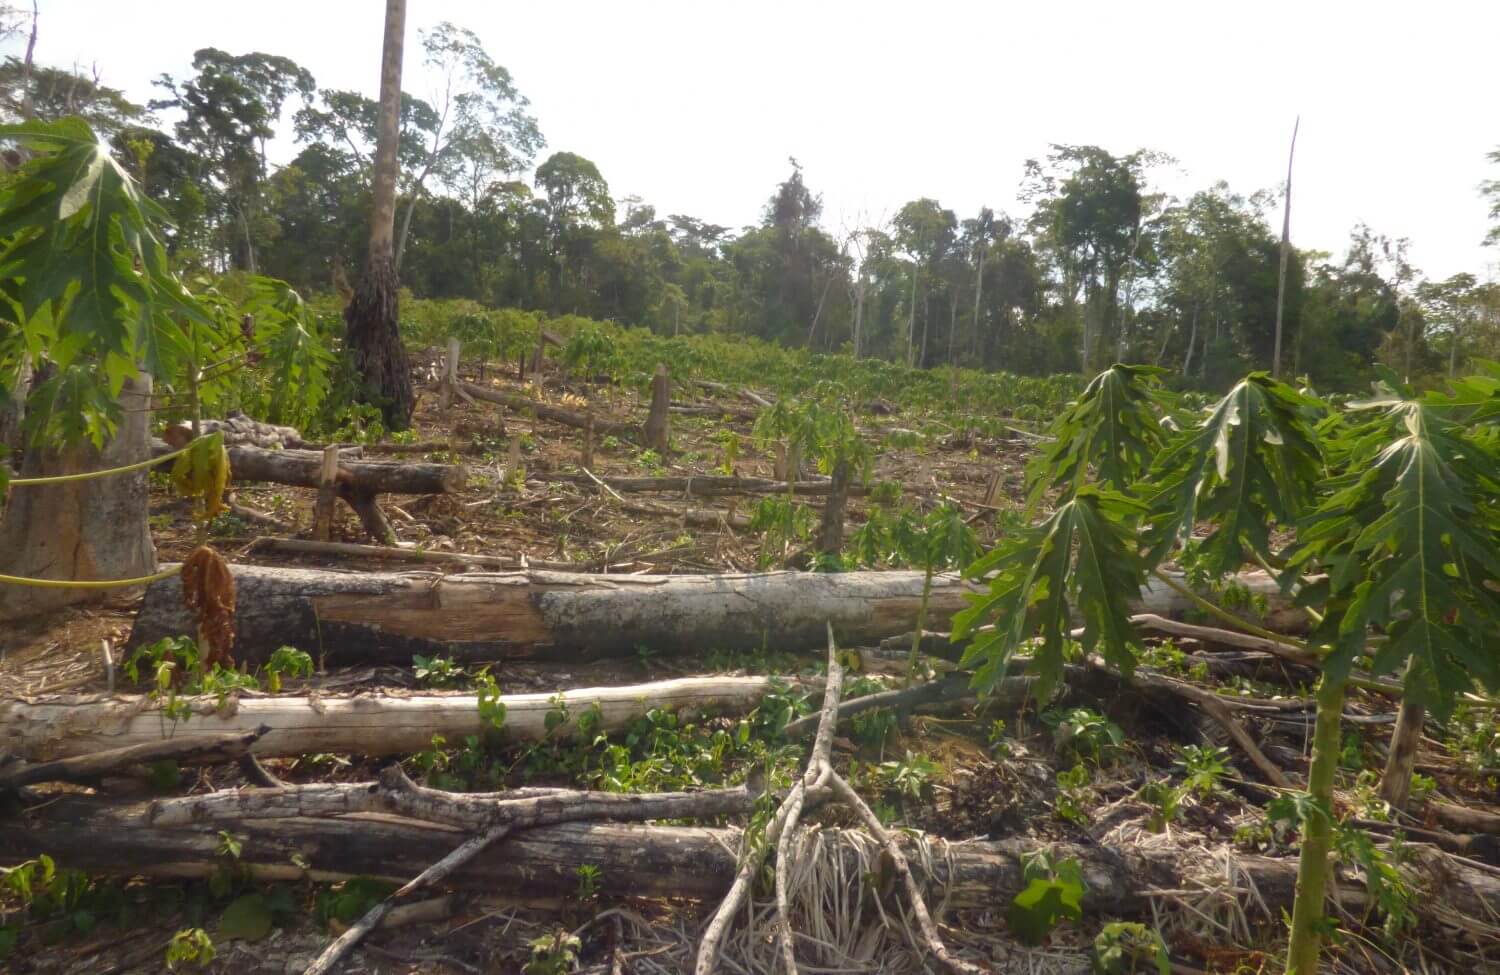
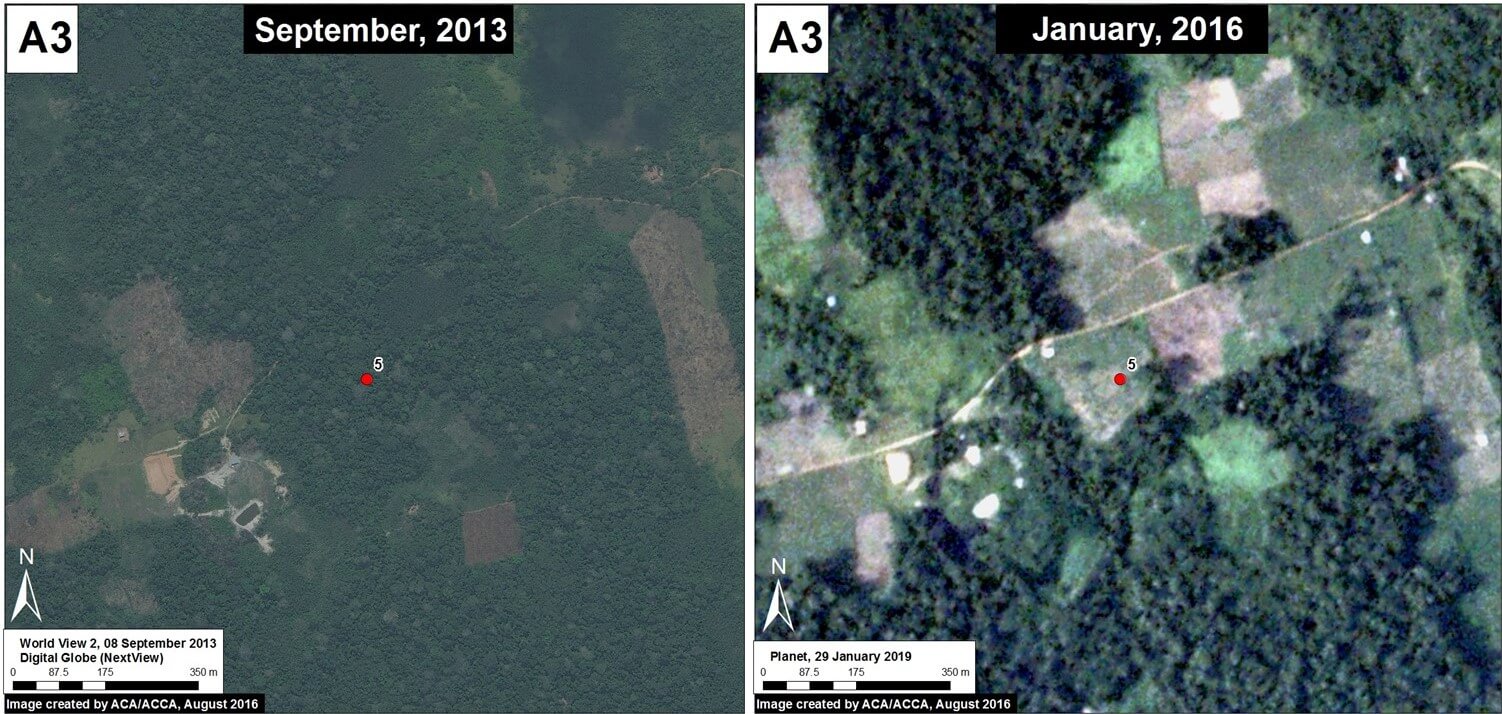

Example #1

Image 42b shows the deforestation of 12 hectares between September 2013 (left panel) and January 2016 (right panel). The red point indicates the same place in both images. Image 42c is a photo of the new papaya plantation in this area.
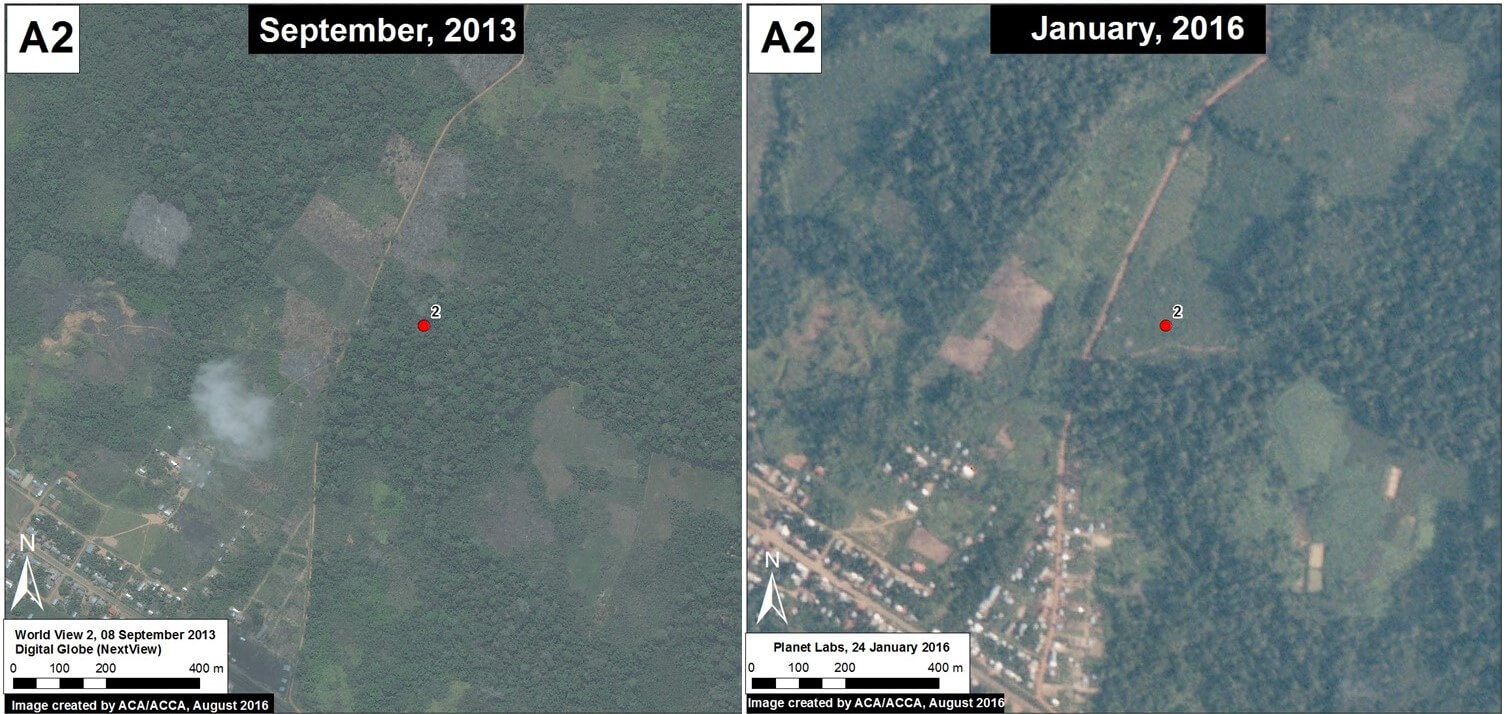
Image 42b. Data: Digital Globe (Nextview), Planet Labs
Image 42c. Photo: MINAM/DGOT, Terra-i

Example #2

Image 42d shows the deforestation of 5 hectares between September 2013 (left panel) and January 2016 (right panel). The red point indicates the same place in both images. Image 42e is a photo of the new papaya plantation in this area.


Image 42d. Digital Globe (Nextview), Planet Labs
Image 42e. Photo: MINAM/DGOT, Terra-i

Example #3

Image 42f shows the deforestation of 5 hectares between September 2013 (left panel) and January 2016 (right panel). The red point indicates the same place in both images. Image 42g is a photo of the new papaya plantation in this area.
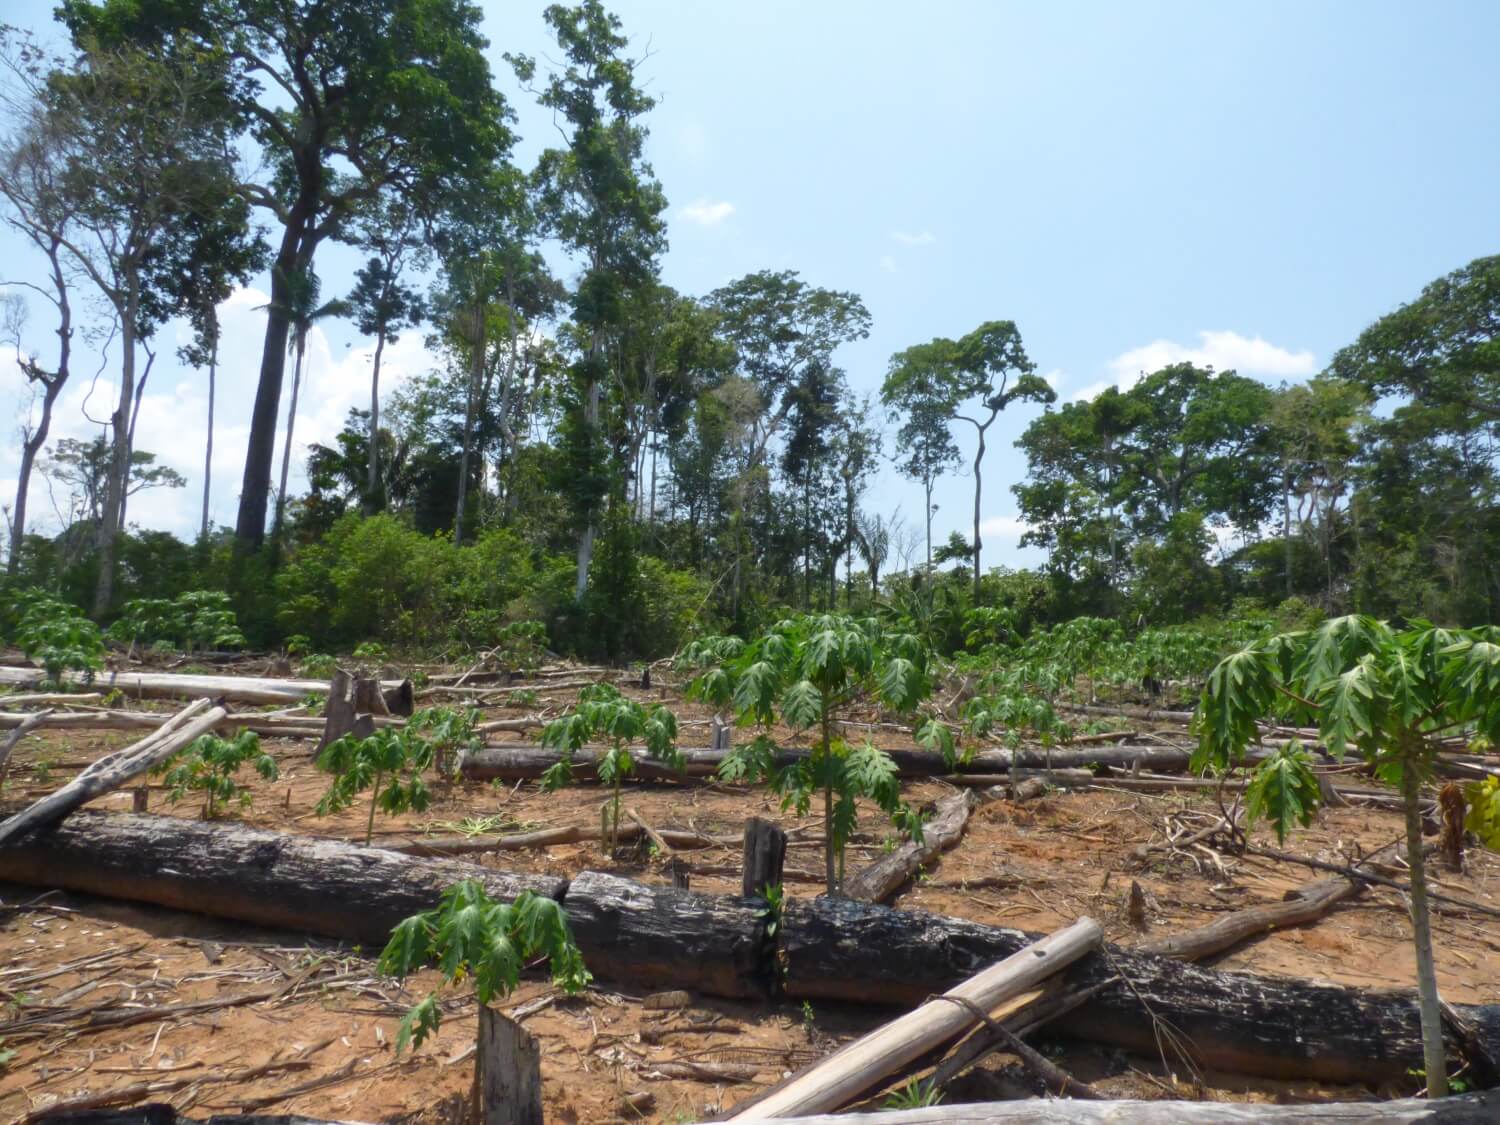
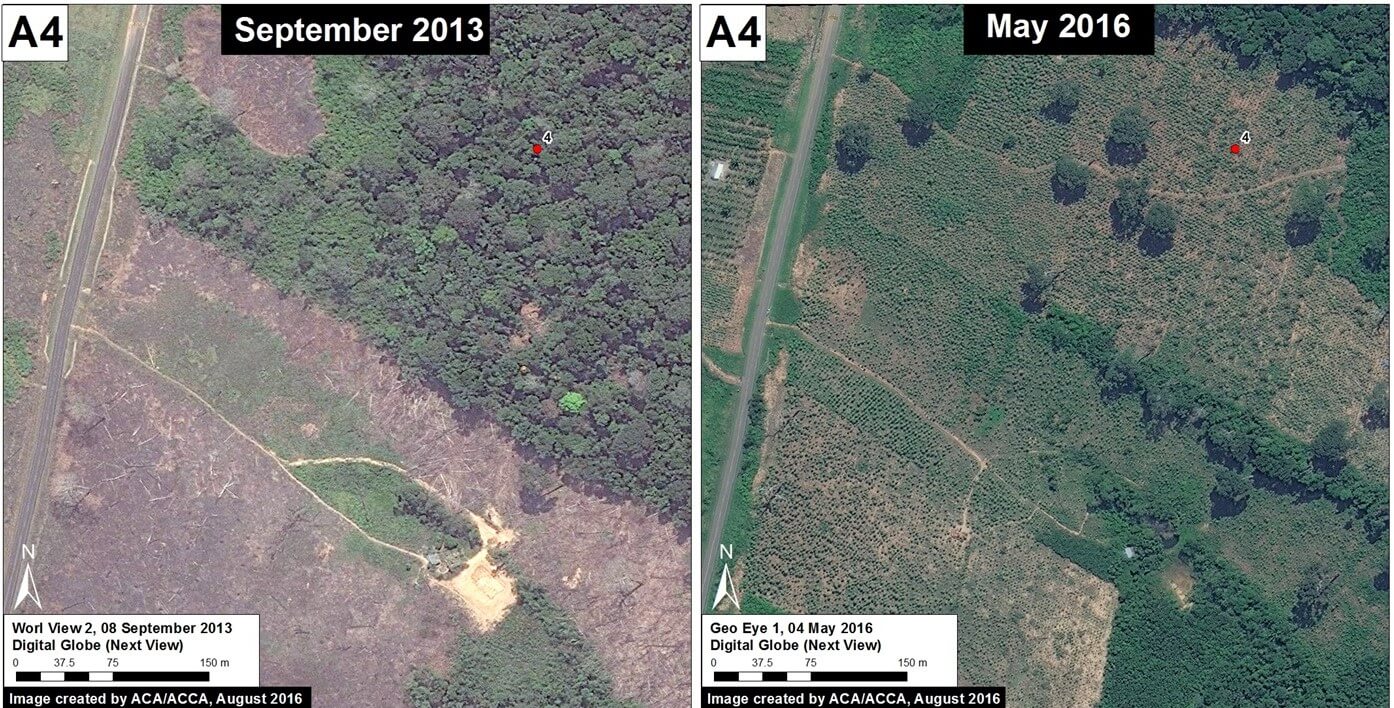

Image 42f. Digital Globe (Nextview), Planet Labs
Image 42g. MINAM/DGOT, Terra-i

Example #4

Image 42h shows the deforestation of 12 hectares between September 2013 (left panel) and May 2016 (right panel). The red point indicates the same place in both images. Image 42i is a photo of the new papaya plantation in this area.

Image 42h. MINAM/DGOT, Terra-i
Image 42i. Photo: MINAM/DGOT, Terra-i

Example #5

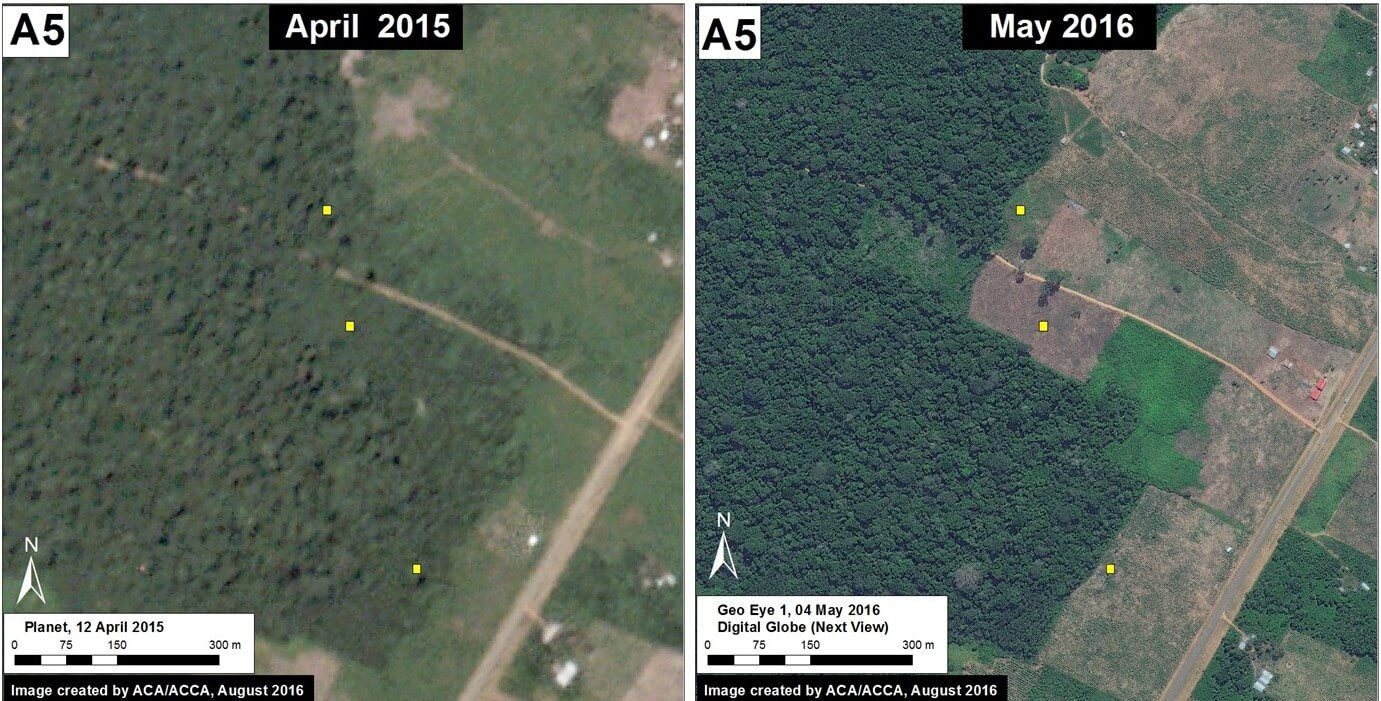
Image 42j shows the deforestation of 9 hectares between April 2015 (left panel) and May 2016 (right panel). The yellow boxes indicate the same place in both images. Image 42k is a photo of the new papaya plantation in this area.

Image 42j. MINAM/DGOT, Terra-i
Image 42k. Photo: Farah Carrasco

Citation

Finer M, Novoa S, Carrasco F (2016) Papaya – Potential New Driver of Deforestation in Madre de Dios. MAAP: 42.


MAAP #41: Confirming Large-Scale Oil Palm Deforestation in The Peruvian Amazon

In the previous MAAP #4, we documented the deforestation of 6,464 hectares (15,970 acres) between 2011 and 2015 associated with a large-scale oil palm project in the central Peruvian Amazon (Ucayali region) operated by the company Plantaciones de Pucallpa. In addition, we found that the majority of this deforestation occurred in primary forests,1 although there was also clearing of secondary vegetation.

In December 2015, the Native Community of Santa Clara de Uchunya presented an official complaint to the Roundtable on Sustainable Palm Oil (RSPO) against Plantaciones de Pucallpa, a member of the roundtable. An important component of the complaint centers on the deforestation described above, however the company has repeatedly denied causing it.

To better understand the deforestation in question, we compare three high-resolution satellite images: 1) July 2010, the most recent high-resolution, color image prior to the start of large-scale deforestation in May 2012; 2) June 2012, a black and white image from the time period when large-scale deforestation began; 3) September 2015, color image showing the established oil palm plantation.

Image 41a shows a base map of the project area in July 2010 (left panel), June 2012 (center panel), and September 2015 (right panel). We indicate areas of primary forest and secondary vegetation,2 recently deforested areas, and oil palm plantation. The images show that large-scale deforestation had begun by June 2012, and by 2015 there was a complete transformation of primary forest and secondary vegetation to large-scale oil palm plantationInsets A-F show the areas detailed in the zooms below. Click on images to enlarge.

Image 41a. Data: Digital Globe (Nextview), MAAP

[separator] Zoom A: Primary Forest

Images 41b-i show the zooms of the areas (Insets A – D) in which installation of the oil palm plantation replaced primary forest. The images show primary forest in July 2010 (left panel) and June 2012 (center panel) replaced by oil palm plantation in September 2015 (right panel). Note that in Inset D (Images 41h-i), recently cleared trees can seen as the large-scale deforestation was just starting at that time3.

Image 41b. Data: Digital Globe (Nextview)
Image 41c. Data: Digital Globe (Nextview)

Zoom B: Primary Forest

Image 41d. Data: Digital Globe (Nextview)
Image 41e. Data: Digital Globe (Nextview)

Zoom C: Primary Forest

Image 41f. Data: Digital Globe (Nextview)
Image 41g. Data: Digital Globe (Nextview)

Zoom D: Primary Forest

Image 41h. Data: Digital Globe (Nextview)
Image 41i. Data: Digital Globe (Nextview)

Zoom E: Secondary Vegetation

Images 41j-m show the zooms of the areas (Insets E – F) in which the oil palm plantation replaced secondary vegetation. The images show secondary vegetation in July 2010 (left panel) and June 2012 (center panel) replaced by oil palm plantation in September 2015 (right panel).

Image 41j. Data: Digital Globe (Nextview)
Image 41k. Data: Digital Globe (Nextview)

Zoom F: Secondary Vegetation

Image 41l. Data: Digital Globe (Nextview)
Image 41m. Data: Digital Globe (Nextview)

Notes

We define primary forest as an area that, from the first available Landsat image (in this case 1990), was characterized by a forest cover of closed and dense canopy. This definition is consistent with the official definition of the new Forest Law: “Forest with original vegetation characterized by the abundance of mature trees with superior or dominant species canopy, which has evolved naturally.”

2 Primary and secondary forest classifications come from the analysis published in MAAP #4

3 Analysis of additional satellite imagery reveals that the large-scale clearing started between May and June 2012.


Citation

Finer M, Cruz C, Novoa S (2016) Confirming Deforestation for Oil Palm by the company Plantations of Pucallpa. MAAP: 41


From the field: Discovering sustainable livelihoods deep in the Amazon 

From the field: Discovering sustainable livelihoods deep in the Amazon 

Ryan Thompson, an Environmental Conservation Master’s of Science Candidate at the University of Wisconsin-Madison, recently returned home from spending 10 weeks in the Peruvian Amazon, going to parts of the rainforest where few people have ever set foot. 

He took the trip to produce a series of short videos  featuring our partners on the ground who are engaged in forest-friendly enterprises such as fish farming and agroforestry, along ACA’s Manu-Tambopata Conservation Corridor (MAT). Our MAT corridor strategy consists of over 500,000 acres of rainforest in one of the most biologically diverse regions in the world, widely recognized as a global conservation priority. Through a variety of conservation tools including protected areas and sustainable livelihoods activities, the MAT corridor helps protect this keystone habitat, which provides critical ecosystem services such as regulating the climate for the Amazon basin, storing globally significant levels of carbon, and protecting the headwaters of the Amazon.

Through his expeditions, Ryan was able to experience living in the deep Amazon without the comforts of the modern world; how ACA and our sister organization Conservacion Amazónica-ACCA are helping local communities with sustainable practices like agroforestry; and even a little about the local folklore from the region. One special experience was meeting with an ACA partner, Nemecio Barrientos, and his family. Nemecio manages a fish farm that produces over 17,000 pounds of fish every year, providing his family with a sustainable source of income and food. “This experience has been a great teacher,” said Ryan of his weeks in the rainforest, “forcing me to learn to adapt and work with what we’ve got.”

Check out more of Ryan’s stories from the field on his blog: http://ryandthompson.me/blog/

Fourth graders helping to save the Amazon!  

Child hugging pine (tree)

An inspiring group of fourth graders are showing that at any age it’s possible to come together to help conserve our rainforest!

A fourth grade classroom from Greenacres Elementary School in Bethesda, Maryland were presented with three project ideas to support conservation and sustainable livelihood programs in the Peruvian Amazon. After deliberating among themselves and taking a vote, they chose to support our camera trap program. Camera traps are an automated digital device that takes a flash photo or a sequence of photos whenever an animal triggers an infrared sensor. They play an increasingly crucial role in conservation by enabling scientists to collect photographic evidence of the presence and abundance of elusive species such as jaguars, and document responses to threats such as deforestation, with little disturbance to wildlife.

The project idea came from a long time ACA supporter, Marcia Brown from the Foundations of Success, when she learned that her son’s class was interested in running a fundraising project for a nonprofit organization. She suggested ACA as a beneficiary and the kids were excited to learn about all the ways we protect the Amazon. You too can follow in their footsteps and become a forest protector by making a donationvolunteering your time, or visiting our biological stations!

big thank you to our little supporters: Fernando Molina, Peter Andersen, Zachary Bernier, Maddie Card, Elijah Chambers, Joshua Cohen, Amber Combs, Caitlin Crain, Henry Dirckx, Jovi Greene, Ella Halsey, Miles Hansen, Lilly Kaufmann, Gelienda Lancaster, Noah Lantor, Pau Maset, Nathaniel Mintzer, Avital Morris, Alexandros Murshed, Jacob Orenstein, Manu Padmanabha, Linda Robinson, Brooke Rosen, Sammy Sandler, Alexia Sandonas, Raya Schein, Nora-Sheetal Shaughnessy, Jack Solovey, Drew Steinman, Elana and Grace Stephens, Graham Storper, Dilan Suleman, Ike Wicht, and Raphael Wolf.

Two more conservation areas established in Peru

Two more conservation areas established in Peru

Last month we shared the story of Miguel Paredes de Bellota and his family, who, with the help of ACA and our sister organization Conservación Amazónica (ACCA), were able to establish their own conservation area called Santuario de la Verónica after a six year battle. This month we helped finalize the establishment of two more conservation areas in the region!

Fundo Cadena and Machusmiaca II are the names of the new protected conservation area, both of which are private lands owned by local families who made the commitment to have the areas set aside for conservation purposes. Venecio Cutipa, the owner of Machusmiaca II, was excited to share the motivation behind his decision to create a conservation area: “For more than 30 years I have lived in this forest, and I envision a future where my four children can also enjoy what nature has given me. By working the land in a sustainable way and protecting the forest, I can achieve that future for the benefit and well-being of my children.

Combined, Fundo Cadena and Machusmiaca II represent 139 hectares (about 343 acres) of land that is now safely protected. We are so proud of all these individuals and their families for striving to protect the rainforest. When it comes to conservation, every acre matters!

MAAP #40: Early Warning Deforestation Alerts in The Peruvian Amazon

GLAD alerts are a powerful new tool to monitor forest loss in the Peruvian Amazon in near real-time. This early warning system, created by the GLAD (Global Land Analysis and Discovery) laboratory at the University of Maryland and supported by Global Forest Watch, was launched in March 2016 as the first Landsat-based (30-meter resolution) forest loss alert system (previous systems were based on lower-resolution imagery). The alerts are updated weekly and can be accessed through Global Forest Watch (Image 40a, left panel) or GeoBosques (Image 40a, right panel), a web portal operated by the Peruvian Ministry of Environment.

Image 40a. Data: UMD/GLAD, WRI/GFW, PNCB/MINAM

In MAAP, we often combine these alerts with analysis of high-resolution satellite imagery (courtesy of the Planet Ambassador Program and Digital Globe NextView service) to better understand patterns and drivers of deforestation in near real-time. In this article, we highlight 3 examples of this type of innovative analysis from across the Peruvian Amazon:

Example 1: Logging Roads in central Peru (Ucayali)
Example 2: Invasion of Ecotourism Concessions in southern Peru (Madre de Dios)
Example 3: Buffer Zone of Cordillera Azul National Park (Loreto)


Example 1: Logging Roads in central Peru (Ucayali)

In the previous MAAP #18, we documented the proliferation of logging roads in the central Peruvian Amazon during 2015. In recent weeks, we have seen the start of rapid new logging road construction for 2016. Image 40b shows the linear forest loss associated with two new logging roads along the Tamaya river in the remote central Peruvian Amazon (Ucayali region). Red indicates the 2016 road construction (35.8 km). Insets A and B indicate the areas shown in the high-resolution zooms below.

Image 40b. Data: UMD/GLAD, Hansen/UMD/Google/USGS/NASA, MINAGRI

The following images show, in high-resolution, the rapid construction of logging roads in 2016. Image 40c shows the construction of 16.1 km between March (left panel) and July (right panel) 2016 in the area indicated by Inset A. Image 40d shows the construction of 19.7 km between June (left panel) and July (right panel) 2016 in the area indicated by Inset B.

Image 40c. Data: Planet
Image 40d. Data: Planet

Example 2: Invasion of Ecotourism Concessions in southern Peru (Madre de Dios)

Image 40e shows the recent deforestation within two ecotourism concessions along the Las Piedras River in the Madre de Dios region. Red indicates the 2016 GLAD alerts (67.3 hectares). Note that the Las Piedras Amazon Center (LPAC) Ecotourism Concession represents an effective barrier against deforestation occurring in the surrounding concessions. According to local sources, the main drivers of deforestation in the area are related to the establishment of cacao plantations and cattle pasture (see s MAAP #23). Inset A indicates the areas shown in the high-resolution zoom below.

Image 40e. Data: UMD/GLAD, Hansen/UMD/Google/USGS/NASA, MINAGRI

Image 40f shows high-resolution images of the area indicated by Inset A between April (left panel) and July (right panel) 2016. The yellow circles indicate areas of deforestation between these dates.

Image 40f. Data: Planet, DigitalGlobe (Nextview)

Example 3: Buffer Zone of Cordillera Azul National Park (Loreto)

Image 40g shows the recent deforestation within the western buffer zone of the Cordillera Azul National Park in the Loreto region. Red indicates the 2016 GLAD alerts (87.3 hectares). It is worth noting that this area is classified as Permanent Production Forest, not as an agricultural area.

Image 40g. Data: SERNANP, Landsat, UMD/GLAD, Hansen/UMD/Google/USGS/NASA

Image 40h shows high-resolution images of the area indicated by Inset A between December 2015 (left panel), January 2016 (central panel), and July 2016 (right panel). The yellow circles indicate areas that were deforested between these dates. The driver of the deforestation appears to be the establishment of small-scale agricultural plantations.

Image 40h. Data: RapidEye/Planet, Digital Globe (Nextview)

Citation

Finer M, Novoa S, Goldthwait E (2016) Early Alerts of Deforestation in the Peruvian Amazon. MAAP: 40.


MAAP #39: Gold Mining Deforestation Within Tambopata National Reserve Exceeds 865 Acres

Based on analysis of satellite imagery, we have documented that the deforestation due to illegal gold mining activities within Tambopata National Reserve (Madre de Dios region) now exceeds 350 hectares (872 acres) since the initial invasion in late 2015 (see Image 39a). Although the rate of deforestation has decreased since April, when the Peruvian government installed a permanent control post* in the area, it is clear that the deforestation continues to expand.  In the Image, we highlighted the most recent deforestation (June and July 2016) in red to emphasize the current fronts. Insets A and B indicate the areas detailed in the zooms below.

*A recent article in the New York Times highlighted the extreme difficulty faced by the Peruvian government in cracking down on the illegal mining. Yesterday, the leading Peruvian newspaper El Comercio reported that the control post has been abandoned due to lack of resources.

Image 39a. Data: Planet, SERNANP, MAAP

Zoom A

In the following images, we show high-resolution examples of the recent deforestation within the reserve. Image 39b shows the deforestation that occurred between May 30 (left panel) and June 20 (right panel), 2016 in the area indicated by Inset A. The red circles indicate primary zones of new deforestation between these dates.


Image 39b. Data: Planet, SERNANP

Zoom B

Image 39c shows the deforestation between May 3 (left panel) and July 21 (right panel), 2016 in the area indicated by Inset B. The red circles indicate primary areas of new deforestation between these dates.

Image 39c. Data: Digital Globe (Nextview), SERNANP

Citation

Novoa S, Finer M, Olexy T (2016) Gold Mining Deforestation within Tambopata National Reserve exceeds 350 Hectares. MAAP: #39