MAAP #123: Detecting Illegal Logging In The Peruvian Amazon

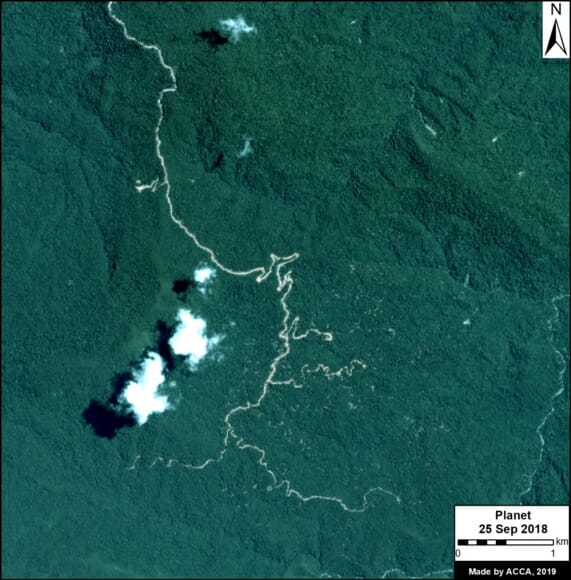
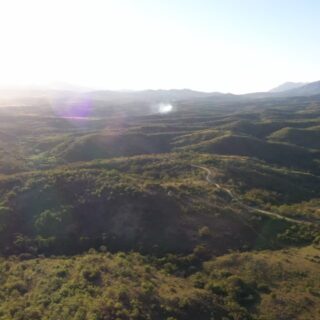
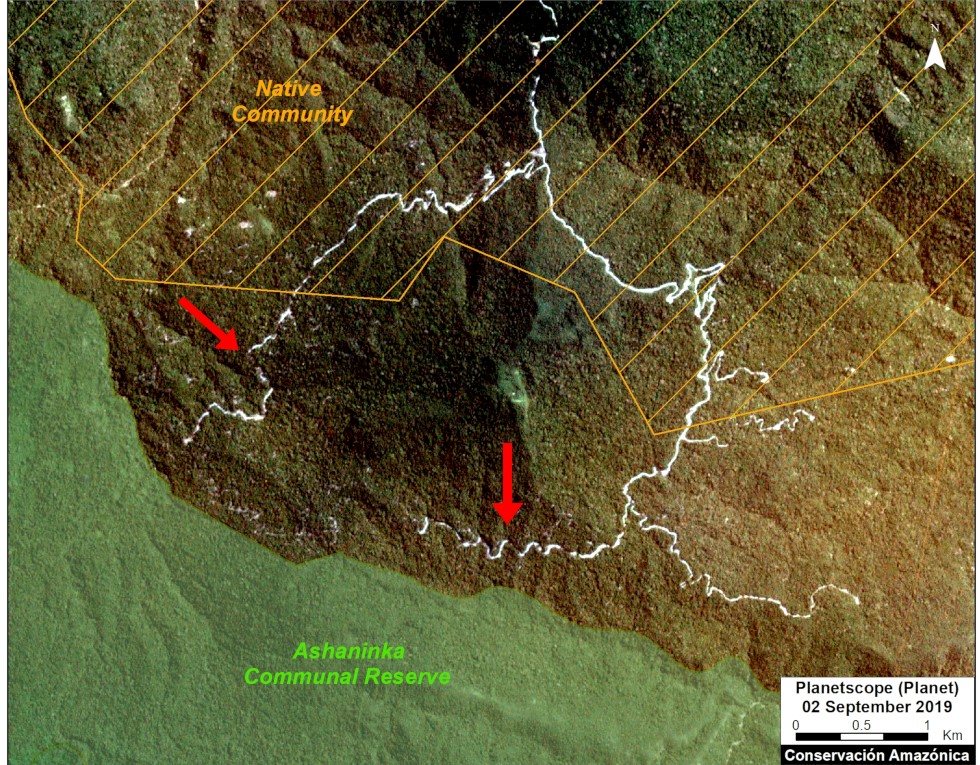
Image 1. Example of a 2019 logging road with signs of illegality. Data: Planet.

In the Peruvian Amazon, the widespread illegal logging is difficult to detect with satellites because it is selective for high-value species (not clearcutting).

It is possible, however, to detect the associated logging roads.

In this report, we present a novel technique to identify illegal logging: analyze new logging roads in relation to detailed land use data available from government agencies.

Thus, our new method detects the crime in real-time and preventive action is still possible. This is important because when an intervention against illegal logging normally occurs, stopping a boat or truck with illegal timber, the damage is done.

This analysis has two parts. First, we identified the new logging roads built in the Peruvian Amazon during 2019, updating our previous work for 2015-18 (see Base Map).

Second, we analyzed the new logging road data in relation to governmental land use information in order to identify possible illegality.

This data is from 2019, but we are now applying this technique in real time during 2020.


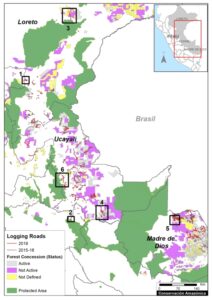
Base Map. 2019 Logging roads, in relation to 2015-18 logging roads. Data: MAAP.

Logging Roads 2019

The Base Map illustrates the location of logging roads built in the Peruvian Amazon during the last 5 years.

Previously (MAAP #99), we documented the construction of 3,300 kilometers of logging roads between 2015 and 2018.

Here, we estimate the construction of an additional 1,500 kilometers in 2019 (see red).

Note that forest roads are mainly concentrated in the Ucayali, Madre de Dios and Loreto regions.

Below, we show three types of possible illegality that detected in 2019:

  • Logging roads in areas without forestry concessions or permits (Cases 1-2).
    .
  • Logging roads in existing forest concessions, but whose current status is defined as “Non-Active or Undefined” (Cases 3-5).
    .
  • Logging roads in Native Communities (Case 6).


Cases of Possible Illegality

Logging roads in areas without forestry concessions or permits

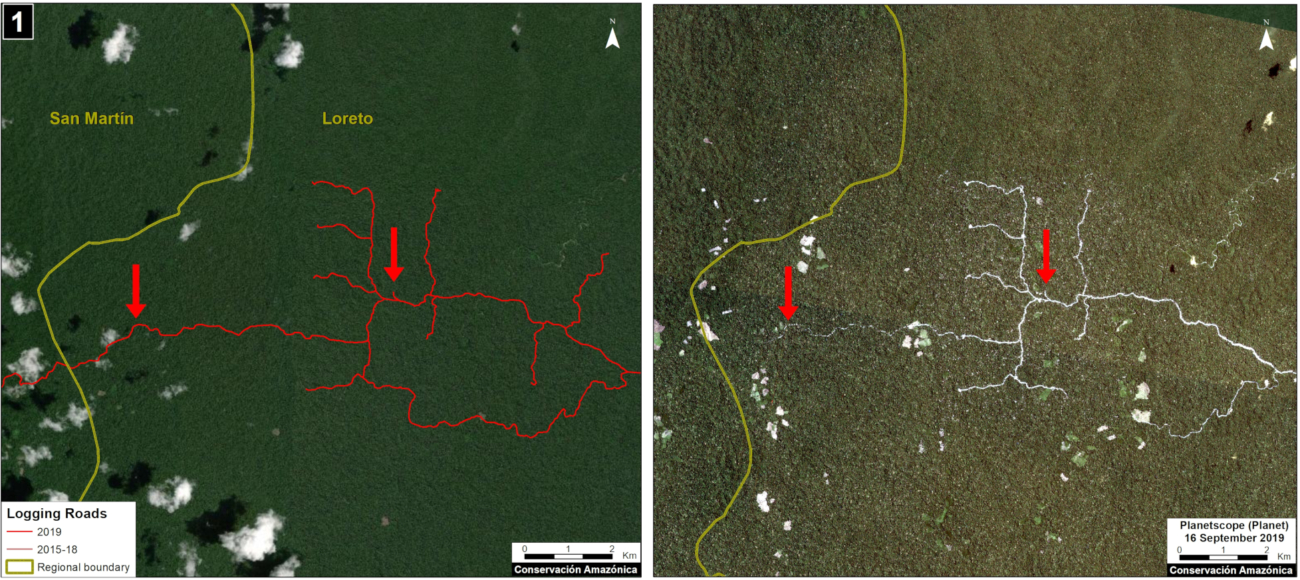
Case 1. We detected the opening of a new logging road network (55 km) in an area without forestry concessions or permits, between the limits of the Loreto and San Martín regions. The image shows the digitized logging roads (red, left panel), and non-digitized satellite image (right panel). The arrows provide reference points between panels.

Case 1. Data: MAAP, Planet. Click to enlarge.


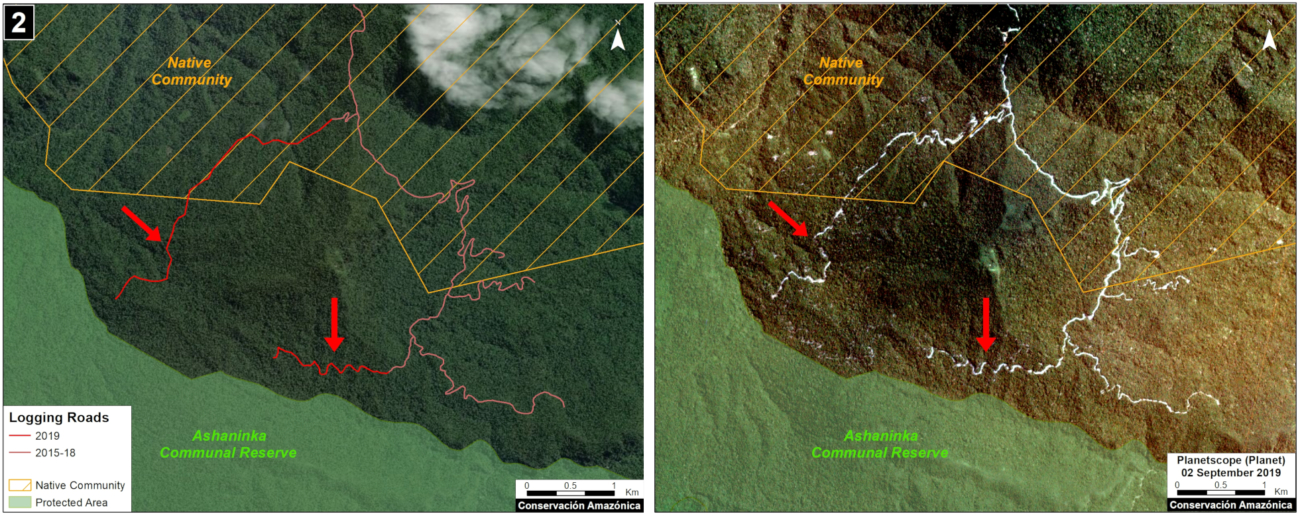
Case 2. We detected the construction of a new logging road network (5.8 km) in the buffer zone of Asháninka Communal Reserve, reaching only 300 meters from the protected area. The image shows the digitized logging roads (red, left panel), and non-digitized satellite image (right panel). The arrows provide reference points between panels.

Case 2. Data: MAAP, Planet, IBC, SERNANP. Click to enlarge.


Logging roads in existing forest concessions, but whose current state is labelled as “Non-Active or Undefined” 

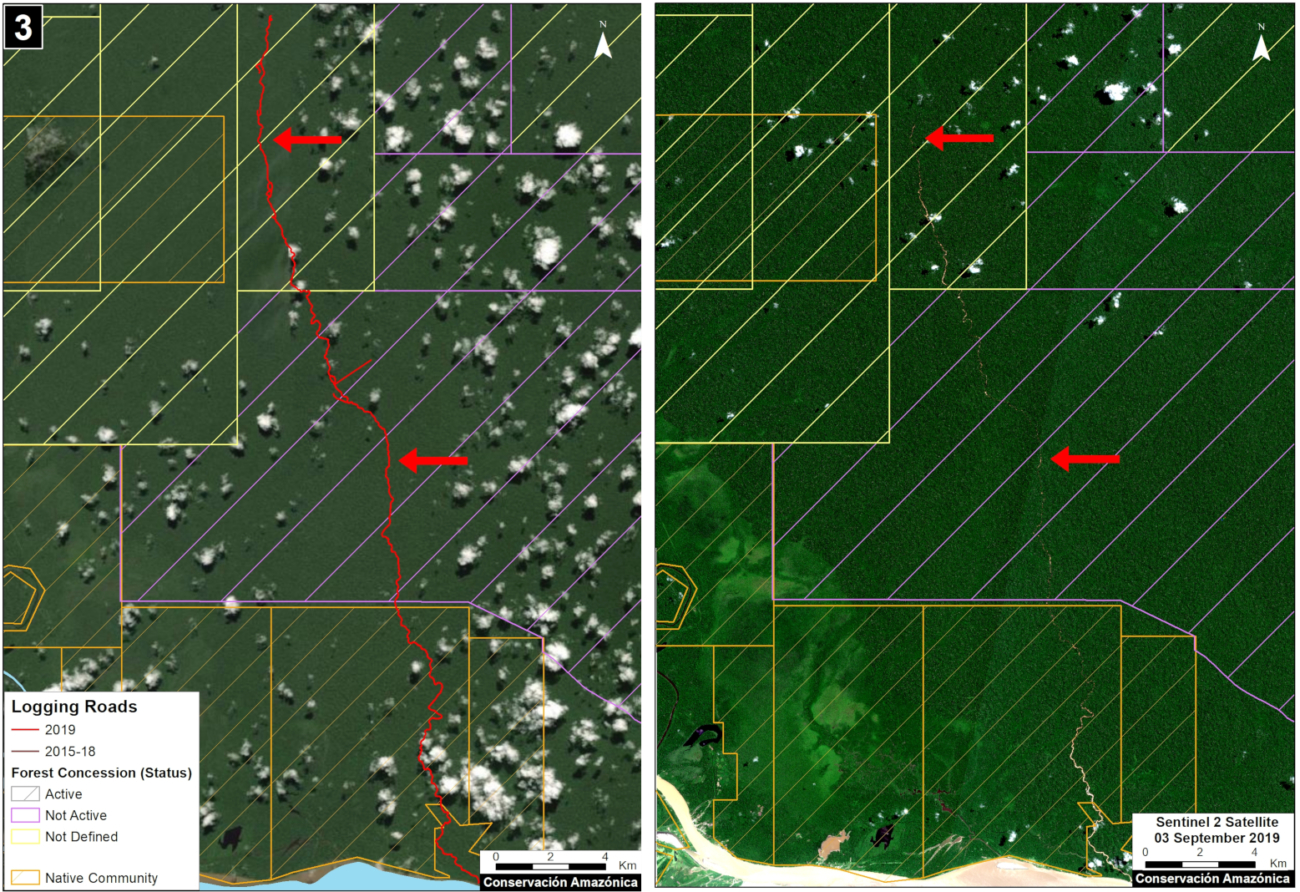
Case 3. We detected the construction of a new logging road (45.3 km) that crosses a native community and reaches a forest concession whose status is defined as “Undefined,” in the Loreto region just north of Pacaya Samiria National Reserve. The image shows the digitized logging roads (red, left panel), and non-digitized satellite image (right panel). The arrows provide reference points between panels.

Case 3. Data: MAAP, ESA, IBC, SERFOR. Click to enlarge.


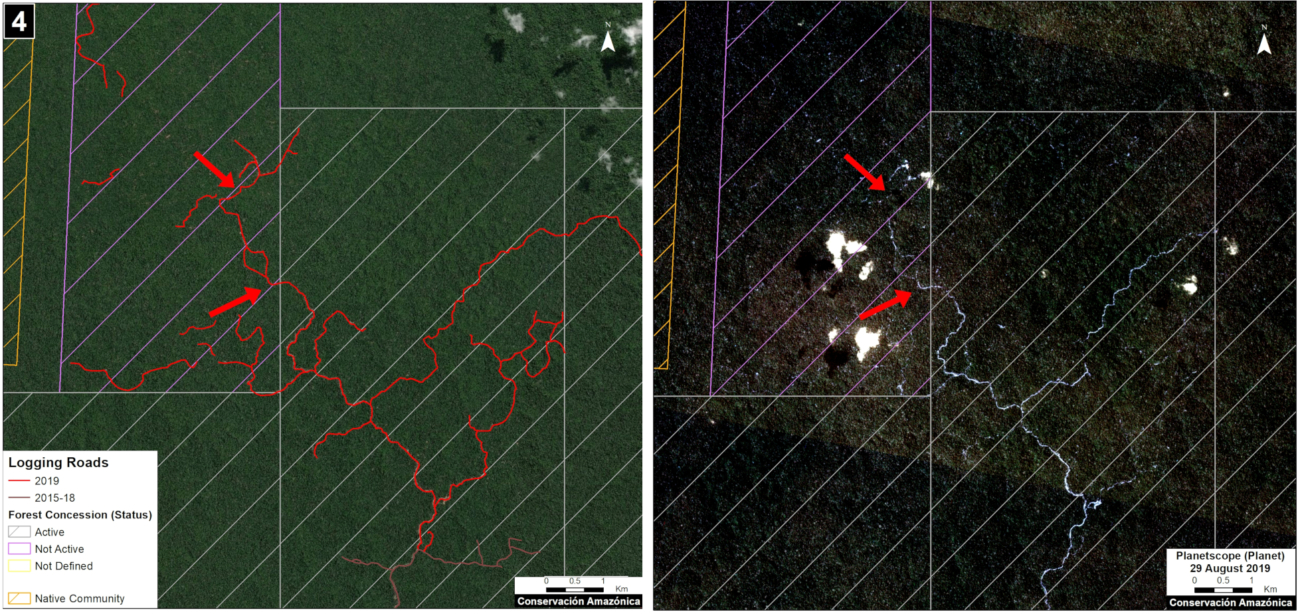
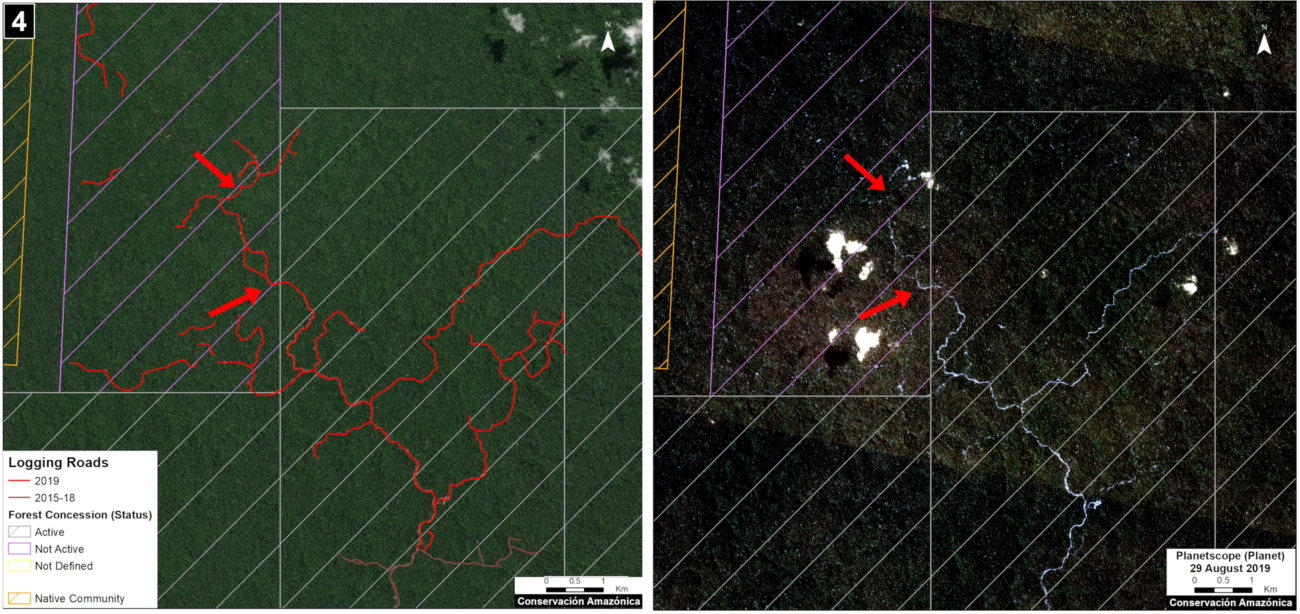
Case 4. We detected the construction of a new logging road network (53.2 km), of which nearly half (21.4 km) crosses a forest concession whose status is defined is “Non Active”, near the town of Sepahua in the Ucayali region. The image shows the digitized logging roads (red, left panel), and non-digitized satellite image (right panel). The arrows provide reference points between panels.

Case 4. Data: MAAP, Planet, IBC, SERFOR. Click to enlarge.


Case 5. We detected the construction of a new logging road (17.7 km) in a forestry concession whose current status is defined as “Non Active,” in the Madre de Dios region. The image shows the digitized logging roads (red, left panel), and non-digitized satellite image (right panel). The arrows provide reference points between panels.

Case 5. Data: MAAP, ESA, IBC, SERFOR. Click to enlarge.


Logging roads in Native Communities

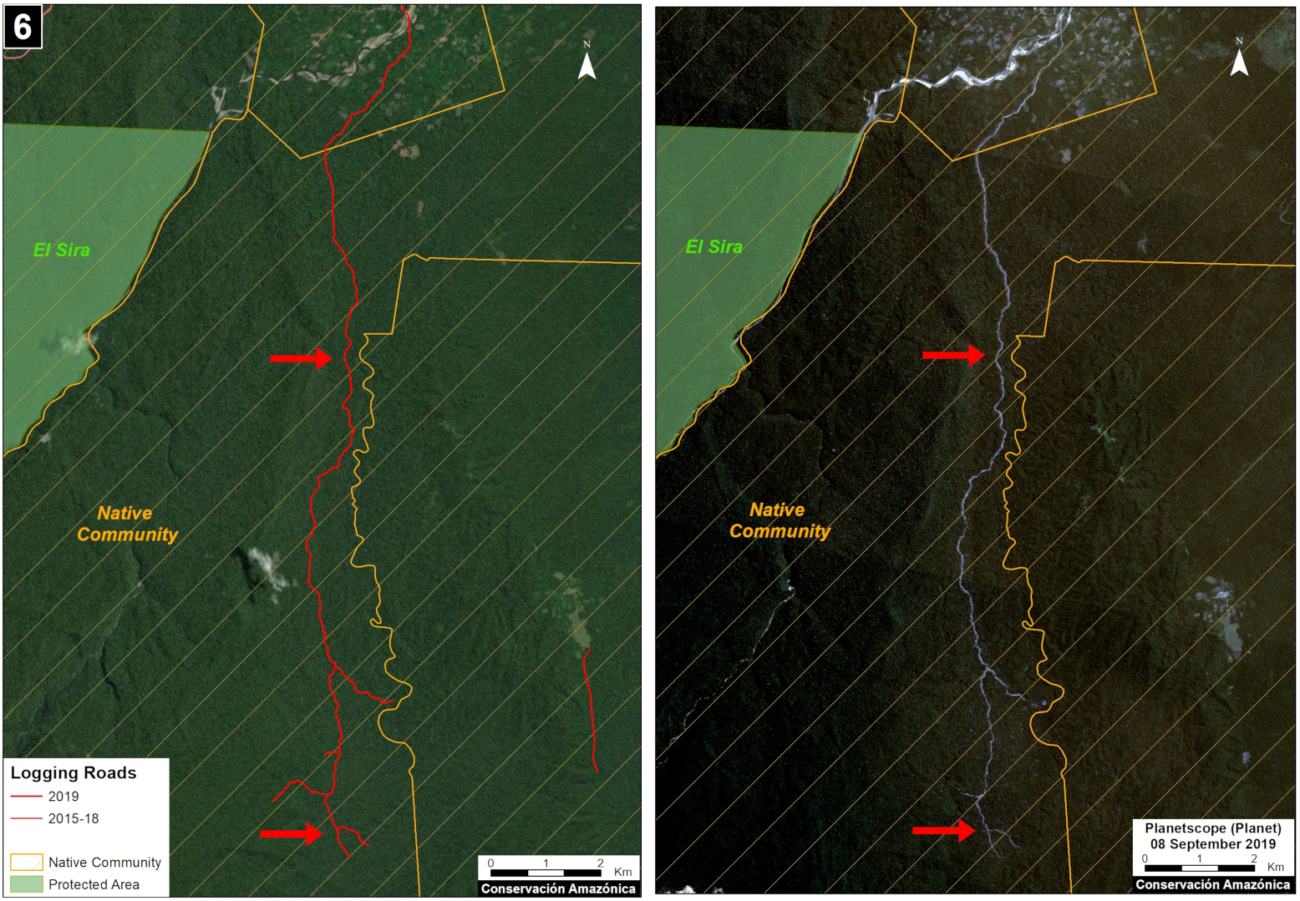
Case 6. We detected the construction of a logging road (23.4 km) within an indigenous community in the Ucayali region. We did not find evidence of a permit for this activity. The image shows the digitized logging roads (red, left panel), and non-digitized satellite image (right panel). The arrows provide reference points between panels.

Case 6. Data: MAAP, Planet, SERNANP, IBC, SERFOR. Click to enlarge.


Methodology

Our analysis included two main steps:

The first step consisted of evaluating linear patterns in the 2019 early warning and final forest loss data, available from Global Forest Watch (data from the University of Maryland) and Geobosques (data from the Peruvian Ministry of the Environment). From the linear patterns, we distinguished between logging access roads and other types of roads and highways. Logging roads tend to have linear patterns that branch into the interior of the forest where the commercial timber is found. Other types of roads have a more defined destination, such as towns or farms. Once logging roads were identified, we downloaded the associated high-resolution imagery (3 meters) from Planet Explorer and digitized the roads in ArcGIS. During this process, additional logging roads detected in the high resolution images were also digitized.

The second step focused on the legality analysis. The new logging road data were overlaid with other types of land use information, such as forestry concessions on the GeoSERFOR portal (SERFOR), permits and concessions on the SISFOR portal (OSINFOR), indigenous communities (IBC 2019), protected areas (SERNANP), population centers (INEI 2019), and official road networks (MTC 2018). For example, as shown above, this process identified logging roads near protected areas, within indigenous communities, and within non-active forest concessions.

We analyzed information on several websites now available from national and regional authorities, such as SISFOR (OSINFOR), GEOSERFOR (SERFOR), and IDERs (Spatial Data Infrastructure of Regional governments). These new resources provide valuable information, however may have limitations in ability to constantly update information on the status of concessions and forest permits, especially from regional governments.


References

Planet Team (2017). Planet Application Program Interface: In Space for Life on Earth. San Francisco, CA. https://api.planet.com


Acknowledgments

We thank R. Valle (OSINFOR), A. Felix (DAI), D. Suarez (ACCA), and G. Palacios for their helpful comments on this report.

This report was conducted with technical assistance from USAID, via the Prevent project. Prevent is an initiative that, over the next 5 years, will work with the Government of Peru, civil society, and the private sector to prevent and combat environmental crimes in Loreto, Ucayali and Madre de Dios, in order to conserve the Peruvian Amazon.

This publication is made possible with the support of the American people through USAID. Its content is the sole responsibility of the authors and does not necessarily reflect the views of USAID or the US government.

Citation

Finer M, Paz L, Novoa S, Villa L (2020) Detecting Illegal Logging in the Peruvian Amazon. MAAP: 123.

MAAP #99: Detecting Illegal Logging In The Peruvian Amazon

New logging road in the Peruvian Amazon. Data: Planet.

In the Peruvian Amazon, most of the logging is selective (not clearcutting), with the targets being higher-value species. Thus, illegal logging is difficult to detect with satellite imagery.

In MAAP #85, however, we presented the potential of satellite imagery in identifying logging roads, which are one of the main indicators of logging activity in the remote Amazon.

Here, we go a step further and show how to combine logging road data with additional land use data, such as forestry licenses and concessions, to identify possible illegal logging.

This analysis, based in the Peruvian Amazon, has two parts. First, we identify the construction of new logging roads in 2018, updating our previous dataset from 2015-17 (see Base Map).

Second, we analyze these new logging roads in relation to addition spatial information now available on government web portals,* in order to identify possible illegality.

*We analyzed information on several websites now available from national and regional authorities, such as SISFOR (OSINFOR), GEOSERFOR (SERFOR), and IDERs (Spatial Data Infrastructure of Regional governments). These new resources provide valuable information, however, may have limitations in ability to constantly update information on the status of concessions and forest permits.

MAAP #94: Detecting Logging in The Peruvian Amazon With High Resolution Imagery

In MAAP # 85, we showed how medium and high-resolution satellites (such as Landsat, Planet and Sentinel-1) could be used to monitor the construction of logging roads in near-real time.

Base Map. Logging Activities. Source: ACCA/ACA.

Here, we show the potential of very high-resolution satellites (such as DigitalGlobe and Planet’s Skysat), to identify the activities associated with logging, including illegal logging.

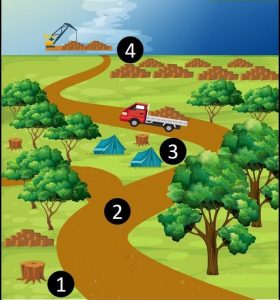
These activities include (see Base Map):
1. Selective logging of high-value trees,
2. Construction of logging roads (access roads),
3. Logging camps
4. Storage and transport

Next, we show a series of very high-resolution images (>50 centimeters), which allow clear identification of these activities.

Note that we show images of both possible legal logging in authorized areas (Images 1,2,5,6,7,9,10) and confirmed illegal logging in unauthorized areas (Images 3,4,8,11,12).*

MAAP #91: Introducing Perusat-1, Peru’s New High-Resolution Satellite

In September 2016, Peru’s first satellite, PeruSAT-1, launched. It is Latin America’s most powerful Earth observation satellite, capturing images at a resolution of 0.70 meters.

PeruSat-1. Credit: Airbus DS

The cutting-edge satellite was constructed by Airbus (France) and is now operated by the Peruvian Space Agency, CONIDA.

The organization Amazon Conservation was granted early access to the imagery to boost efforts related to near real-time deforestation monitoring.

Below, we present a series of PeruSAT images that demonstrate their powerful utility in terms of detecting and understanding deforestation in the Peruvian Amazon.

MAAP #85: Illegal Logging in The Peruvian Amazon, And How Satellites Can Help Address It

We propose a new tool to address illegal logging in the Peruvian Amazon: using cutting-edge satellites to monitor logging road construction in near real-time.

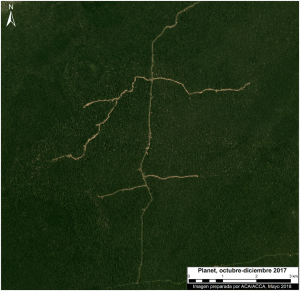
Example of new logging road in the Peruvian Amazon. Data: Planet

Illegal logging in the Amazon is difficult to detect because it is selective logging of individual valuable trees, not large clear-cuts.

However, a new generation of satellites can quickly detect new logging roads, which in turn may indicate the leading edge of illegal logging.

Here, we analyzed satellite imagery to identify all new logging roads built in the Peruvian Amazon over the past three years (2015-17).

We then show how it is possible to track logging road construction in near-real time, using three satellite-based systems: GLAD alerts, Sentinel-1 (radar satellites), and Planet (optical satellites).


MAAP #75: Pope to Visit Madre De Dios, Region With Deforestation Crisis (Peru)

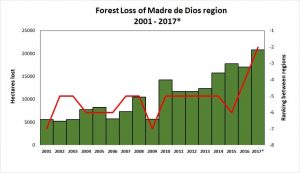
Table 75. Data: PNBC/MINAM (2001-16), UMD/GLAD (2017, until the first week of November).

Pope Francis, as part of his upcoming visit to Peru in January, will visit the Madre de Dios region in the southern Peruvian Amazon. He is expected to address issues facing the Amazon and its indigenous communities, including deforestation.

In this article, we show that Madre de Dios is experiencing a deforestation crisis, due mainly to impacts from gold mining, small-scale agriculture, and roads.

Table 76 shows the increasing trend of annual forest loss since 2001, peaking in 2017. In fact, in 2017 forest loss exceeded 20,000 hectares (49,000 acres) for the first time, doubling the loss in 2008.*

The table also shows the ranking of Madre de Dios in respect to the annual forest loss compared to all other regions of the Peruvian Amazon (see red line). For the first time, Madre de Dios is the region with the second highest forest loss total, behind only Ucayali.

Next, we present a map of deforestation hotspots in Madre de Dios in 2017, along with satellite images of a number of the most intense hotspots.

*The total estimated forest loss in 2017 was based on early warnings alerts generated by the University of Maryland (GLAD alerts) and the Peruvian Environment Ministry (PNCB/MINAM). The estimate is 20,826 hectares as of the first week of November.

MAAP Interactive: Deforestation Drivers In The Andean Amazon

Since its launch in April 2015, MAAP has published over 70 reports related to deforestation (and natural forest loss) in the Andean Amazon. We have thus far focused on Peru, with several reports in Colombia and Brazil as well.

These reports are meant to be case studies of the most important and urgent deforestation events. We often use forest loss alerts (known as GLAD) to guide us, and satellite imagery (from Planet and DigitalGlobe) to identify the deforestation driver.

Here we present an interactive map highlighting the drivers identified in all published MAAP reports. These drivers include gold mining, agriculture (e.g. oil palm and cacao), cattle pasture, roads, and dams (see icon legend below map). We also include natural causes such as floods and blowdowns (fire included under agriculture since most human caused). Furthermore, we highlight deforestation events within protected areas. Note that you can filter by driver by checking boxes of interest.

We hope the result is one of the most detailed and up-todate resources on patterns and drivers of deforestation in the Andean Amazon. Over the coming year we will continue to focus on Peru and Colombia, and begin to include Ecuador and Bolivia as well.

To view the interactive map, please visit:

MAAP Interactive: Deforestation Drivers in the Andean Amazon
https://maaproject.org/interactive/

For more information on patterns and drivers of deforestation in the Peruvian Amazon, see our latest News and Resources 

MAAP #68: 2017 Deforestation Hotspots in The Peruvian Amazon (Part 2)

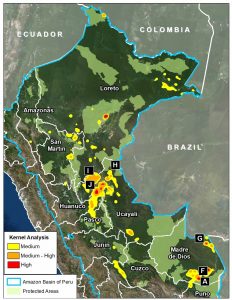
Image 68. Base map. Data: PNCB/MINAM, UMD/GLAD, SERNANP.

In a previous report, MAAP #65, we presented information about deforestation hotspots in 2017 in the Peruvian Amazon, based on early warning alert data from January until mid-July.

Between July and August, the amount of alerts greatly increased, likely due to arrival of the dry season. Thus, this report includes new updated data until mid-August.*

We find new deforestation hotspots in the regions of Madre de Dios and Ucayali (see base map).** At the national level, we now estimate the forest loss of 111,200 acres (45,000 hectares) thus far in 2017 (thru August 17).***

Below, we present satellite imagery of the following hotspots:

– La Pampa, Madre de Dios (Inset A)
– Guacamayo, Madre de Dios (Inset F)
– Iberia, Madre de Dios (Inset G)
– South of Sierra del Divisor, Ucayali (Inset H)
– Nueva Requena, Ucayali (Inset I)

**The data were generated by the National Program of Forest Conservation for Climate Change Mitigation, Peruvian Ministry of Environment (PNCB/MINAM).

**See Hotspots A-E in MAAP #65

***We emphasize that our calculations are just estimates. Official forest loss data are produced annually by the Peruvian Ministry of Environment.

MAAP #59: Power Of “Small Satellites” From Planet


The company Planet is pioneering the use of high-resolution “small satellites” (Image 59a). They are a fraction of the size and cost of traditional satellites, making it possible to produce and launch many as a large fleet. Indeed, Planet now operates 149 small satellites, known as Doves, the largest fleet in history. The Doves capture color imagery at 3-5 meter resolution, and will line up (like a string of pearls) to cover everywhere on Earth’s land area every day.

Image 59a. Source: Planet

Over the past year, MAAP* has demonstrated the power of Planet imagery to monitor deforestation and degradation in near real-time in the Amazon. A consistent flow of new, high-resolution imagery is needed for this type of work, making Planet’s fleet model ideal. Below, we provide a recap of key MAAP findings based on Planet imagery, for a diverse set of cases including gold mining, agriculture deforestation, logging roads, wildfire, blowdowns, landslides, and floods.**

*MAAP has been fortunate to have access to Planet imagery via the Ambassador program.
**Note: In the images below, the red dot () indicates the same location across time between panels.

MAAP Synthesis #2: Patterns and Drivers of Deforestation in the Peruvian Amazon

We present our second synthesis report, building off our first report published in September 2015. This synthesis is largely based on the 50 MAAP reports published between April 2015 and November 2016. The objective is to synthesize all the information to date regarding deforestation trends, patterns and drivers in the Peruvian Amazon.

MAAP methodology includes 4 major components: Forest loss detection, Prioritize big data, Identify deforestation drivers, and Publish user-friendly reports. See Methodology section below for more details.

Our major findings include:

  • Trends. During the 15 years between 2001 and 2015, around 4,448,000 acres (1,800,000 hectares) of Peruvian Amazon forest has been cleared, with a steadily increasing trend. 2014 had the highest annual forest loss on record (438,775 acres), followed by a slight decrease  in 2015. The preliminary estimate for 2016 indicates that forest loss remains relatively high. The vast majority (80%) of forest loss events in the Peruvian Amazon are small-scale (<5 hectares), while large-scale events (> 50 hectares) pose a latent threat due to new agro-industrial projects.
  • Hotspots. We have identified at least 8 major deforestation hotspots. The most intense hotspots are located in the central Amazon (Huánuco and Ucayali). Other important hotspots are located in Madre de Dios and San Martin. Two protected areas (Tambopata National Reserve and El Sira Communal Reserve) are threatened by these hotspots.
  • Drivers. We present an initial deforestation drivers map for the Peruvian Amazon. Analyzing high-resolution satellite imagery, we have documented six major drivers of deforestation and degradation: small/medium-scale agriculture, large-scale agriculture, cattle pasture, gold mining, illegal coca cultivation, and roads. Small-scale agriculture and cattle pasture are likely the most dominant drivers overall. Gold mining is a major driver in southern Peru. Large-scale agriculture and major new roads are latent threats. Logging roads are likely a major source of forest degradation in central Peru.