MAAP #2: Large-Scale Forest Clearing for Cacao in Tamshiyacu, Peru

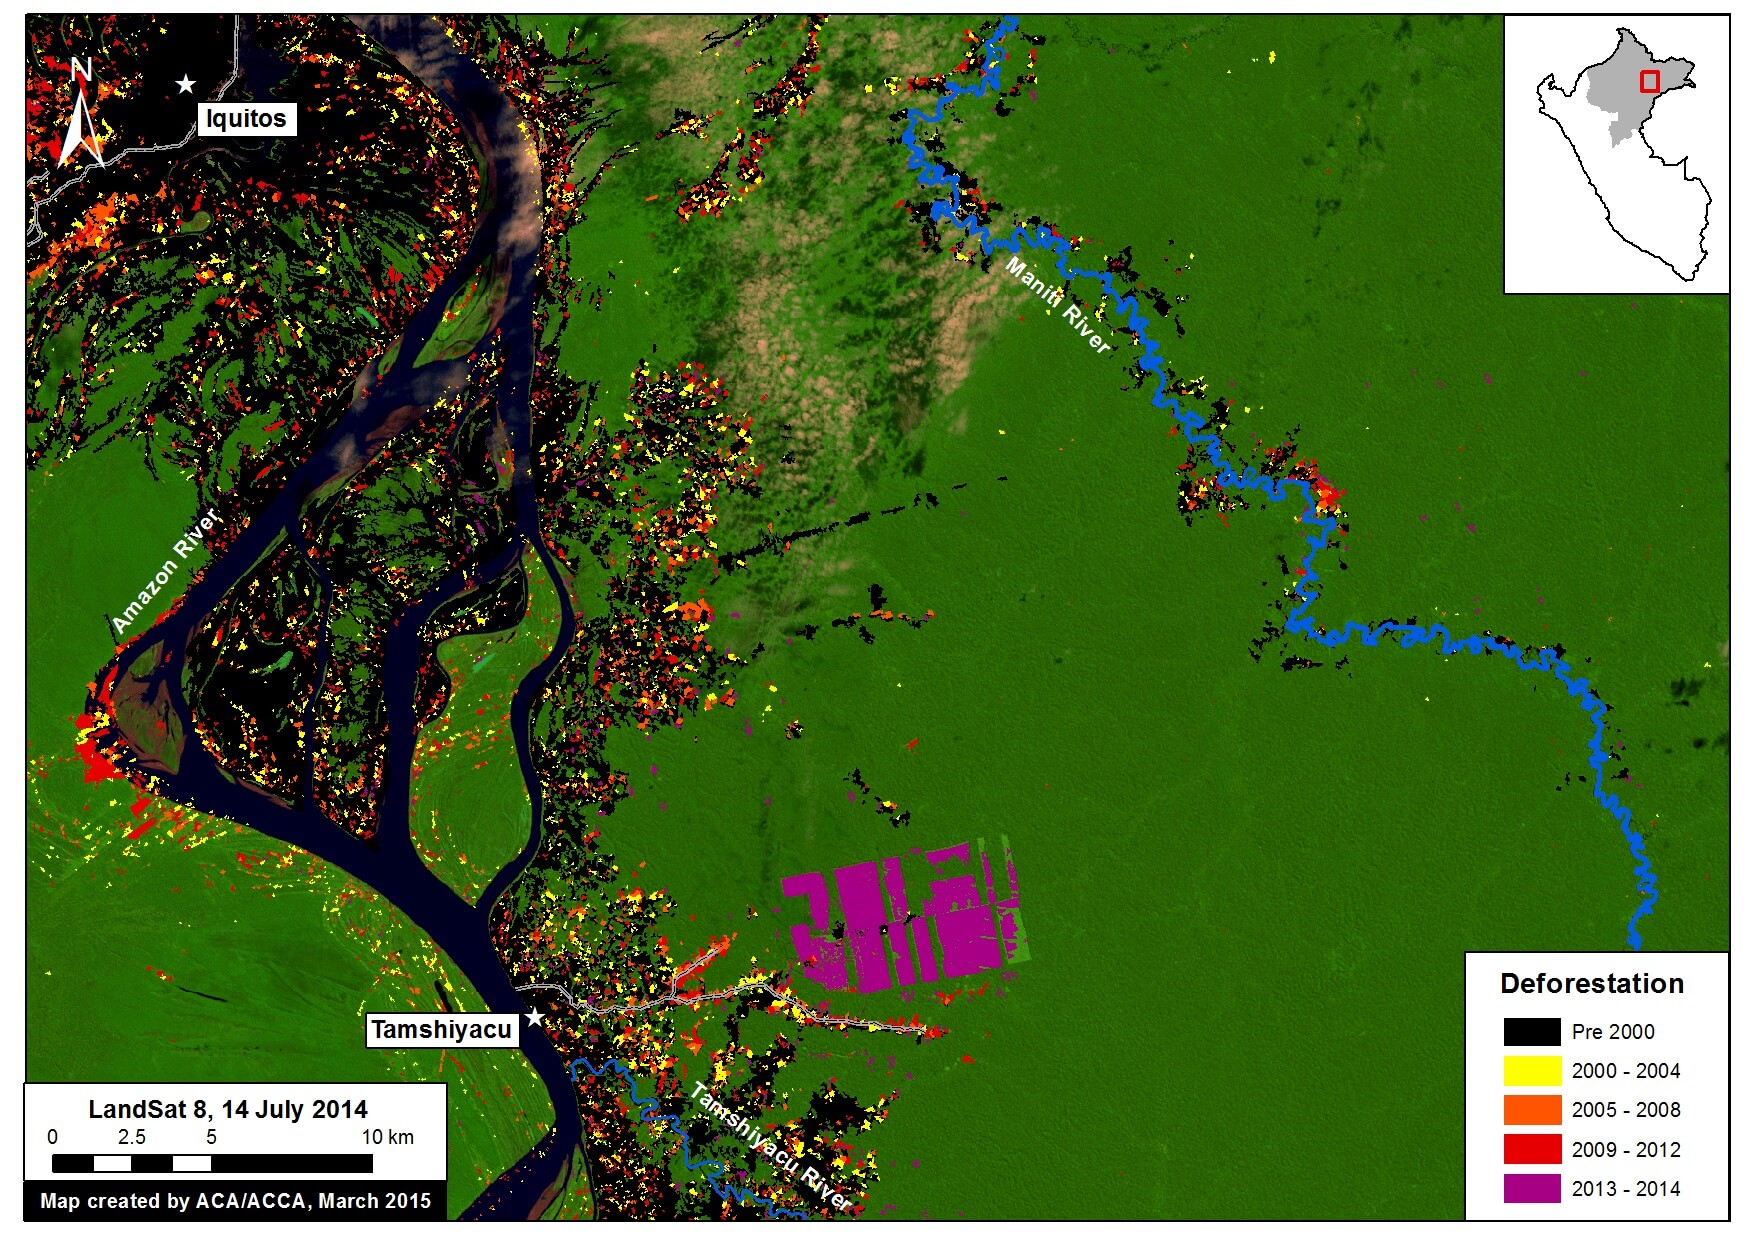
Image of the Week #2 shows the recent and rapid forest clearing for a new cacao project outside of the town of Tamshiyacu in the northern Peruvian Amazon (Department of Loreto). Specifically, we found that over 2,100 hectares (ha) were cleared between May 2013 and August 2014 in an area known as Fundo Tamshiyacu.

Image of the Week 2a. Rapid clearing for large-scale agriculture in Tamshiyacu (Loreto, Peru). Key data sources: MINAM, Hansen/UMD/Google/USGS/NASA, USGS.


Map Description

Background map is a Landsat 8 image (30 m resolution) from July 14, 2014. Green indicates forest cover. Note there is some cloud cover. Data is from USGS.

Black indicates areas that were cleared as of 2000 according to data from the Peruvian Environment Ministry (MINAM 2009). Yellow, orange, and red indicate areas that were cleared from 2000 to 2012 (each color covers a four year period) (Hansen MC et al. 2013 Science 342: 850–53; Data download).

Purple indicates areas that were cleared in 2013 and 2014 based on our analysis of Landsat imagery using CLASlite forest monitoring software. Using CLASlite, we found that 2,126 ha were cleared between May 2013 and August 2014 in the cacao project area known as Fundo Tamshiyacu. That is the equivalent to 2,900 soccer fields.

See this article published on mongabay.com for more information on the company that carried out the forest clearing (United Cacao, through its subsidiary in Peru, Cacao del Peru Norte). See this article, also published on mongabay, for more information on the legality of the forest clearing.

Landsat Time-series


Image 2b. Results of Landsat time series analysis, December 2012 – August 2014. Key sources: USGS.

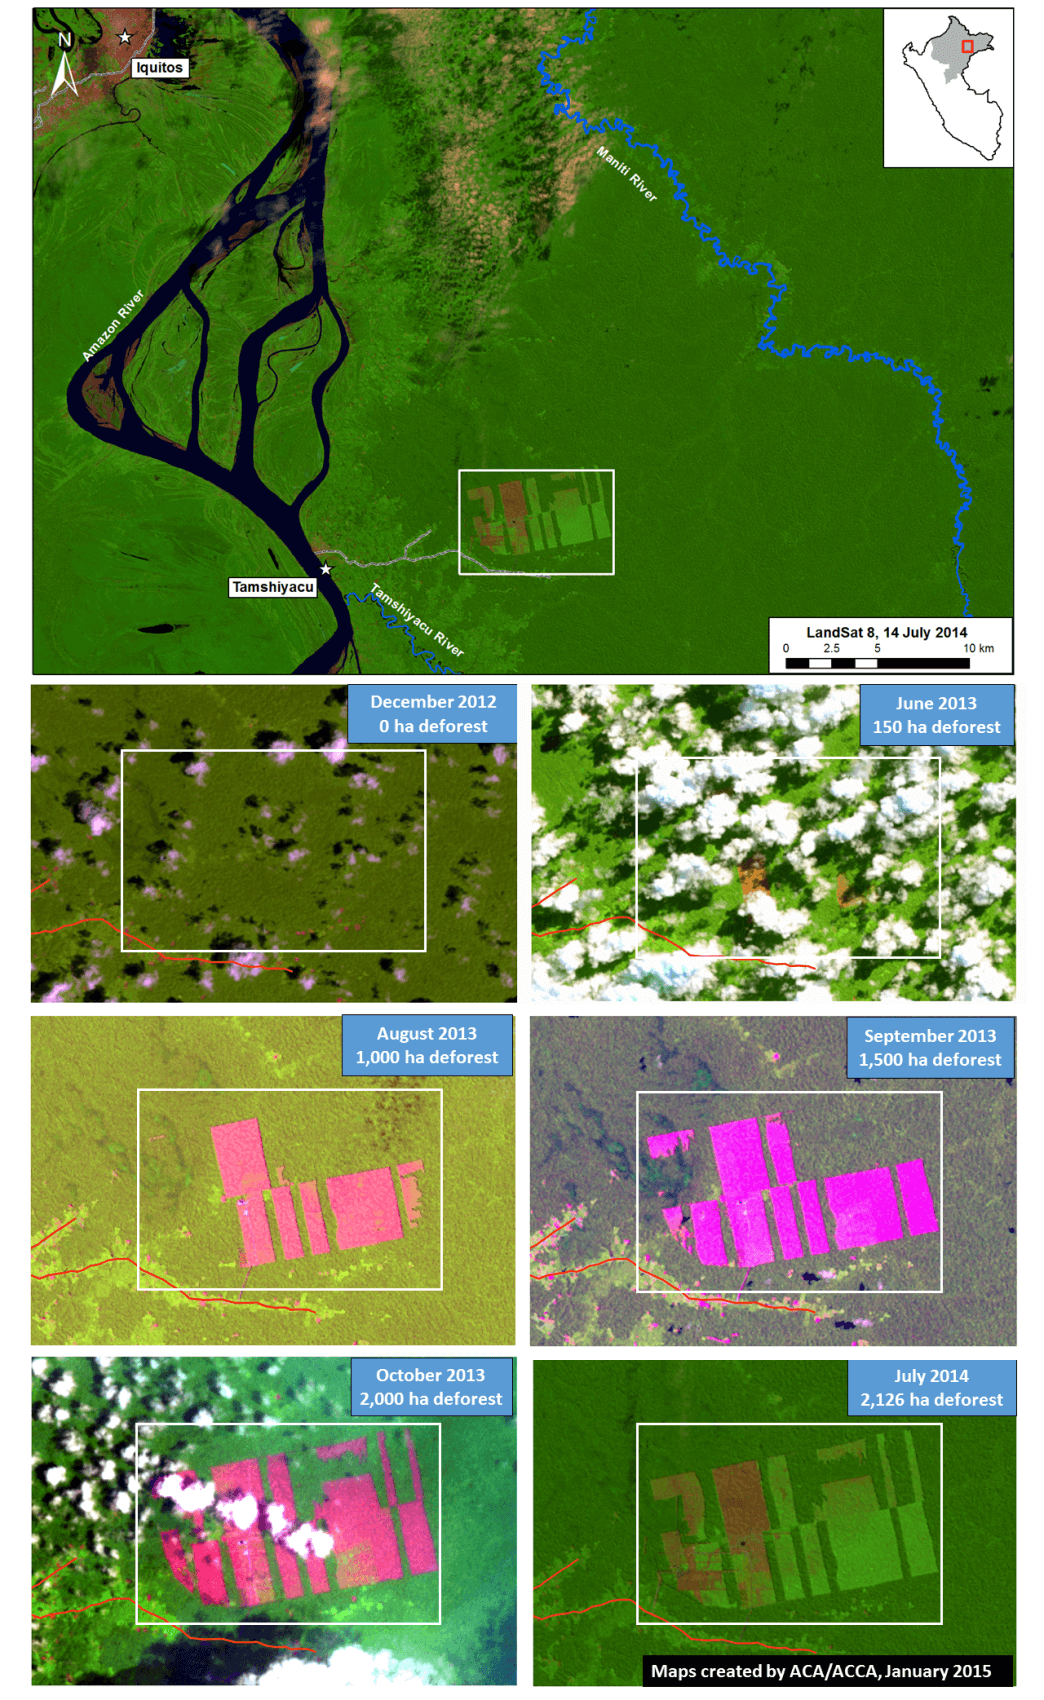
Image 2b is a series of Landsat images (30 meter resolution) of the recently cleared area that illustrates how the forest clearing unfolded.

In December 2012, the area was predominantly covered by closed-canopy forest.

In June 2013, although the image is cloudy, we detected the first signs of major forest clearing (about 150 ha).

In August 2013, a cloud-free image clearly revealed that forest clearing jumped to 1,000 ha.

Subsequent images in September and October 2013 revealed that forest clearing continued to 1,500 ha and 2,000 ha, respectively.

During the peak clearing between June and September 2013, the clearing rate was approximately 100 ha per week.

The forest clearing halted between November 2013 and June 2014, but in July 2014 we detected some new clearing. This additional clearing in 2014 raised the total cleared area to 2,126 ha.

Cutting Primary Forest


Image 2c. Tamshiyacu Landsat time series, 1989 – 2013. See text for definition of primary forest. Key sources: USGS.

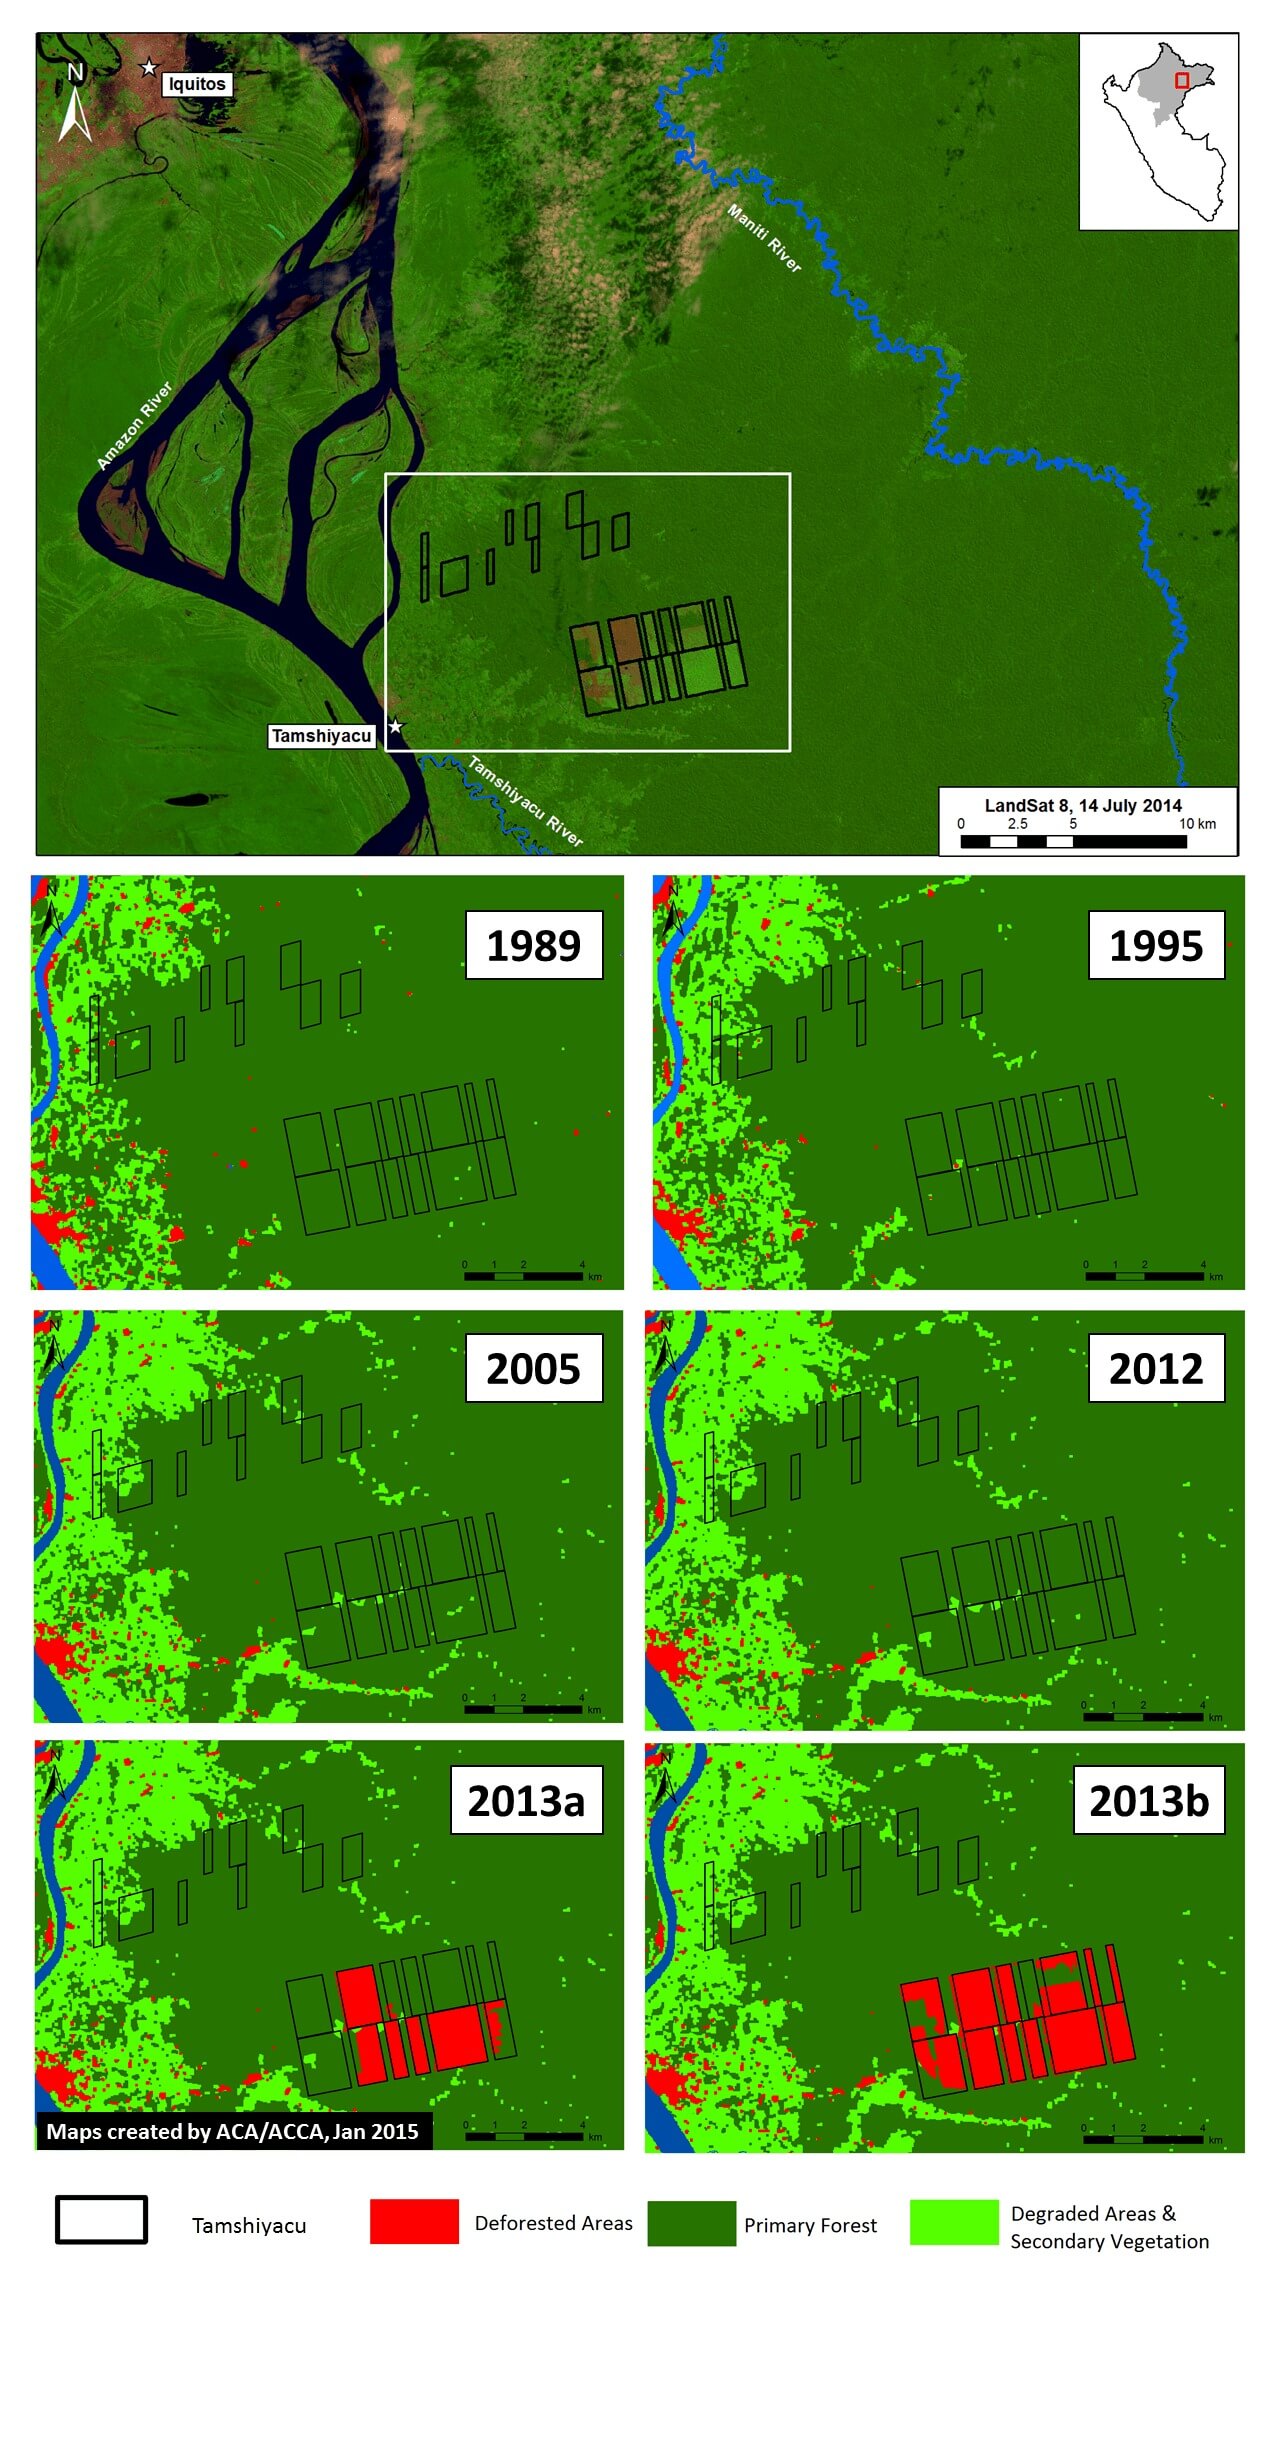
Image 2c shows the results of our analysis of another series of Landsat images of the recently cleared area that go further back in time, until 1985. We conducted this analysis to determine whether the clearing described above came at the expense of primary forest.

We defined primary forest as an area that from the earliest available Landsat (in this case an image from 1985) was characterized by dense closed canopy coverage and having a similar spectral signature (NDVI) as areas in remote areas of the Amazon known to be undisturbed.

Using this methodology, we found that nearly 98% of the recently cleared area in Tamshiyacu was primary forest at the start clearing around May 2013.

Much More Forest Clearing to Come?

Image 2d. Rapid clearing for large-scale agriculture in Tamshiyacu (Loreto, Peru). Key sources: MINAM, Hansen/UMD/Google/USGS/NASA, GOREL, USGS.

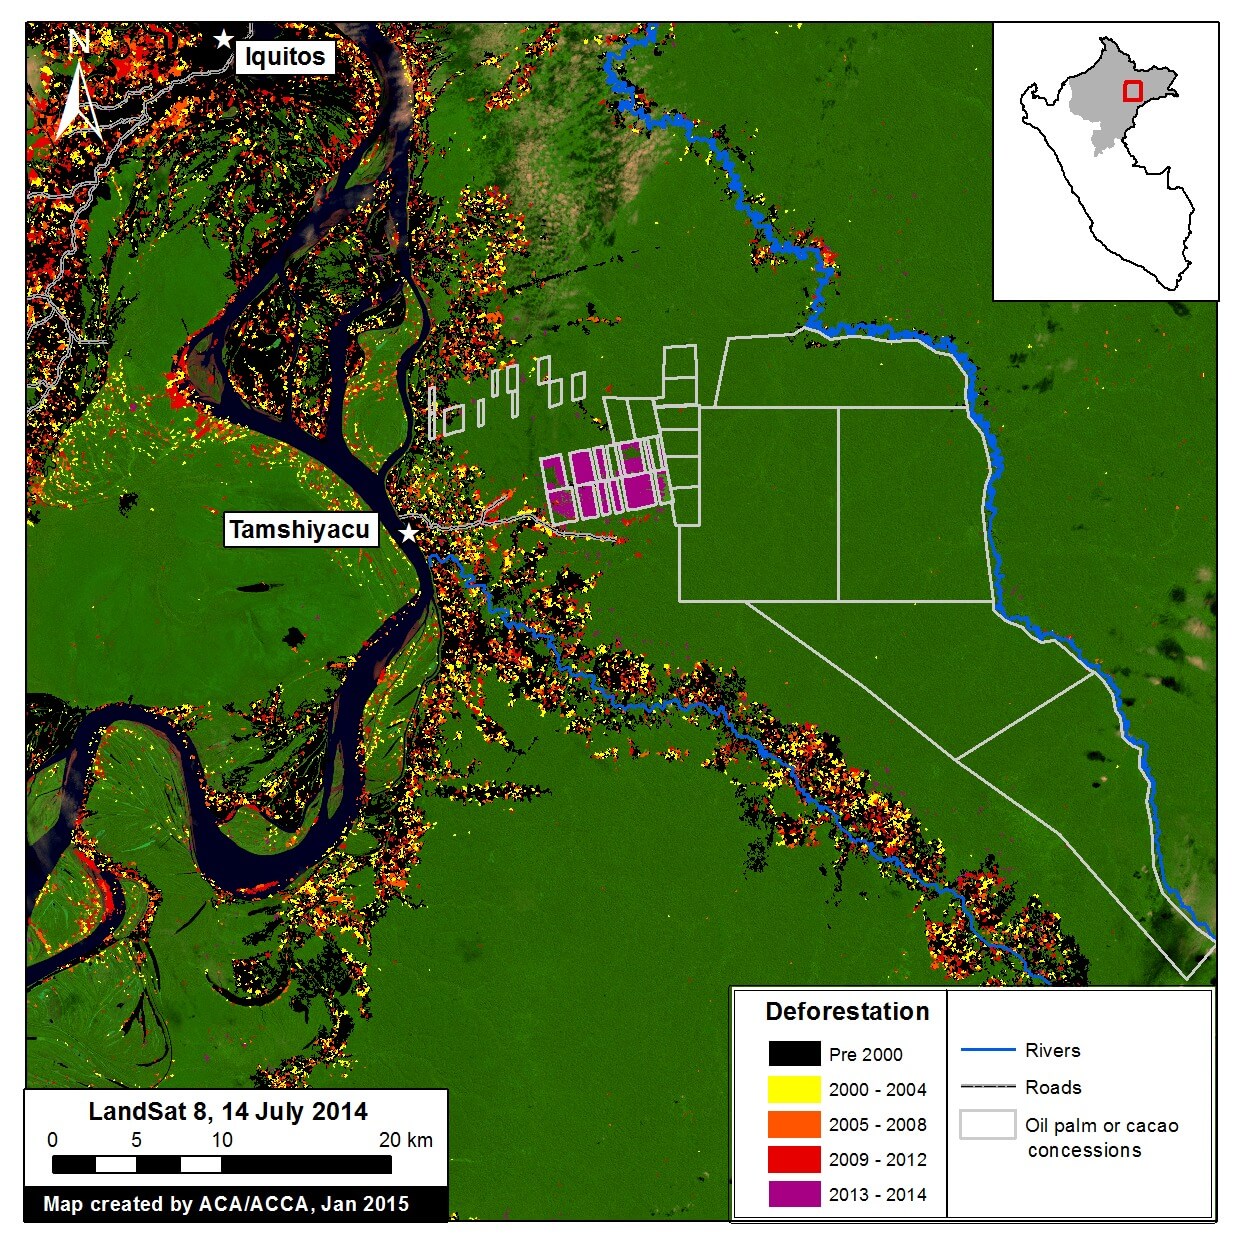
Image 2d includes spatial information on proposed cacao and oil palm projects in the Tamshiyacu area (indicated by grey lines). This data was obtained from the Regional Government of Loreto (GOREL). The total area for proposed cacao and oil palm projects around Tamshiyacu is greater than 50,000 ha.

Image 2e. Landsat time series (1989 – 2012) for Pacific Plantation. See text for definition of primary forest. Key sources: USGS, GOREL.

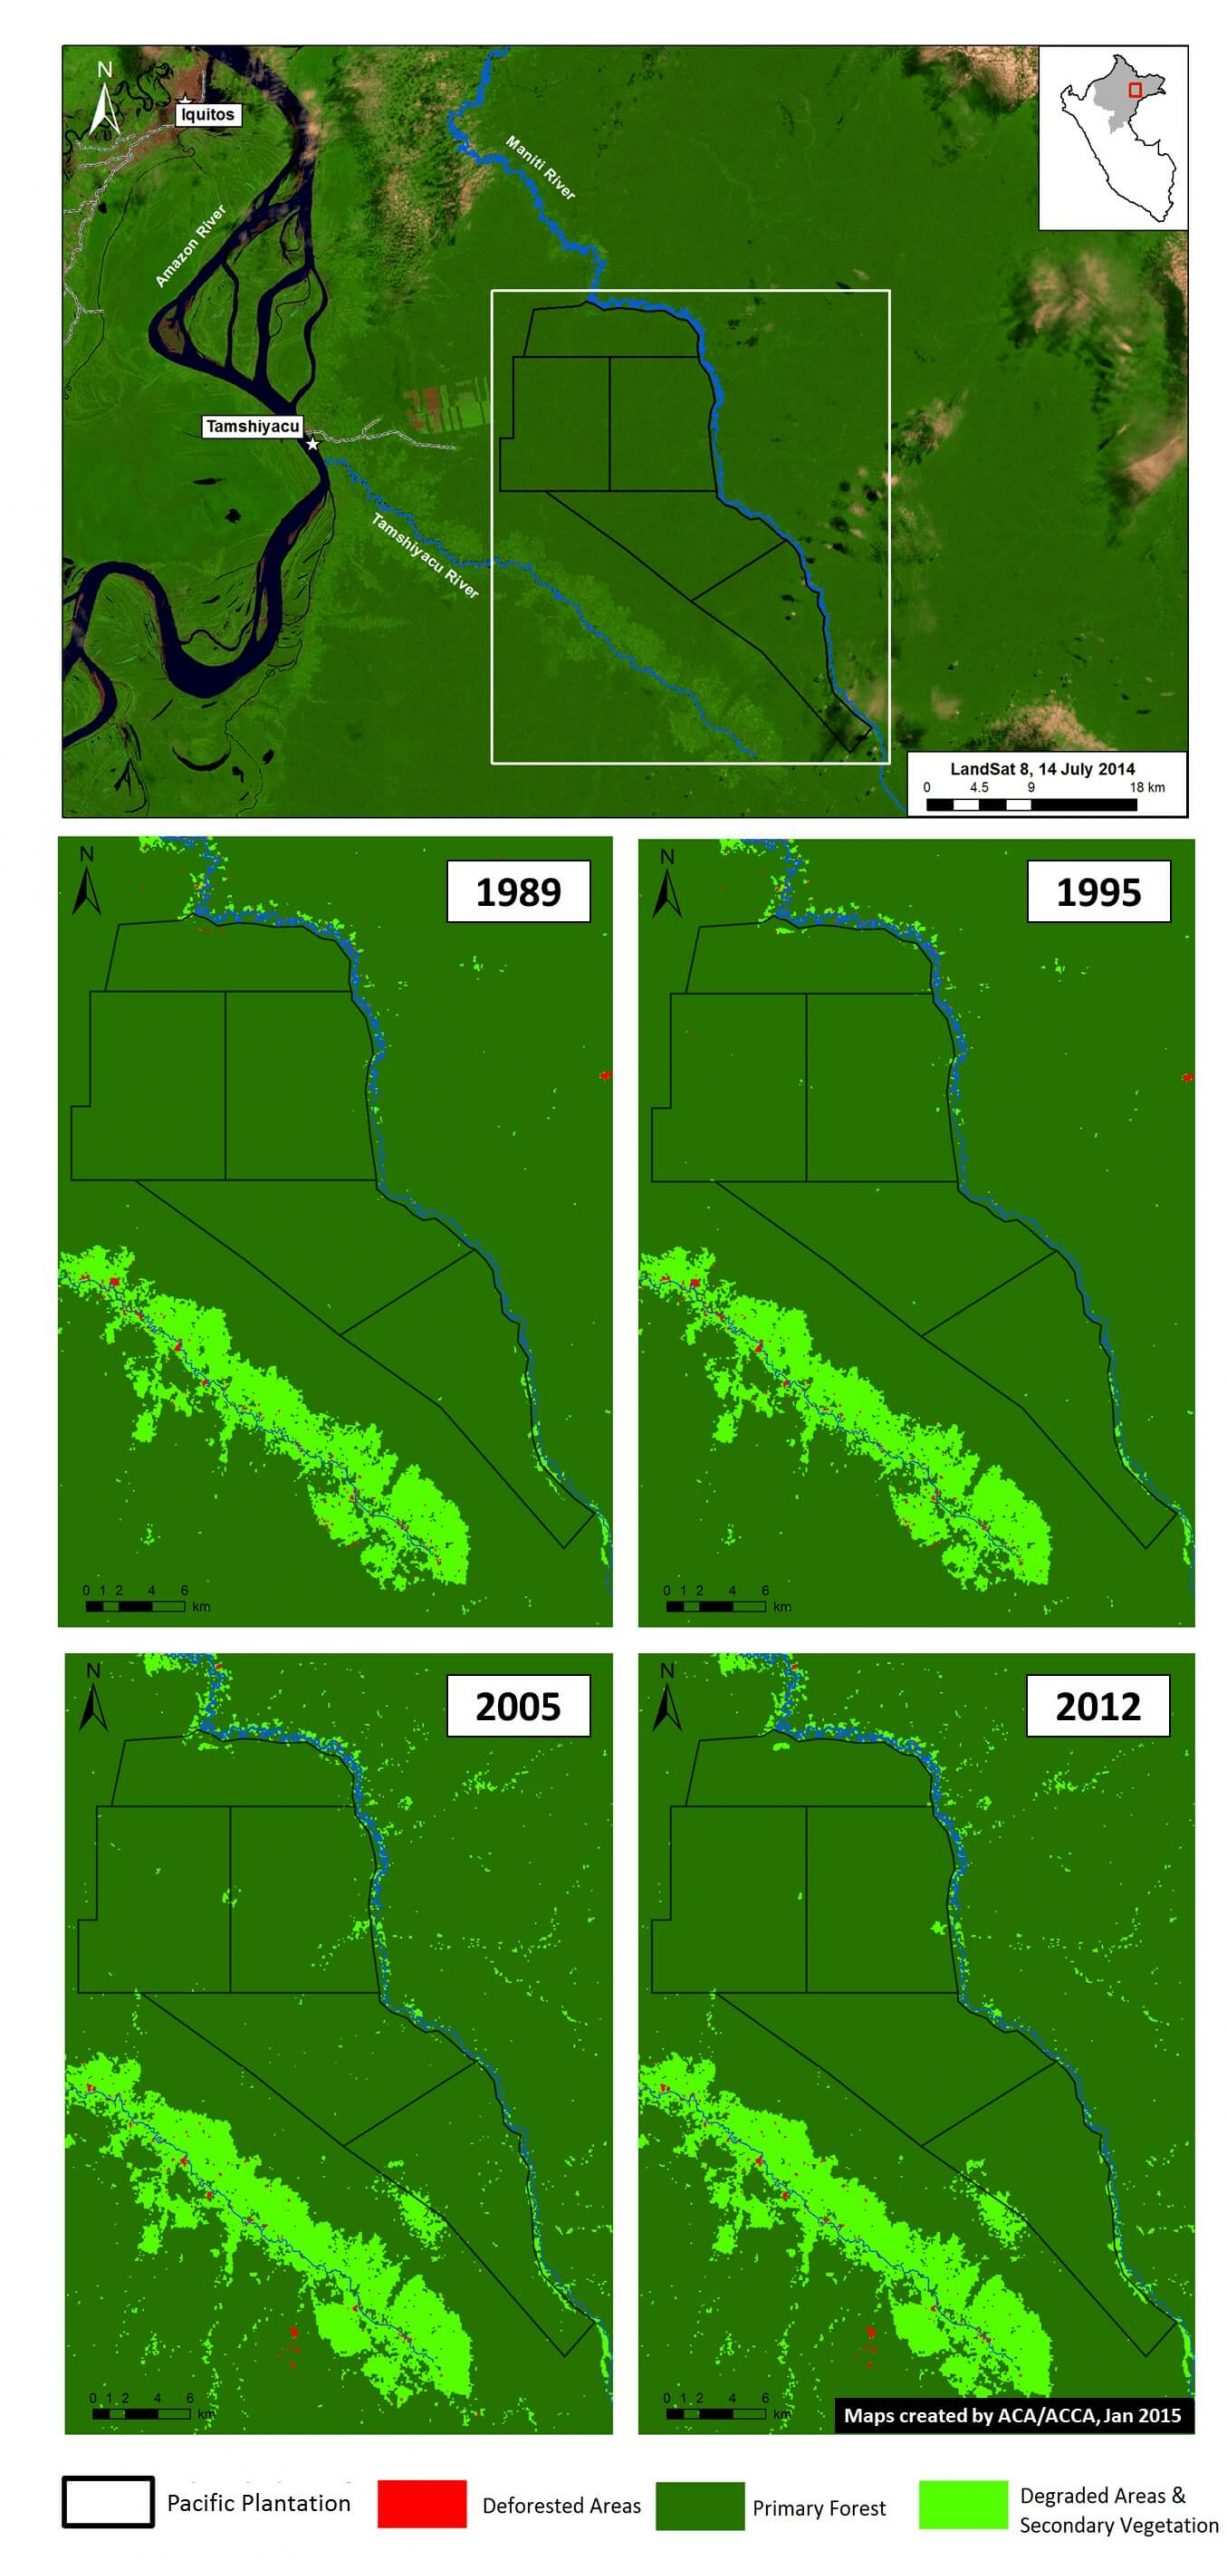
We conducted a Landsat time-series analysis for the proposed oil palm projects noted above. We refer to these proposed projects as Pacific Plantation because this is how they are labelled in the information obtained from GOREL. As seen in Image 2e, our analysis indicates that 99.3% of the Pacific Plantation project area, or 44,685 ha, is primary forest.


Citation

Finer M, Novoa S (2015) Large-scale Forest Clearing for Cacao and Oil Palm in Tamshiyacu, Peru. MAAP: Image #2. Link: https://maaproject.org/2015/03/image-3-rapid-clearing-for-large-scale-agriculture-in-tamshiyacu-_/


Image #1: Gold Mining Deforestation Continues To Expand In La Pampa (Madre De Dios, Peru)

Image of the Week #1 highlights that gold mining deforestation continues to expand in the southern Peruvian Amazon (Department of Madre de Dios). Most notably, the image illustrates that much of the most recent (2013 – 2015) deforestation occured a) in an area known as La Pampa, b) outside of the legal mining corridor, and c) within the buffer zone of the Tambopata National Reserve.


Image of the Week 1a. Deforestation in the mining corridor of Madre de Dios in the southern Peruvian Amazon from 2000 – 2015. Key data sources: MINAM, SERNANP, ACCA, Hansen/UMD/Google/USGS/NASA, USGS


Map Description:

Background map is a Landsat 8 image (30 m resolution) from February 2, 2015. Green indicates forest cover. Note there is some cloud cover. Data is from USGS.

Black indicates areas that were deforested as of 2000 according to data from the Peruvian Environment Ministry (MINAM 2009). Yellow, orange, and red indicate areas that were deforested from 2000 to 2012 (each color covers a four year period) (Hansen MC et al. 2013 Science 342: 850–53; Data download).

Purple indicates areas that were deforested between January 2013 and February 2015 based on our analysis of Landsat imagery using CLASlite forest monitoring software.

Data for secondary roads is from Conservación Amazónica-ACCA.

The mining corridor indicates the zone that the Peruvian Government has delimited as potentially legal for mining activities, but only if miners successfully complete a multi-step formalization process for each project. Data is from ACCA.

Protected areas data is from SERNANP. Dark green indicates established protected areas and light green indicates their buffer zones.

The majority of the forest loss shown on the map is associated with gold mining activity, although some is also associated with the recently paved Interoceanic Highway and its growing secondary roads network.

According to a recent study published in PNAS by Greg Asner et al., the gold mining deforestation in this region increased from 10,000 ha in 2000 to 50,000 hectares (ha) in 2012. This deforestation was concentrated in two primary areas: Huepetuhe/Delta-1 and Guacamayo (A and B on the map, respectively).

More recently, the deforestation has largely shifted to La Pampa (C on the map). This shift is particularly important because La Pampa is within the buffer zone of the Tambopata National Reserve and outside of the designated mining corridor. Using CLASlite, we detected 1,711 ha of deforestation in La Pampa between 2013 and 2015.


Zoom View of La Pampa

Image 1b. Zoom view of La Pampa mining zone within the buffer zone of the Tambopata National Reserve. Key data sources: MINAM, SERNANP, Hansen/UMD/Google/USGS/NASA, ACCA, USGS

Image 2b is a zoom view of the La Pampa area provided to better illustrate the most recent deforestation within the Tambopata National Reserve buffer zone. As noted above, using CLASlite we detected 1,711 ha of deforestation within the La Pampa area between 2013 and 2015. That is the equivalent to more than 2,300 soccer fields.

Note that much of the most recent deforestation is within 6 km of the Tambopata National Reserve.


Near Real-time Monitoring

Image 1c. Near real-time deforestation monitoring in La Pampa. Key data sources: SERNANP, USGS, ACCA

Thanks to a series of relatively cloud-free Landsat images, we were able to conduct near real-time analysis with CLASlite during 2014 and 2015.

For example, we found that between mid-October 2014 and early February 2015 (about four months) there was deforestation of 226.5 ha in La Pampa within the buffer zone of the Tambopata National Reserve. That is the equivalent to 310 soccer fields, a rate of over 2.5 fields a day.

Prior to that time period, we found that between mid-August and mid-October 2014 (abount nine weeks), there was deforestation of 431 ha in La Pampa.


Citation

Finer M, Novoa S (2015) Gold Mining Deforestation Continues to Expand in La Pampa (Madre de Dios, Peru). MAAP: Image #1. Link: https://maaproject.org/2015/03/gold-mining-deforestation-expand-peruvian-amazon/