Mining News Watch #17

Mining News Watch #17 covers the time period June 10- July 30, 2015

Top Stories 

  • On July 13th, the Peruvian police carried out a major raid in the La Pampa mining zone (Madre de Dios), the first major government operation against illegal mining in eight months.
  • Following the raid, the regional President of Madre de Dios, Luis Otsuka, complained of the inefficiency of the formalization process in Madre de Dios, and how it is damaging the region’s economy.
  • Technical reports released by the Amazon Conservation Association (ACA) and the Conservación Amazónica (ACCA) has found growing deforestation in the Amarakaeri Communal Reserve and Sierra del Divisor.
  • OjoPublico released an investigative report on the foreign financing of illegal mining in South America, including the foreign businesses that help finance illegal gold mining.

Read Full Article >

MAAP #9: Confirming Forest Clearing for Cacao in Tamshiyacu (Loreto, Peru) Came from Primary Forest

Recall that in Image #2 we documented the rapid clearing of 2,126 hectares of primary forest between May 2013 and August 2014 for a new cacao project outside of the town of Tamshiyacu in the northern Peruvian Amazon (Department of Loreto).

However, the company that carried out the forest clearing (United Cacao, through its wholly-owned subsidiary in Peru, Cacao del Peru Norte) has responded “that this area had been used for farming since the late 1990s, and thus it was not primary forest…There was no high-conservation-value forest on that land (Cannon JC, 2015, mongabay.com).” In addition, the company’s website states that “The site was heavily logged of all tropical hardwoods in the 1980s.”

Here, in Image #9, we 1) publish new high-resolution (33 cm) satellite imagery that shows how the cacao project is expanding into dense, closed-canopy forest and 2) detail exactly how we determined that the vast majority of the clearing indeed came from primary forest. These findings are critically important because the company has major expansion plans.

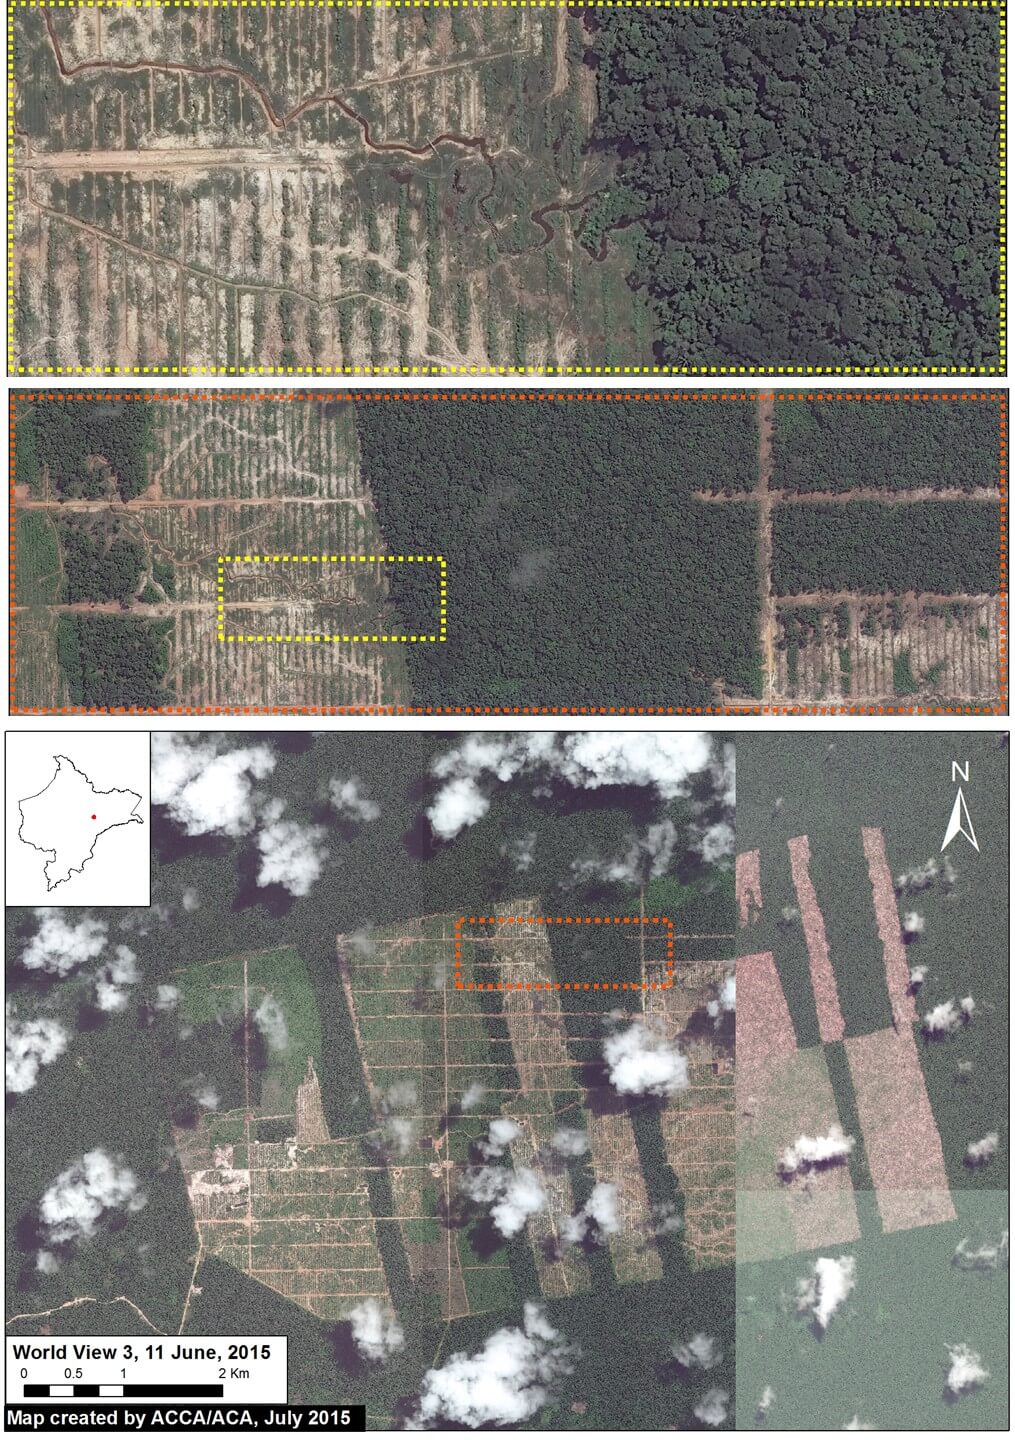
Image of the Week 9a. Mosaic of very high-resolution (33 cm) images of the United Cacao plantation near Tamshiyacu, Peru, in June 2015. Colors indicate insets. Data: WorldView-3 from Digital Globe (NextView).

Key Results:

We obtained very high-resolution (33 cm) satellite imagery taken over the United Cacao plantation in June 2015 (see Image 9a). In this imagery, one can clearly see that the cacao project is embedded and expanding into dense, closed-canopy forest.

We analyzed a series of satellite (Landsat) images dating back to 1985 to determine that, prior to the arrival of United Cacao in 2013, the project area 1) had NOT been used for major farming activities, 2) was NOT heavily logged of all tropical hardwoods, and 3) was dominated (98%) by primary forest (see Image 9b). In fact, by analyzing spectral signatures in the Landsat images, we confirm that the area cleared by United Cacao in 2013 was dominated by primary forest (see Image 9c).

We show data from the Carnegie Airborne Observatory showing that the majority of the United Cacao project area had the highest possible value of carbon (over 150 tons per hectare) immediately prior to the forest clearing in 2013.

Finally, we present information indicating that the current documented forest clearing of 2,126 hectares may soon double or triple.

Landsat Time-series


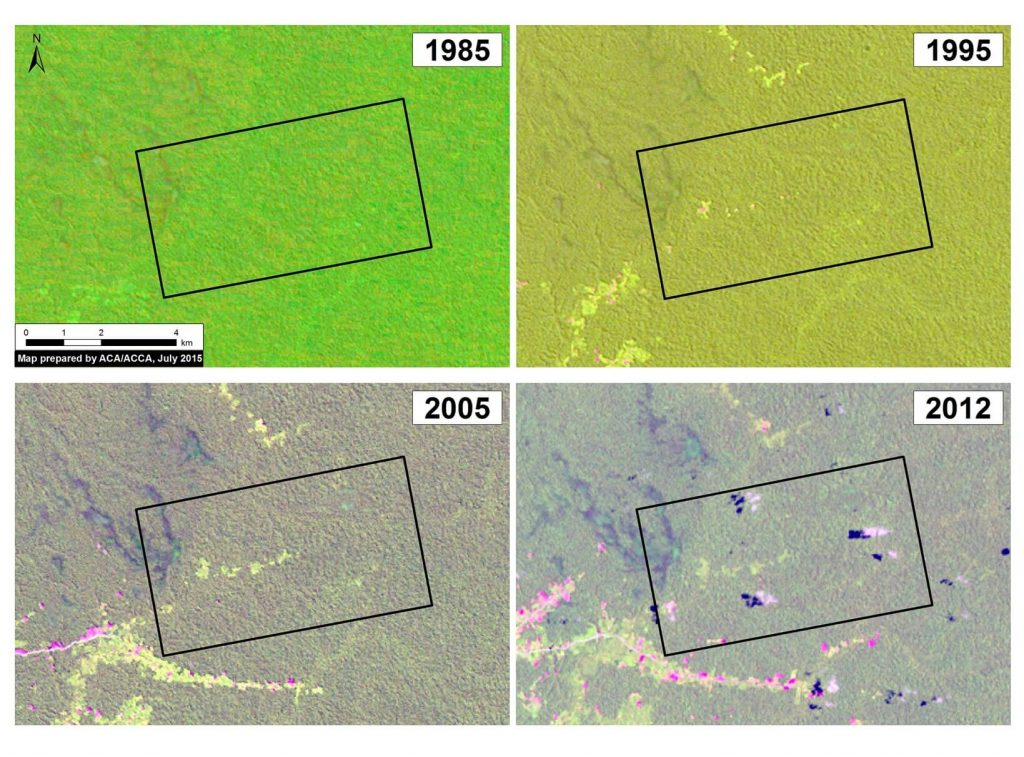
Image 9b. Landsat time-series (1985-2012) of the future United Cacao plantation area (indicated by black box) prior to arrival of the company. Data: USGS

Image 9b displays a series of Landsat images dating back to 1985 showing that, prior to the arrival of United Cacao, the area was dominated (nearly 98%) by primary forest and NOT used for major agriculture activities or heavily logged of all tropical hardwoods.

In these Landsat images, dark green indicates forest cover, light green indicates secondary vegetation, pink indicates exposed ground (and is therefore a key indicator of recent forest clearing), and the scattered white and black spots indicate clouds and their shade.

In 1985, the future cacao project area (indicated by black box) was completely covered by forest with no signs of clearing, major logging, or farming. By 1995, there were a few scattered areas of cleared forest in the center of the future project area. By 2005, there was a slight expansion of these cleared areas in the center of the future project area. By 2012, immediately before the start of forest clearing, the future project area appeared much the same: a few scattered areas of cleared forest in the center, but the vast majority of the area was primary forest.

We defined primary forest as an area that from the earliest available image (in this case, from 1985) was characterized by dense closed-canopy coverage and experienced no major clearing events.

NDVI Analysis


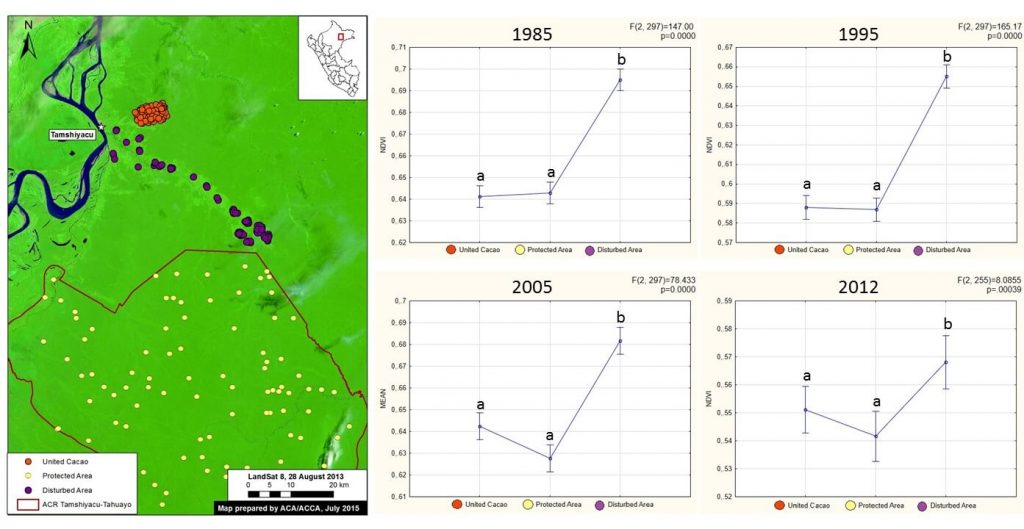
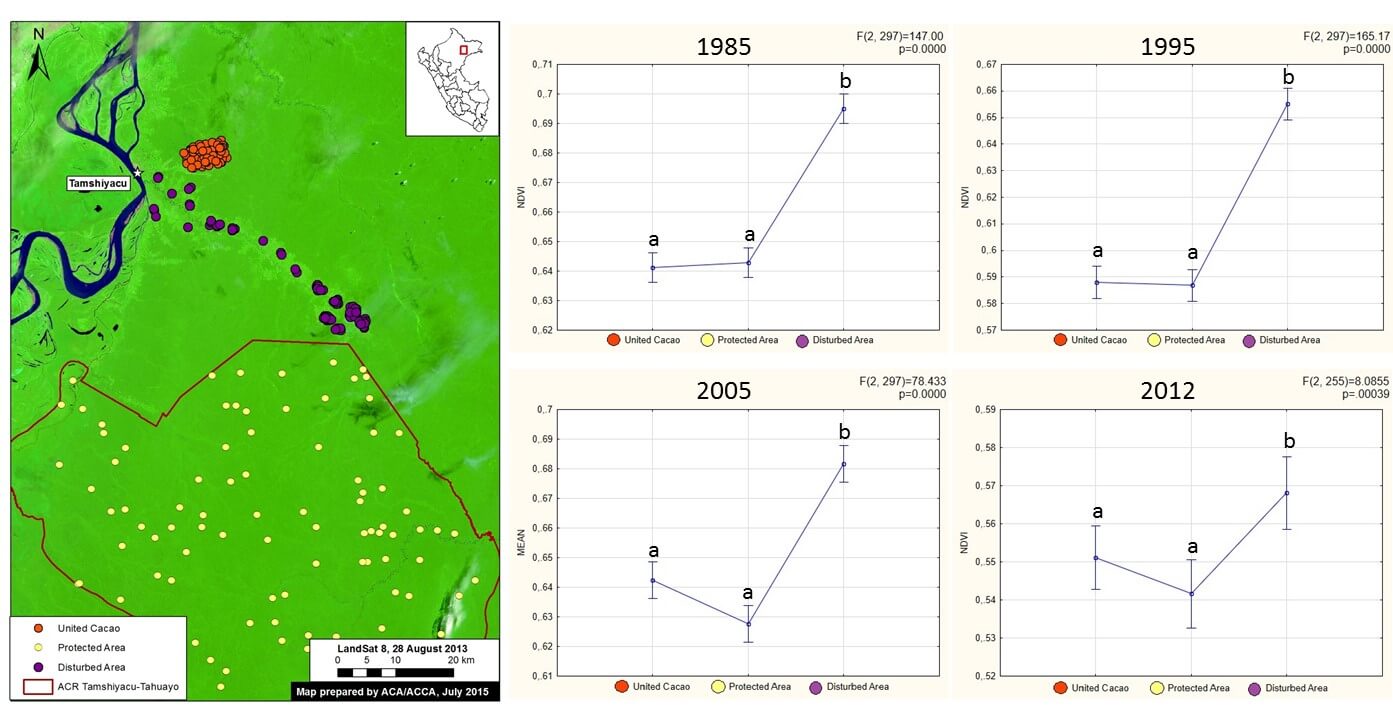
Image 9c. NDVI analysis of the United Cacao plantation area prior to arrival of the company. Letters indicate significance (i.e., “a” values are significantly different than “b” values). Data: USGS.

To further investigate the issue of primary forest, we used the Landsat imagery to conduct an NDVI (Normalized Difference Vegetation Index) analysis. NDVI is a common index of photosynthetic activity, or “greenness,” based on the fact that different surfaces (primary forest, secondary forest, water, bare ground, etc…) reflect light (visible and near-infrared) differently.

As seen in Image 9c, we obtained NDVI measurements across four different years (1985, 1995, 2005, and 2012) for 100 random points from each of three different areas: 1) area cleared by United Cacao in 2013 (orange dots), 2) nearby protected area that is proxy for primary forest (yellow dots), and 3) disturbed area along a major river that is proxy for secondary forest (purple dots).

For all four years, we found that the NDVI values for the area cleared by United Cacao in 2013 were similar to those of the nearby protected area (in fact, these values were nearly identical in 1985 and 1995), but significantly different than the disturbed area along the major river. In other words, the forest cleared by United Cacao was nearly identical to our proxy for primary forest and significantly different than our proxy for secondary forest. Thus, we conclude that United Cacao cleared over 2,000 hectares of primary forest in 2013.

Carbon Data Tells the Same Story


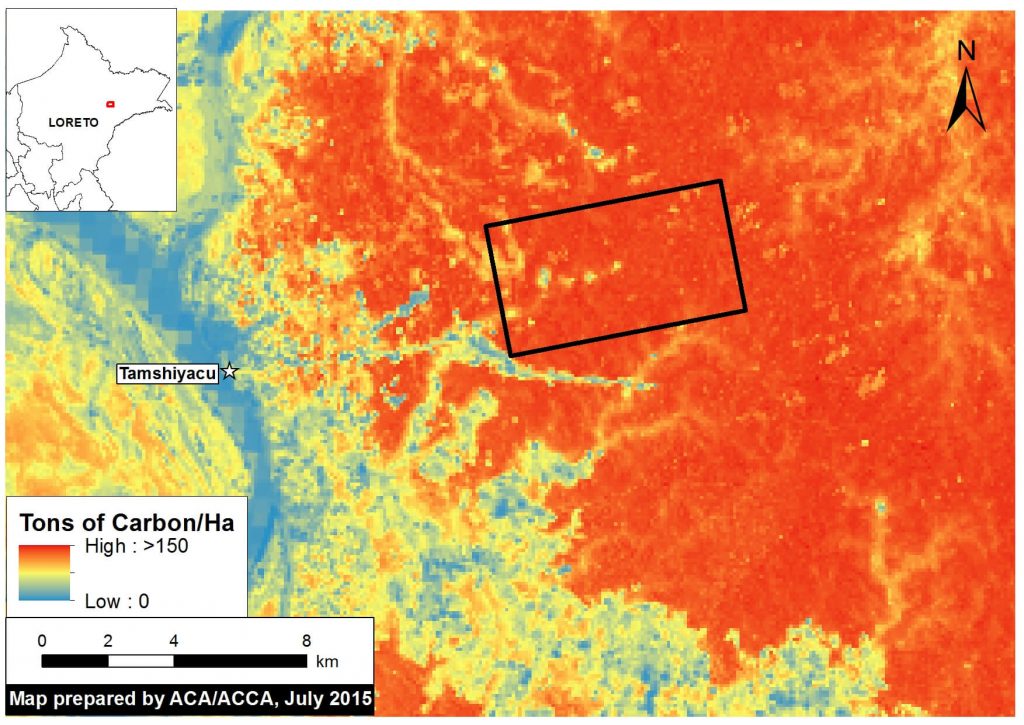
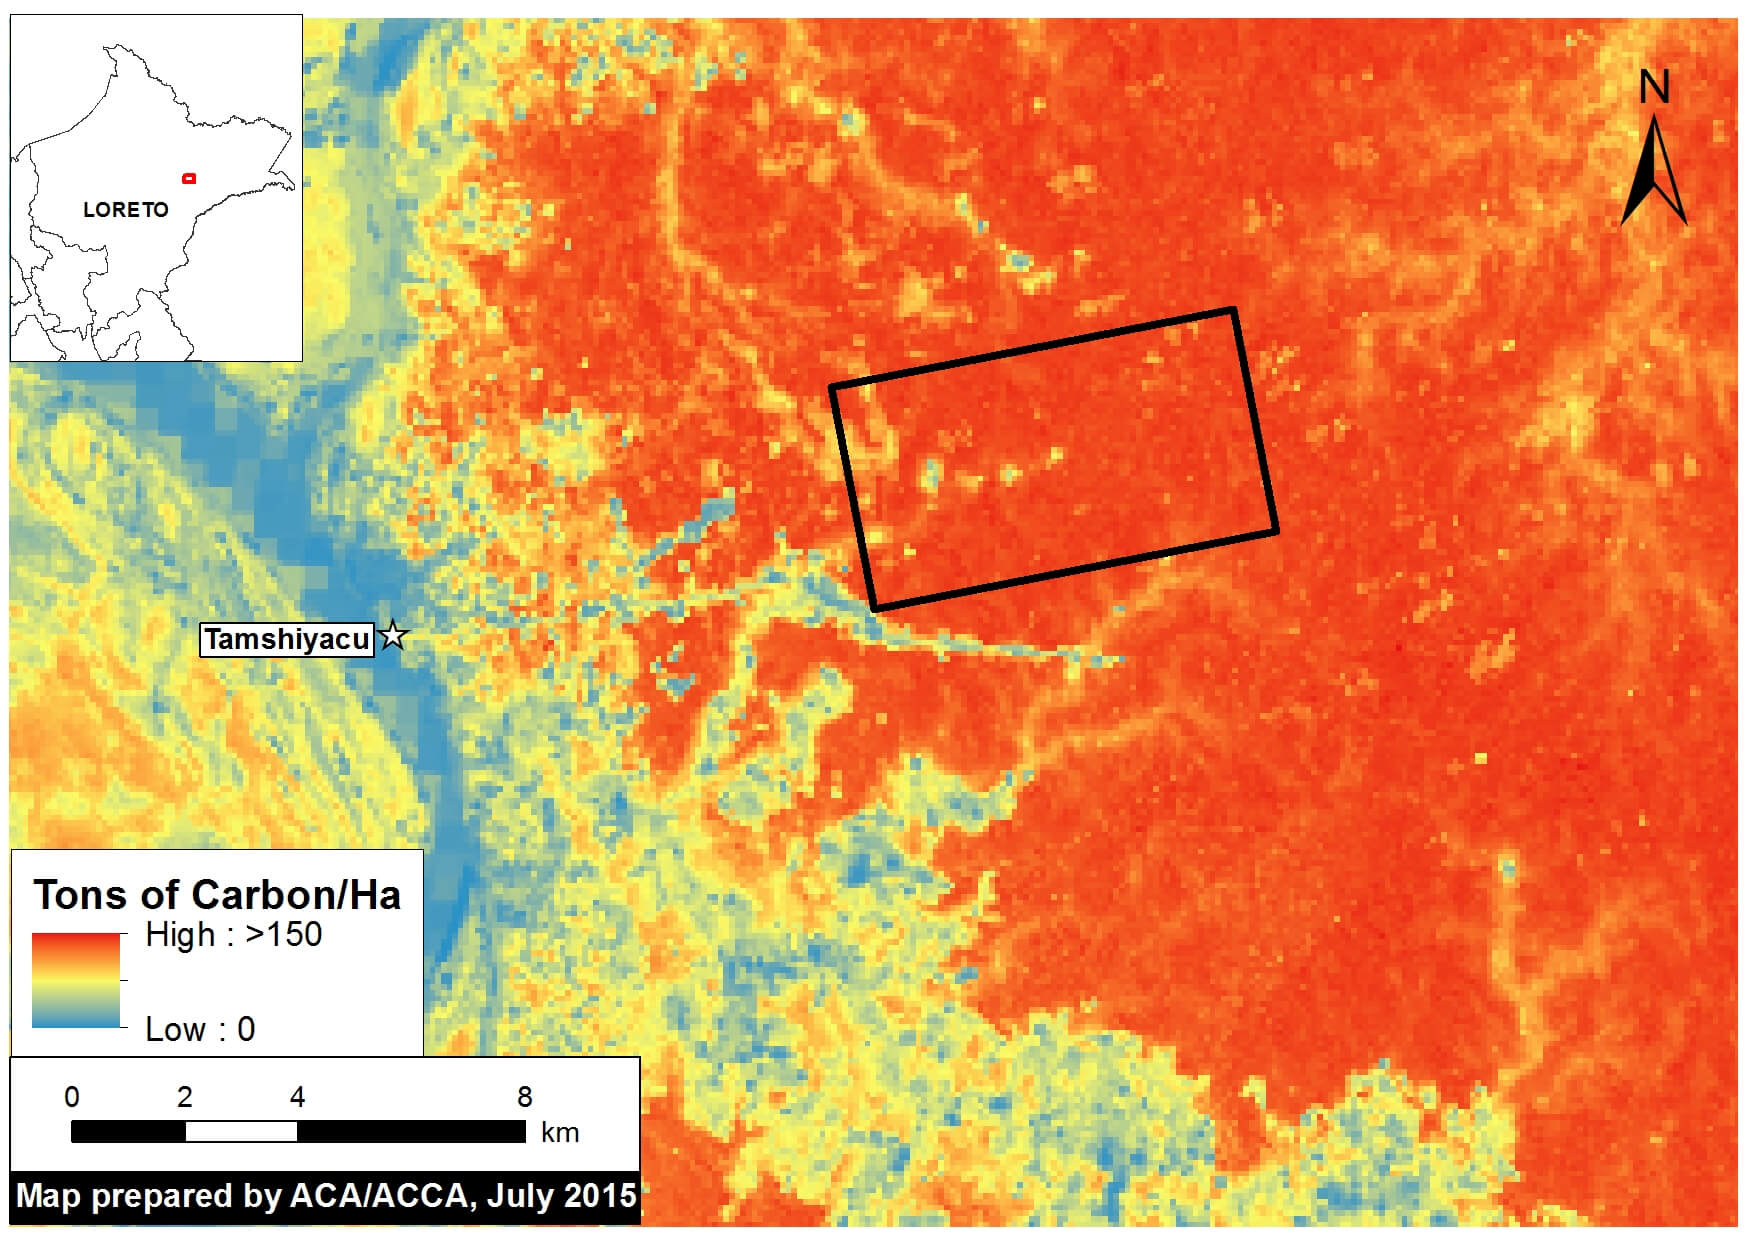
Image 9d. High-resolution carbon map of United Cacao plantation area (indicated by black box) prior to forest clearing. Data: Asner et al (2014) The high-resolution carbon geography of Peru. Berkeley, CA: Minuteman Press.

The Carnegie Airborne Observatory, led by Dr. Greg Asner, and the Peruvian Ministry of Environment, recently produced a high-resolution carbon geography of Peru. Interestingly, they mapped the carbon content of the United Cacao plantation area immediately prior to the forest clearing.

As seen in Image 9d, the vast majority of the United Cacao project area had the highest possible value of carbon (over 150 tons per hectare) immediately prior to the forest clearing in 2013. The only exceptions were the scattered previously cleared areas identified in Image 9b.

According to Asner, “The carbon levels were extremely high, indicating that they were large, intact forests that we normally picture when we think of primary Amazon forest.”

More Forest Clearing Coming…


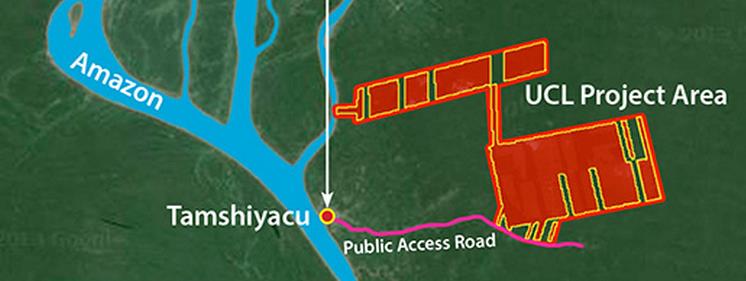
Image 9e. Project area map from the United Cacao website.

According to its website, United Cacao owns around 3,250 hectares near Tamshiyacu, and this total may soon increase to 4,000 hectares. In addition, the company has started an initiative with local farmers that may include an additional 3,250 hectares.

Thus, the current documented forest clearing of 2,126 hectares may soon double or triple.

Finally, it is worth mentioning that we detected a sawmill within the project area. This discovery raises the question, Has the company obtained the necessary permits for this activity?

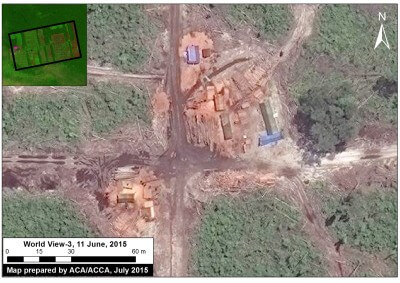
Image 9f. A sawmill detected within the cacao project area. Inset: The pink dot indicates location of sawmill within the project area. Data: WorldView-3 de Digital Globe (NextView).

Citation

Finer M, Novoa S (2015) Demonstrating that Forest Clearing for Cacao in Tamshiyacu (Loreto, Peru) came from Primary Forest. MAAP: Image #8. Link: https://maaproject.org/2015/06/image-9-cacao-tamshiyacu/

Image #10: Bahuaja Sonene National Park – Increasing Deforestation Within and Around Southern Section (Puno, Peru)

Here, in MAAP #10, we show the results of a deforestation analysis of two sectors of Bahuaja Sonene National Park and its surrounding buffer zone. The Park, which covers an area of more than 1.6 million hectares in the regions of Puno and Madre de Dios in the southern Peruvian Amazon, is an area of high biological diversity.

Specifically, we found increasing deforestation in 1) the buffer zone of the Park’s western section (Loromayo sector) and 2) inside the Park’s southeastern section (Colorado sector). In both cases, we identified shifting cultivation associated with coca cultivation as one of the main drivers of deforestation.

Image 10a. Deforestation detected in and around Bahuaja Sonene National Park and its buffer zone. Please note that Zooms “A” and “B” are described in more detail below. Data: SERNANP, PNCB, USGS.

Key Results

We highlight two key areas within and around Bahuaja Sonene National Park where deforestation grew substantially between 2013 and 2015:

1) Sector Loromayo, located in the buffer zone immediately outside the western section of the Park (see Zoom A). We estimate that more than 1,000 hectares (ha) were deforested since 2010, peaking in 2014 (331 ha). This expanding deforestation entered the Park in 2014.

2) Sector Colorado, located in the southeastern section of the Park (see Zoom B). We estimate, between 2001 to 2014, the deforestation of over 530 hectares inside the Park and over 1,170 hectares in the surrounding buffer zone. As in Loromayo, there was a notable increase in deforestation starting in 2010, with the peak occurring in 2014.

In both sectors, Loromayo and Colorado, we identified that one of the main drivers of deforestation is coca cultivation.

Description of Data

In the following maps:

Any variation of green in the satellite imagery indicates areas of forest cover.

Yellow (2000-2004), orange (2005-2008), red (2009-2012), and purple (2013) indicate areas that were deforested between 2000 and 2013 according to data from the National Program of Forest Conservation for the Mitigation of Climate Change (PNCB) of the Ministry of the Environment of Peru.

The colors pink (2014) and turquoise (2015) indicate areas that were deforested in the last two years based on our analysis of Landsat imagery using CLASlite forest monitoring software.

Zoom A: Loromayo River (western buffer zone)


Image 10b. The expansion of deforestation along the Loromayo river in the buffer zone to the west of Bahuaja Sonene National Park. Data: SERNANP, USGS, IBC, PNCB.

As shown in Figure 10b, we identified a striking pattern of deforestation in the sector Loromayo, located between the Malinowski and Chaspa rivers in the Park’s western buffer zone in the department of Puno. Note that the deforestation entered the Park in 2014.

In this area, we documented the deforestation of 1,005 hectares since 2010. This deforestation peaked in 2014, with 331 hectares, including 1.8 hectares within the Park. Not much data is yet available for 2015.

Please note that we previously reported on the advance of gold mining deforestation seen in Image 10b along the Malinowski River in MAAP #5.

Sector Loromayo: Shifting Agriculture that includes Coca Cultivation


Image 10c. Coca density data (upper panel) in relation to a recent high resolution satellite image of the area (lower panel). Data: UNODC 2014, SERNANP, Worldview-2 from Digital Globe (NextView).

In the recent UNODC (United Nations Office on Drugs and Crime) report “Monitoreo de Cultivos de Coca 2014” [Coca Crop Monitoring 2014], it was reported that the Loromayo sector (coca zone San Gabán) has a medium to high density of coca cultivation, with a recent increase of 5.9% since 2013. Therefore, we conculde that coca cultivation is one of the major drivers of the observed deforestation.

Image 10c displays the most recent UNODC coca density data (upper panel) in relation to a recent high resolution satellite image of the area (lower panel). Deforestation is rapidly expanding in the vicinity of the Park boundary. Unfortunately, in this image, a few clouds cover the small area where the deforestation recently entered Park.

Zoom B: Sector Colorado (Southeastern section of Park)

Image 10d. The expansion of deforestation in the Colorado sector of Bahuaja Sonene National Park. Data: SERNANP, USGS, IBC, PNCB.

As seen in Figure 10d, deforestation is well established and increasing in the sector Colorado, located in the southeast section of Bahuaja Sonene National Park, with the Region of Puno. Our analysis in this area extended from the upper Tambopata River to the Azata river.

We document the deforestation, since 2001, of 538 ha inside the Park and an additional 1,172 ha within the surrounding buffer zone. Similar to the sector Loromayo sector, there was a marked increase in deforestation since 2010, with a peak in 2014. More than half of the deforestation (53%, 287 ha) occurred since 2010, with a maximum of 81 ha in 2014. Not much data is yet available for 2015.

Sector Colorado: Presence of Coca Cultivation Inside the Park


Image 10e. Coca density data (upper panel) in relation to a recent high resolution satellite image of the area (lower panel). Data: UNODC 2014, SERNANP, SPOT6 from Airbus.

According to a recent report by the Wildlife Conservation Society (WCS), the deforestation in the Colorado sector was a result of the advance of agriculture and livestock cultivation in the area. Moreover, according to the recent UNODC report noted above, this sector (coca zone Inambari-Tambopata) also has a high density of coca, with 108 ha on the interior of Bahuaja Sonene National Park and 1,610 ha in the buffer zone, likely making it one of the major drivers of the observed deforestation.

Image 10e displays the UNODC coca density data (upper panel) in relation to a recent high resolution satellite image of the area (lower panel).

SERNANP Response

In response to this article, SERNANP (the Peruvian protected areas agency) issued this statement:

“El sector denominado como Colorado es sector ubicado dentro del Parque Nacional Bahuaja Sonene, que actualmente se encuentra zonificado como Zona de Recuperación; dicha zonificación se otorga a aquellas zonas que por actividades antrópicas han sido afectadas y que necesitan estudios complementarios para determinar su zonificación definitiva.”

[The sector named ‘Colorado’ is a sector located within the Bahuaja Sonene National Park, which currently is zoned as a ‘Restoration Zone.’ Said zoning is extended to those zones which have been affected due to anthropic activities and require supplementary studies so as to determine their definitive zoning designation.] Debemos señalar que en este sector se han detectado severas plagas que afectan los cultivos de frutos como la naranja y café, desencadenando que la población asentada en la zona de amortiguamiento del Parque se vean forzada a reemplazar estas plantaciones por el cultivo de coca en algunos casos.

[We should note that severe pests have been detected in this sector which affect the cultivation of fruit such as oranges and coffee; this has lead the population settled in the park’s buffer zone to have no choice but to replace these crops with the cultivation of coca in some cases.] Esta situación ha sido identificada y advertida oportunamente por el jefe del Parque Nacional Bahuaja Sonene a las entidades pertinentes para iniciar su erradicación; no obstante, el SERNANP también ha emprendido un trabajo conjunto con las autoridades locales y el comité de gestión del área natural protegida para combatir esta amenaza, lo cual figura en el Plan Maestro 2015-2019 del área en mención. Ahí se contemplan estrategias como la construcción de un puesto de control y vigilancia para monitorear permanentemente esta situación.

[The head of the Bahuaja Sonene National Park has identified and issued a warning about this situation in a timely manner to the relevant entities so as to initiate its eradication work; notwithstanding, SERNANP has also undertaken joint work with local authorities and the management committee of the natural protected area to combat this threat, which figures in the 2015-2019 Master Plan of the area in question. The latter contains strategies such as the construction of a checkpoint and guard post for permanently monitoring this situation.] Asimismo, se vienen promoviendo mesas de diálogo y el desarrollo de actividades económicas sostenibles que reemplacen los cultivos ilícitos y que garanticen la calidad de vida de la población de Colorado.”

[Likewise, dialogue roundtables and the development of sustainable economic activities have been promoted that can replace the illicit crops and guarantee quality of life for the population of Colorado.]

Citation

Finer M, Novoa S (2015) Bahuaja Sonene National Park – Increasing Deforestation Within and Around the Southern Section (Puno, Peru). MAAP: Image #10. Link: https://maaproject.org/2015/07/image-10-bahuaja/

References

UNODC. Monitoreo de cultivos ilícitos Perú 2014. p 29. (Lima, 2015).

Image #8: New Deforestation Detected Within Sierra Del Divisor (Peru) in June

Recall that in Image of the Week #7 we documented the increasing threats (illegal coca, logging, and mining) to the Sierra del Divisor Reserved Zone. We just obtained brand new, high-resolution imagery showing new deforestation deep within this protected area during the month of June. Here, Image of the Week #8, presents new maps of this recent deforestation. According to several consulted experts, the cause of this deforestation is illegal coca cultivation or a new illegal logging camp.

Image 8a: Very high resolution (38 cm) image from June 23 showing new deforestation within the Sierra del Divisor Reserved Zone. Data: WorldView-3 from Digital Globe (NextView).

New Deforestation Detected

Image 8a shows the new deforestation detected within the southeast section of the Sierra del Divisor Reserved Zone. As of June 23, 2015 (the date of the image), the total new deforestation was 13 hectares. This deforestion is located between the La Cúpula and Shesha hills.

In Image of the Week #7 we showed that there is a series of illegal logging camps nearby, but this new deforestation is located much deeper in the reserve. According to several consulted experts, the cause of the new deforestation is illegal coca cultivation or a new illegal logging camp.

Updated Baseline Map


Image 8b. Updated baseline map of the southeast section of the Sierra del Divisor Reserved Zone. Data: MINAM, SERNANP, USGS, IBC, Hansen/UMD/Google/USGS/NASA.

Image 8b is an updated map of the deforestation within the southeast section of the Sierra del Divisor Reserved Zone. Note that the new 2015 deforestation is found much deeper within the reserve than previous detected forest loss.

Confirming Recent Deforestation


Image 8c. Landsat time-series (2014-2015) of the recent deforestation. Data: USGS.

To better understand how the recent deforestation unfolded, we created a satellite (Landsat) image time-series. Note that in Image 8c all four panels show the exact same area over time. In August 2014, our focal area was completely forested. The first evidence of deforestation is seen in May 2015. In June 2015, the deforestation grows quickly.

Deforestation Within the Isconahua Territorial Reserve

Image 8d. Deforestation within the Territorial Reserve Isconahua. Data: MINAM, SERNANP, USGS, IBC, Hansen/UMD/Google/USGS/NASA.

Image 8d shows the new deforestation is also located with the Isconahua Territorial Reserve.

This is an official land designation in favor of indigenous peoples in isolation, to protect their rights, habitat, and the conditions that ensure their existence and integrity as a people.

SERNANP Response

In response to this article, SERNANP (the Peruvian protected areas agency) issued this statement:

“The Sierra del Divisor Reserved Zone is a transitional area under the Peruvian National Service of Natural Protected Areas (SERNANP).

Over the past few years, Sierra del Divisor has made significant efforts in its fight against ilegal logging and other activities that threaten it. However, it is worth noting that Image of the Week #8: New Deforestation Detected Within Sierra del Divisor (Peru) in June corresponds with an area of overlap with the Isconahua Territorial Reserve, a sector in which the Ministry of Culture works in coordination with SERNANP.

As part of our actions, SERNANP has planned a flyover in the zone to verify information regarding the new deforestation alert in the Sierra del Divisor, and will continue with special park guard patrolling that began last week, despite the local climate conditions.”

+++

“La Zona Reservada Sierra del Divisor es un espacio de carácter transitorio a cargo del Servicio Nacional de Áreas Naturales Protegidas por el Estado (SERNANP).

En los últimos años la ZRSD ha realizado grandes esfuerzos en su lucha contra la tala ilegal y otras actividades que la amenazan. Sin embargo, hay que precisar que la Imagen de la Semana #8: Nueva Deforestación al Interior de la ZRSD corresponde al ámbito de traslape (superposición) con la Reserva Territorial Isconahua, donde también interviene el Ministerio de Cultura, la cual el SERNANP trabaja de manera conjunta con dicho sector.

En el marco de nuestras acciones, el SERNANP viene programando un sobrevuelo en la zona para verificar la información sobre la nueva alerta de deforestación en la ZRSD, y continuar con el patrullaje especial del personal guardaparque que viene realizando desde la semana pasada, pese a las condiciones climáticas del lugar”.

Citation

Finer M, Novoa S, Peña N (2015) Nueva Deforestación al Interior de la Zona Reservada Sierra del Divisor. MAAP: Imagen #8. Link: https://maaproject.org/2015/06/imagen-8-sierradivisor

Mining News Watch #16

Mining News Watch #16 covers the time period March 17- June 10, 2015

Top Stories

  • The Peruvian government announced in May that new complementary regulations for the formalization process will be released in August.
  • To date, only 16 permits have been issued for formalized mining, affecting just 631 of the 58,835 miners that started the process in Puno.
  • According to a pair of technical reports by the Amazon Conservation Association (ACA) and Conservaciόn Amazόnica (ACCA), 2,500 hectares (6,200 acres) has been deforested in the Tambopata National Reserve buffer zone due to illegal mining in the past two years.
  • The Ministry of the Environment (MINAM) reported that 40.5 tons of mercury enter the rivers of Madre de Dios annually.
  • The Foreign Relations Committee of the Peruvian Congress approved the Minamata Convention, and sent it to the full Peruvian Congress for final approval.

Read Full Article >

Image #7: Sierra Del Divisor – Growing Threats Highlight Importance of Creating National Park

As the Peruvian Government decides whether the Sierra del Divisor Reserved Zone should become a National Park, here in Image of the Week #7 we offer this new analysis of the current deforestation patterns of the area. A Reserved Zone classification, which was applied to Sierra del Divisor in 2006, is a temporary measure to protect an area of biological importance until the government is able to determine a final designation. National Park status represents the strongest possible final designation and would lead to strengthened legal protections to confront the growing array of threats we document below (namely, illegal coca, logging, mining activities).

Image of the Week 7a. Deforestation patterns within and around the proposed Sierra del Divisor National Park. Key data sources: MINAM, SERNANP, USGS, IBC, MINAGRI, Hansen/UMD/Google/USGS/NASA.

Key Findings:

We have detected several deforestation fronts within and around the current Sierra del Divisor Reserved Zone. These findings demonstrate the need for the stronger legal protections that would come with National Park status.

Most notably, we detected within and around the current Reserved Zone (and proposed National Park):

Deforestation for illegal coca cultivation within the southwestern section (Zoom #1).

New logging roads near both the southern and northwestern sections (Zooms #1 and #2).

Deforestation associated with illegal logging camps within the southeastern section (Zoom #3). This illegal logging is within the Isconahua Territorial Reserve, an official land classification designed to protect the territory of indigenous peoples in isolation.

Gold mining near the southern section (Zoom #3).

Background: From Reserved Zone to National Park

Image 7b. The current (left panel) and potential (right panel) scenario for the Sierra del Divisor region

Image 7b illustrates the current (left panel) and potential (right panel) scenario for the Sierra del Divisor region.

The vast majority of the Reserved Zone would become a National Park under the current proposal pending before the Peruvian government. The proposed Sierra del Divisor National Park covers a vast area (1,354,485 hectares) in the far eastern Peruvian Amazon (departments of Loreto and Ucayali), adjacent to the Brazilian border.

Note that several sections on the western side of the Reserved Zone would not be included, however. Part of the excluded area, in the northwest, will remain as a Reserved Zone and may be part of a future proposal for a Regional Conservation Area known.

Coca and Logging Roads in Southwestern Section (Zoom #1)

Image 7c. Zoom #1: Enhanced view of the southwestern section of the proposed national park. Panels A and B are high resolution satellite images of the areas indicated on the main map on the left. Key data sources: MINAM, SERNANP, ACCA, Hansen/UMD/Google/USGS/NASA, USGS, SPOT 6.

Image 7c provides an enhanced view of the southwestern section of the proposed National Park. It highlights an expanding deforestation cluster — 130 hectares between 2013 and 2014 — on the upper Calleria River (see “A” on the map). Our analysis indicates that illegal coca cultivation is the cause of this deforestation. Panel A shows a high resolution satellite image of this deforestation.

Also note that a new road is being constructed near the southwestern park boundary (see “B” on the map). We presume it to be a logging road because it passes through a forestry concession. Most notably, there was significant new construction in both 2013 and 2014, indicating that the road is in active use. In addition, high resolution imagery (see panel B) shows road width of about 30 meters, indicating that it may be designed for larger vehicles and heavy machinery.

Logging Road Approaching Northwestern Section (Zoom #2)

Image 7d. Zoom #2: Enhanced view of the northwestern section of the proposed national park. Key data sources: USGS, SERNANP, GOREL.

Image 7d provides an enhanced view of the northwestern section of the proposed National Park, showing the construction of another new logging road. We presume that it is a logging road because it is passing through forestry concessions with no other obvious destination. Most notably, there was new construction in 2013, 2014, and 2015 indicating that is an active logging road.

Also note the expanding deforestation, especially in 2014, outside of the town of Contamana, indicating the importance of creating a Regional Conservation Area in this area adjacent to the proposed National Park.

Illegal Logging and Gold Mining in Southeastern Section (Zoom #3)

Image 7e. Zoom #3: Enhanced view of the southeastern section of the proposed national park. Panels A, B, and C are high resolution satellite images of the areas indicated on the main map on the left. Key data sources: MINAM, SERNANP, ACCA, Hansen/UMD/Google/USGS/NASA, USGS, and SPOT 6.

Image 7e provides an enhanced view of the southeastern section of the Proposed National park. It highlights that both illegal logging (see “A” on the map) and gold mining (see “B” and “C” on the map) are present.

It is important to emphasize that this southeast section is part of the Isconahua Territorial Reserve administered by the Ministry of Culture. This is an official land designation in favor of indigenous peoples in isolation, to protect their rights, habitat, and the conditions that ensure their existence and integrity as a people.

Regarding the illegal logging, our analysis indicates the deforestation within the proposed National Park along the upper Shesha River is caused by a series of logging camps. Panel A shows a high resolution satellite image of this deforestation. This illegal logging is within the Isconahua Territorial Reserve.

Regarding the gold mining, there are two principal zones causing deforestation, one along the Shesha River and the other along the Abujao River. Panels B and C show high resolution images of these two mining areas. The headwaters of both river systems are born in the proposed park.

SERNANP Response

In response to this article, SERNANP (the Peruvian protected areas agency) issued this statement:

La Zona Reservada Sierra del Divisor es un espacio de carácter transitorio a cargo del Servicio Nacional de Áreas Naturales Protegidas por el Estado (SERNANP). La zona aledaña a esta área acoge a 14 Comunidades Nativas, las cuales aprovechan los servicios ecosistémicos en beneficio de más de 500 familias.

En los últimos años la ZRSD ha logrado mejores resultados en su lucha contra la tala ilegal enfrentando esta amenaza sobre todo en espacios de ámbito de las reservas territoriales, y continúa alerta por la deforestación asociada al cultivo ilícito de coca que se reporta en esta parte del país.

En ese marco, se ha reportado desde el 2011 a los sectores correspondientes para su incorporación dentro del Plan Anual de Reducción del Espacio Cocalero de tal forma que se haga frente a esta amenaza de manera estratégica.


Data Description:

Background map is a mosaic of four Landsat 8 images (30 m resolution) from August and September 2014. Any variation of green indicates forest cover. Note there is some scattered cloud cover. Data is from USGS.

Protected areas are darker green. Data for the proposed Sierra del Divisor National Park comes from its technical document (expediente técnico).

Black indicates areas that were deforested as of 2000 according to data from the Peruvian Environment Ministry (MINAM 2009). Yellow (2000-2006), red (2007-2012), and purple (2013) indicate areas that were deforested from 2000 to 2013 according to data published by Hansen et al. 2013 (Science 342: 850–53; Data download).

Pink and teal indicate areas that were deforested between 2014 and early 2015 based on our analysis of Landsat imagery using CLASlite forest monitoring software.


Citation

Finer M, Novoa S (2015) Sierra del Divisor: Growing Threats Highlight Importance of Creating National Park. MAAP Image #7. Link: https://maaproject.org/2015/06/image-7-sierra-del-divisor/

Cusco’s Own Spectacled bear workshop

Last week our Peruvian partner Conservación Amazónica–ACCA helped host a spectacled bear workshop in Cusco. Held from June 4 to 9, the workshopwhich brought together students, researchers, and decision makers in Peruset out to strengthen spectacled bear conservation and share information. Spectacled bears (Tremarctus ornatus) live along the spine of the Andes and are the only bear native to South America. They feature prominently in the worldview and culture of Andean populations but unfortunately, the bear is considered a vulnerable species

For 18 participants, the course was not only a chance to learn about the species and monitoring fundamentals, but also a chance to travel to Wayqecha Cloud Forest Biological Station, get their boots dirty, and experience hands-on learning. They installed camera traps and learned bear identification methods firsthand.

Global Big Day 2015 at Los Amigos

A collared puffbird at Los Amigos on last month's Global Big Day. Photo by Jorge Valdez.
A collared puffbird at Los Amigos on last month’s Global Big Day. Photo by Jorge Valdez.

Wow, the results are in! Los Amigos Biological Station participated in this year’s Global Big Day on May 9th in a big way. Global Big Day a day on which birders worldwide attempt to record as many species of birds as possible within a 24-hour period.

The 4-person team at Los Amigos included University of Michigan Ph.D. candidate Sean Williams. “My backyard in the Peruvian Amazon held more than 500 species in an area the size of Central Park, and I could not extinguish the blazing thoughts of the species I would encounter that day,” he wrote in a blog about the experience. 

By the end of the day, birders had seen a total of 308 species at Los Amigos—the fifth highest recorded site total in the world! Peru was also the country that saw the most bird species, totalling 1177 in all, almost a hundred more than the next closest country. (By the way, the two southeastern regions where we work, Madre de Dios and Cusco, saw the most bird species within Peru!)

Image #6: Expanding Gold Mining Deforestation Enters Amarakaeri Communal Reserve (Madre De Dios, Peru)

Recall that in Image of the Week #1 and Image of the Week #5 we documented how gold mining deforestation continues to expand within the Department of Madre de Dios, Peru (in the areas known as La Pampa and Upper Malinowski, respectively). Here, Image of the Week #6 documents how expanding deforestation from the mining zone known as Huepetuhe/Delta-1 is now entering the Amarakaeri Communal Reserve, an important Peruvian protected area that is co-managed by indigenous communities and Peru’s National Protected Areas Service (known as SERNANP).
Our analysis shows that gold mining deforestation, expanding from Huepetuhe/Delta-1, entered the southeast corner of the reserve in 2013 and expanded in 2014 and 2015. We also show that gold mining deforestation is spreading within the reserve’s south-eastern buffer zone.

Image of the Week 6a. Deforestation detected within and around the Amarakaeri Communal Reserve and its buffer zone. Zoom Area #1 indicates focal area in Images 6b and 6c, while Zoom Area #2 indicates focal area in Image 6d. Key data sources: MINAM, SERNANP, ACCA, USGS, IBC, Hansen/UMD/Google/USGS/NASA.

Key Findings:

According to our CLASlite analysis, deforestation entered the southeast corner of the Amarakaeri Communal Reserve in 2013 and expanded in 2014 and 2015 (see Zoom #1 below). Additional analysis revealed that the driver of this deforestation was gold mining due to the pattern and appearance of the forest loss.

We also detected increasing gold mining deforestation within the reserve’s south-eastern buffer zone between 2014 and 2015 (see Zoom #2 below). See below for more details.

We also detected a small amount of deforestation in 2014 from Hunt Oil’s drilling of Pad A within the reserve (see “B” in Image 6a). Note that overall deforestation from this gas exploration project has been very low because the company did not build an access road.

Gold Mining Deforestation Enters the Reserve (Zoom Area #1)

Image 6b. Zoom Area #1 provides an enhanced view of the deforestation within the southeast section of Amarakaeri Communal Reserve and its surrounding buffer zone. Key data sources: MINAM, SERNANP, ACCA, Hansen/UMD/Google/USGS/NASA, USGS.

Image 6b is a zoom view of the deforestation within the southeast section of Amarakaeri Communal Reserve and its surrounding buffer zone (see Zoom Area #1 in Image 6a for context).

Here, one can more clearly see how the gold mining deforestation entered the southeast corner of the reserve in 2013 and expanded in 2014 and 2015.

Total gold mining deforestation within this section of the Reserve is currently 11 hectares. Although this is currently only 1% of the Reserve’s total area, it represents a growing trend that may worsen.

Note that all of the rest of the deforestation in the image is within the reserve’s surrounding buffer zone.


Satellite Image Time-series of Deforestation Entering the Reserve (Zoom Area #1)

Image 6c. Satellite (Landsat 8) image time-series (2013 – 2015) of deforestation within the southeast section of the Amarakaeri Communal Reserve. Note that all four panels show the same location over time. Key data sources: USGS, SERNANP.

To better understand the deforestation dynamics over time within the southeast corner of the Amarakaeri Communal Reserve, we created a satellite (Landsat 8) image time-series. As seen in Image 6c, gold mining deforestation within the reserve is first seen in July 2013, and then slowly expands on several fronts until February 2015, the last good Landsat image for the area. Note that all four panels show the same location. Also note that all area in each panel outside the reserve is within its official buffer zone.

Gold Mining Deforestation Encroaching Upon Another Part of the Reserve (Zoom Area #2)

Image 6d. Zoom view of the deforestation within the south-eastern buffer zone of the Amarakaeri Communal Reserve. Left panel shows deforestation results data and right panel shows high resolution SPOT 7 imagery for the area in white dashed lines. Key data sources: MINAM, SERNANP, ACCA, Hansen/UMD/Google/USGS/NASA, USGS, and SPOT 7 from Airbus.

Image 6d shows how gold mining deforestation is encroaching on another part of the south-eastern section of the reserve (see Zoom Area #2 in Image 6a for context). As seen in the left panel, the deforestation within the buffer zone began expanding most notably in 2014 and 2015.

To confirm the driver of the deforestation, we acquired high resolution satellite imagery (SPOT 7 with 1.5 m resolution). As seen in the right panel of Image 6d, the pattern of the recent deforestation is characteristic of gold mining, and not other possible drivers such as agriculture.


Data Description:

Background map is a mosaic of two Landsat 8 images (30 m resolution) from April 10, 2014 and August 30, 2013. Any variation of green indicates forest cover. Note there is some scattered cloud cover. Data is from USGS.

Protected areas data is from SERNANP. Dark green indicates an established Peruvian national protected area or conservation concession and yellow-green indicates an official protected area buffer zone.

Black indicates areas that were deforested as of 2000 according to data from the Peruvian Environment Ministry (MINAM 2009). Yellow, orange, and red indicate areas that were deforested from 2000 to 2012 (each color covers a four year period) (Hansen MC et al. 2013 Science 342: 850–53; Data download).

Purple, pink, and teal indicate areas that were deforested between January 2013 and February 2015 based on our analysis of Landsat imagery using CLASlite forest monitoring software.


Citation

Finer M, Novoa S (2015) Gold Mining Deforestation Enters Amarakaeri Communal Reserve (Madre de Dios, Peru). MAAP: Image #6. Link: https://maaproject.org/2015/08/image-of-the-week-6-gold-mining-deforestation-enters-amarakaeri-communal-reserve/

Image #5: Gold Mining Deforestation Intensifies Along Upper Malinowski (Madre De Dios, Peru)

Recall that in Image of the Week #1 we documented how gold mining deforestation continues to expand within the Department of Madre de Dios (Peru) in an area known as La Pampa (1,700 hectares of new deforestation between 2013 and 2015). Here, Image of the Week #5 examines the area immediately to the west of La Pampa along the Upper Malinowski River, where we document over 850 hectares of additional gold mining deforestation between 2013 and 2015. Like La Pampa, most mining along the Upper Malinowski is illegal because it is outside the permissible mining zone and within the official buffer zone of a protected area.

Image of the Week 5a. Expanding deforestation from illegal gold mining along the Upper Malinowski River. Key data sources: MINAM, SERNANP, ACCA, USGS, IBC, Hansen/UMD/Google/USGS/NASA.

Key Results

According to our CLASlite analysis, 864 hectares were deforested between 2013 and 2015 along the Upper Malinowski and nearby tributaries within the buffer zones of the Bahuaja Sonene and Tambopata protected areas.

Image of the Week Description

Background map is a Landsat 8 image (30 m resolution) from February 2, 2015. Any variation of green indicates forest cover. Note there is some scattered cloud cover. Data is from USGS.

Protected areas data is from SERNANP. Dark green indicates established national protected areas and yellow-green indicates their buffer zones.

Black indicates areas that were deforested as of 2000 according to data from the Peruvian Environment Ministry (MINAM 2009). Yellow, orange, and red indicate areas that were deforested from 2000 to 2012 (each color covers a four year period) (Hansen MC et al. 2013 Science 342: 850–53; Data download).

Purple indicates areas that were deforested between January 2013 and February 2015 based on our analysis of Landsat imagery using CLASlite forest monitoring software.

Madre de Dios Mining Zone

Image 5b. Madre de Dios mining zone, highlighting location of La Pampa and Upper Malinowski. Note that we did not include other land uses such as forestry concessions. Key data sources: MINAM, SERNANP, ACCA, Hansen/UMD/Google/USGS/NASA, USGS.

Image 5b provides greater context of the Madre de Dios mining zone, highlighting La Pampa at “C” (Image of the Week #1) and the Upper Malinowski at “D”.

The Permissible Mining Zone was established in 2010 and indicates the zone that the Peruvian Government has delimited as potentially legal for small-scale and artisanal mining activities, but only if miners succesfully complete a multi-step formalization process for each project. One of the key steps of this process is to resolve any land use conflicts due to overlapping land claims (for example if a section of the mining corridor overlaps with a forestry concession). Data is from ACCA.

Importantly, note that most gold mining in both La Pampa and the Upper Malinowski is illegal since it is located outside the permissible mining zone and within the buffer zone of two protected areas (Bahuaja Sonene National Park and Tambopata National Reserve).

Also note that on the lower Malinowski, deforestation is concentrated on the buffer zone side and largely absent on the protected area side. This striking pattern indicates that official protection status is much more of an effective deforestation deterrent than the looser buffer zone status.

High-resolution Zoom

Image 5c. High resolution satellite image of deforestation along the Upper Malinowski River. Key data sources: SPOT 7, CLASlite.

To better understand the driver of the deforestation along the Upper Malinowski, we acquired high resolution satellite imagery (SPOT 7 with 1.5 m resolution). As seen in Image 5c, the pattern of the recent deforestation is characteristic of gold mining, and not other possible drivers such as agriculture. Note that the purple outlines indicate areas that were deforested between January 2013 and February 2015 based on our CLASlite analysis (this image shows 492 of the total 864 hectares of recent deforestation).

Satellite Image Time-series

Image 5d. Satellite image time-series (2013 – 2015) of deforestation along the Upper Malinowski. Note that all four panels in Image 5d show the same location. Key data sources: USGS, SPOT 7.

To better understand the deforestation dynamics over time along the Upper Malinowski, we created a satellite image (Landsat and SPOT 7) time-series. As seen in Image 5d, there was a rapid increase in mining deforestation in the less than two years between July 2013 and February 2015. Note that all four panels in Image 5d show the same location, but appear different because of the deforestation.


Citation

Finer M, Novoa S (2015) Gold Mining Deforestation Intensifies along Upper Malinowski (Madre de Dios, Peru). MAAP: Image #5. Link: https://maaproject.org/2015/05/image-5-gold-mining-deforestation-intensifies-along-upper-malinowski-madre-de-dios-peru/