As the Peruvian Government decides whether the Sierra del Divisor Reserved Zone should become a National Park, here in Image of the Week #7 we offer this new analysis of the current deforestation patterns of the area. A Reserved Zone classification, which was applied to Sierra del Divisor in 2006, is a temporary measure to protect an area of biological importance until the government is able to determine a final designation. National Park status represents the strongest possible final designation and would lead to strengthened legal protections to confront the growing array of threats we document below (namely, illegal coca, logging, mining activities).
Key Findings:
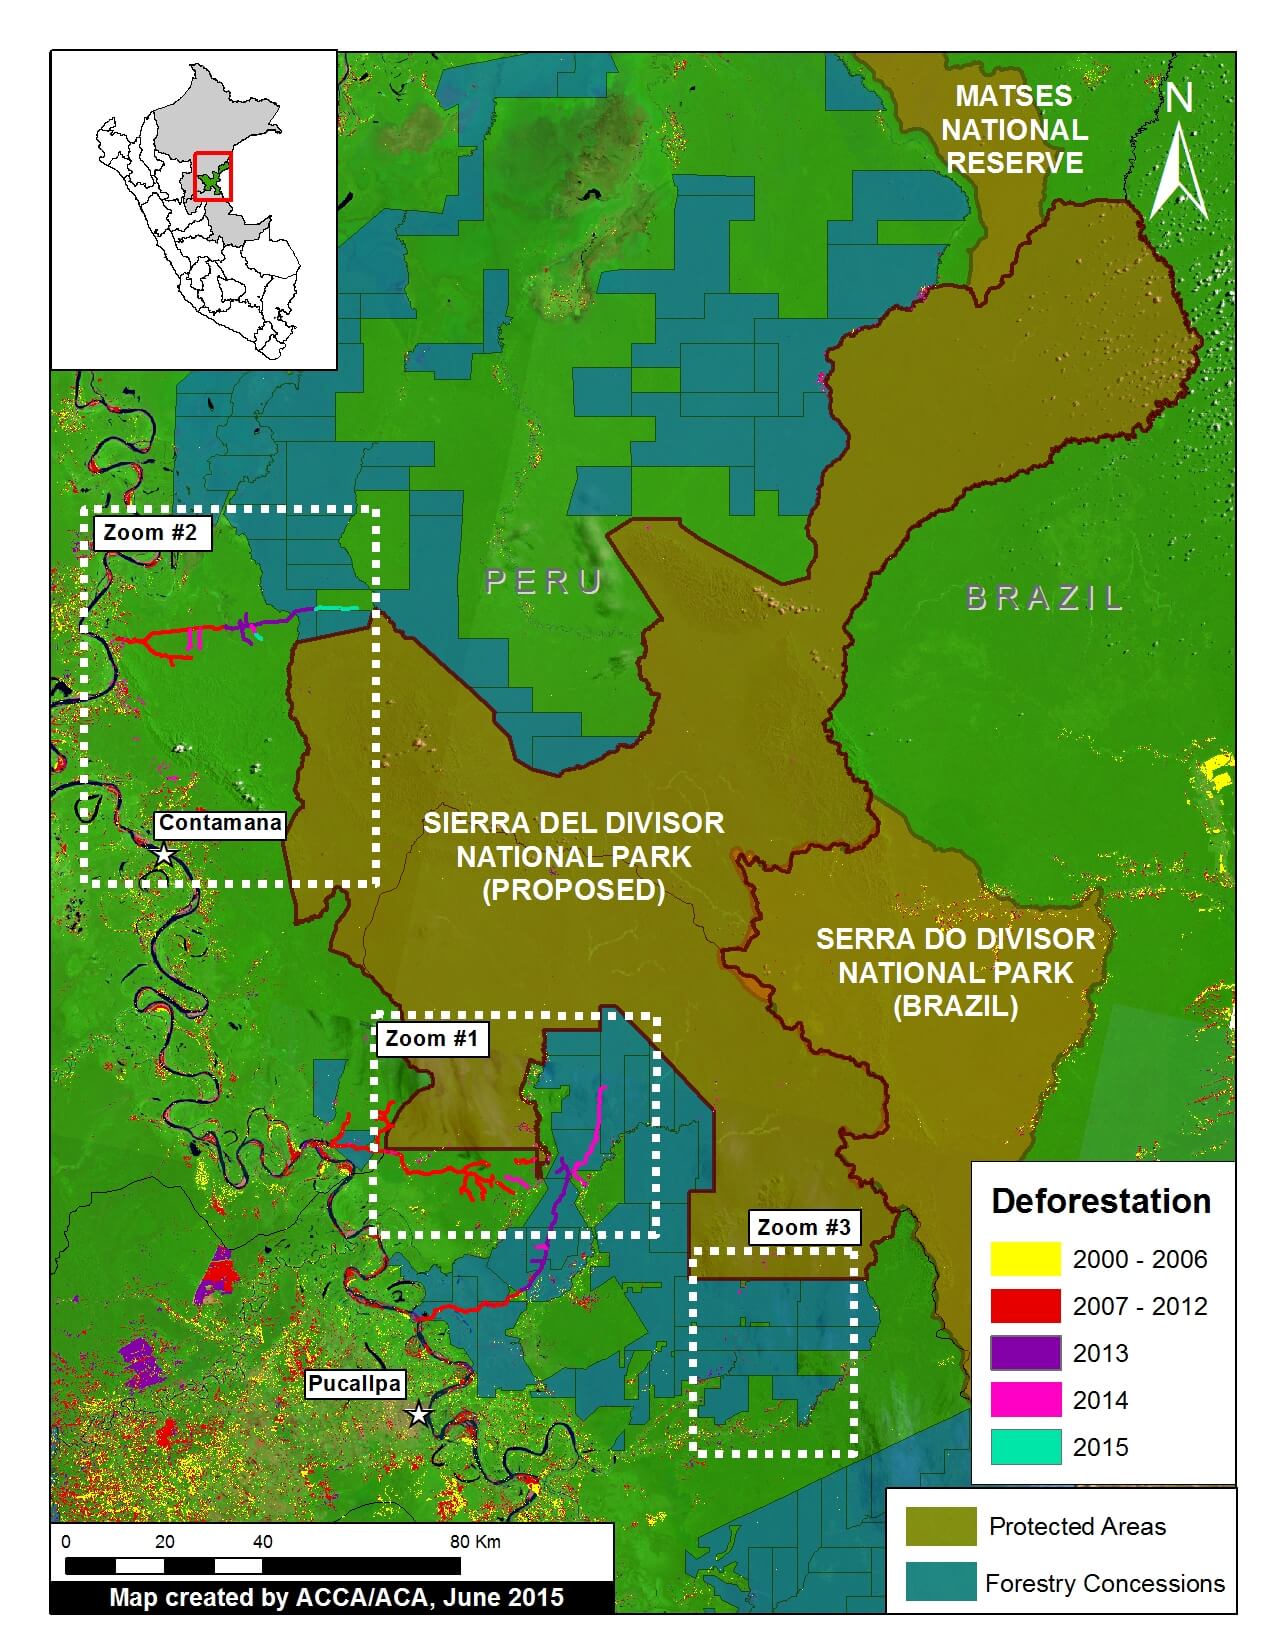
We have detected several deforestation fronts within and around the current Sierra del Divisor Reserved Zone. These findings demonstrate the need for the stronger legal protections that would come with National Park status.
Most notably, we detected within and around the current Reserved Zone (and proposed National Park):
– Deforestation for illegal coca cultivation within the southwestern section (Zoom #1).
– New logging roads near both the southern and northwestern sections (Zooms #1 and #2).
– Deforestation associated with illegal logging camps within the southeastern section (Zoom #3). This illegal logging is within the Isconahua Territorial Reserve, an official land classification designed to protect the territory of indigenous peoples in isolation.
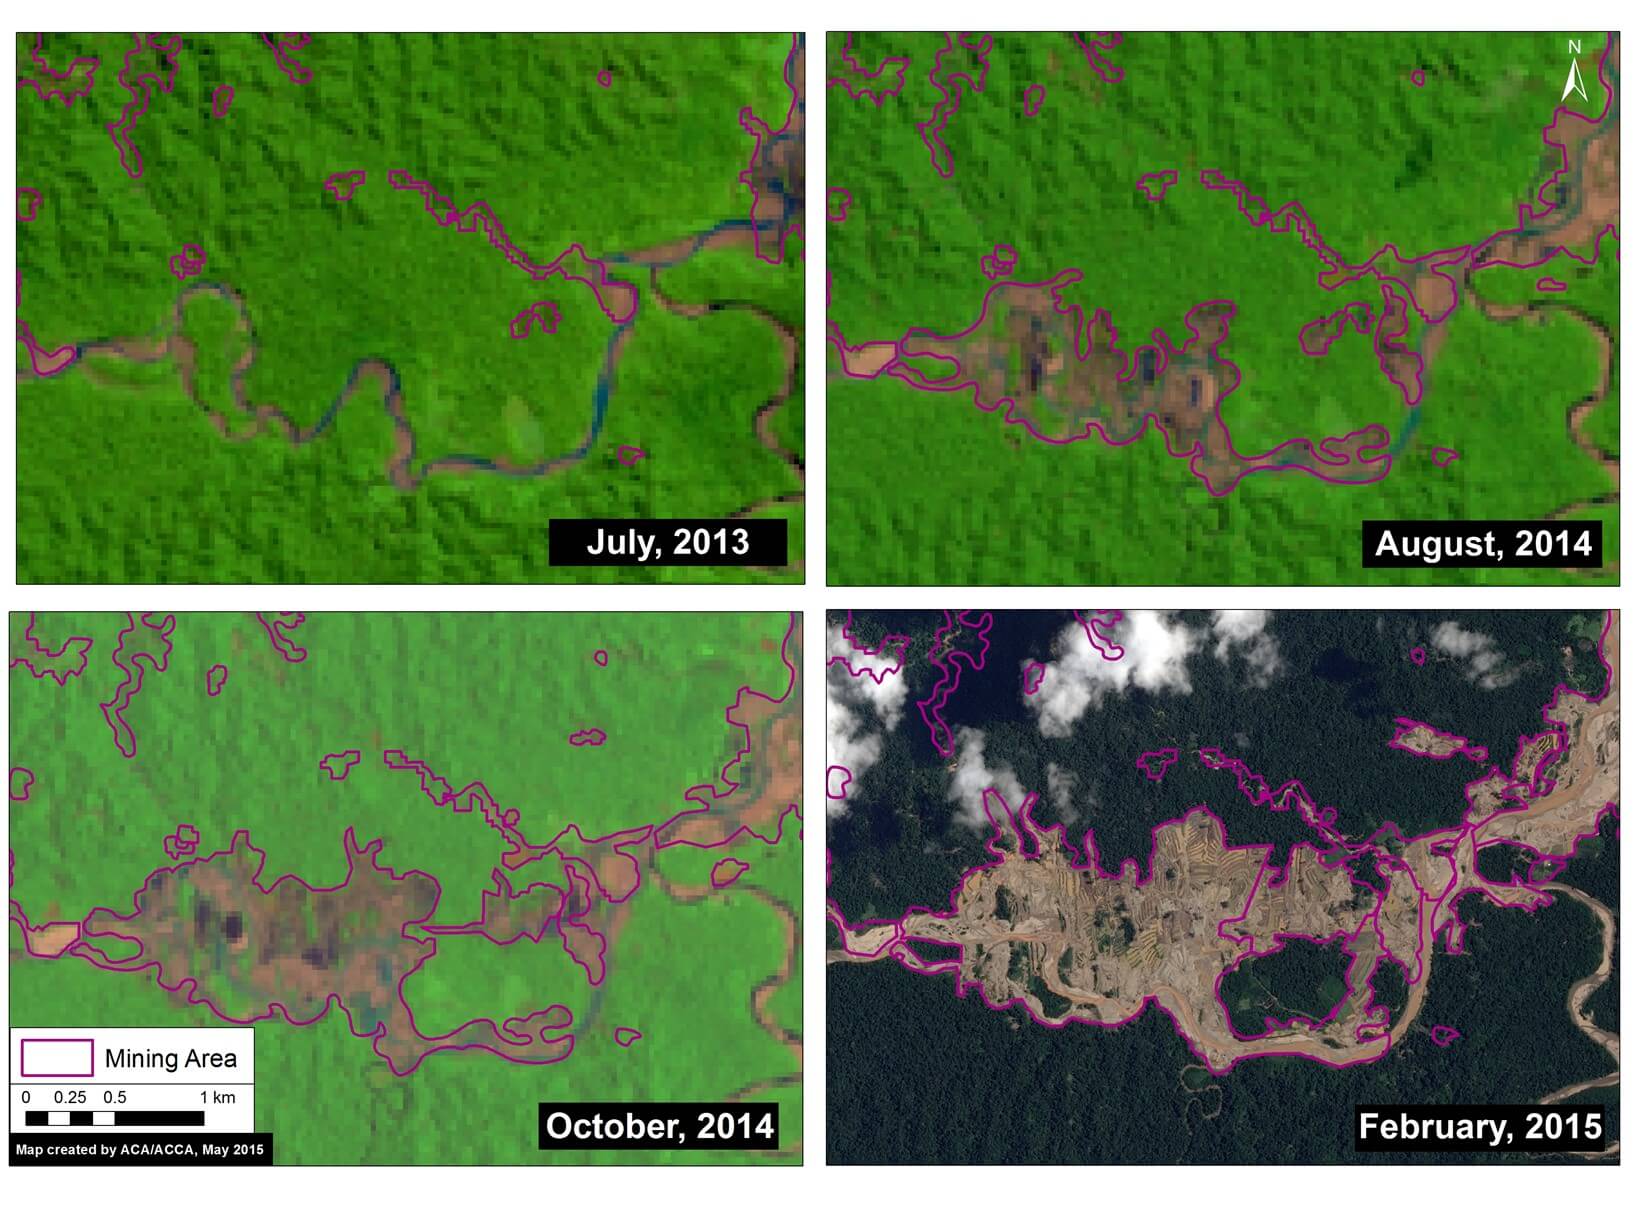
– Gold mining near the southern section (Zoom #3).
Background: From Reserved Zone to National Park
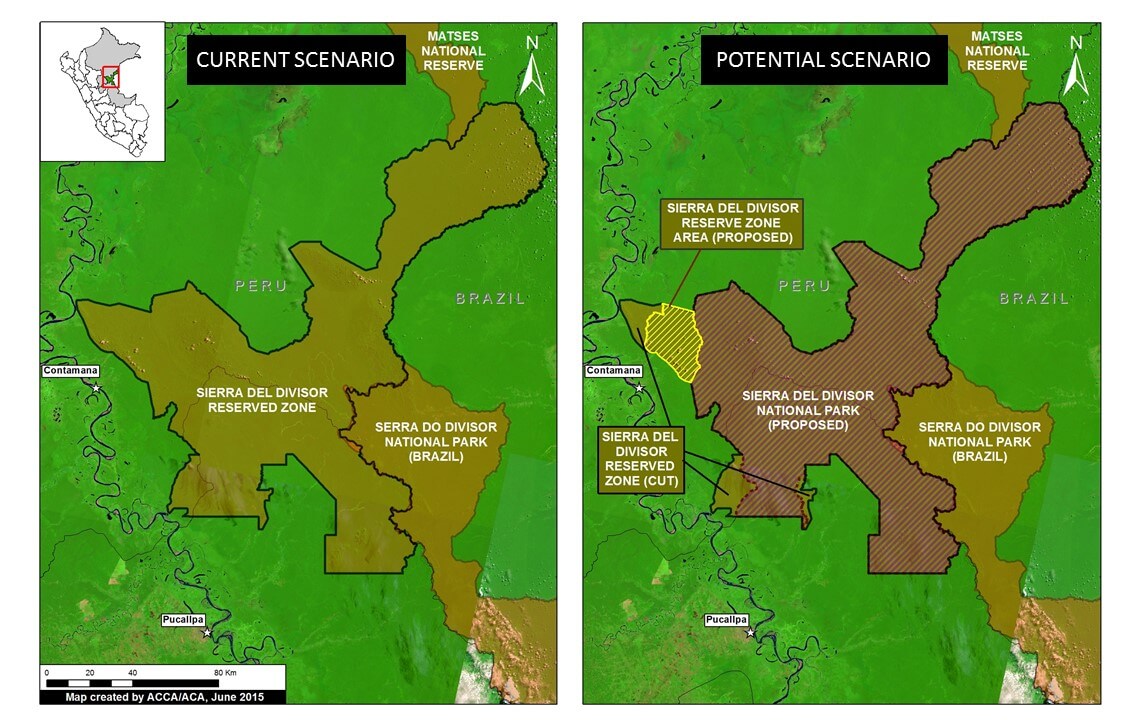
Image 7b illustrates the current (left panel) and potential (right panel) scenario for the Sierra del Divisor region.
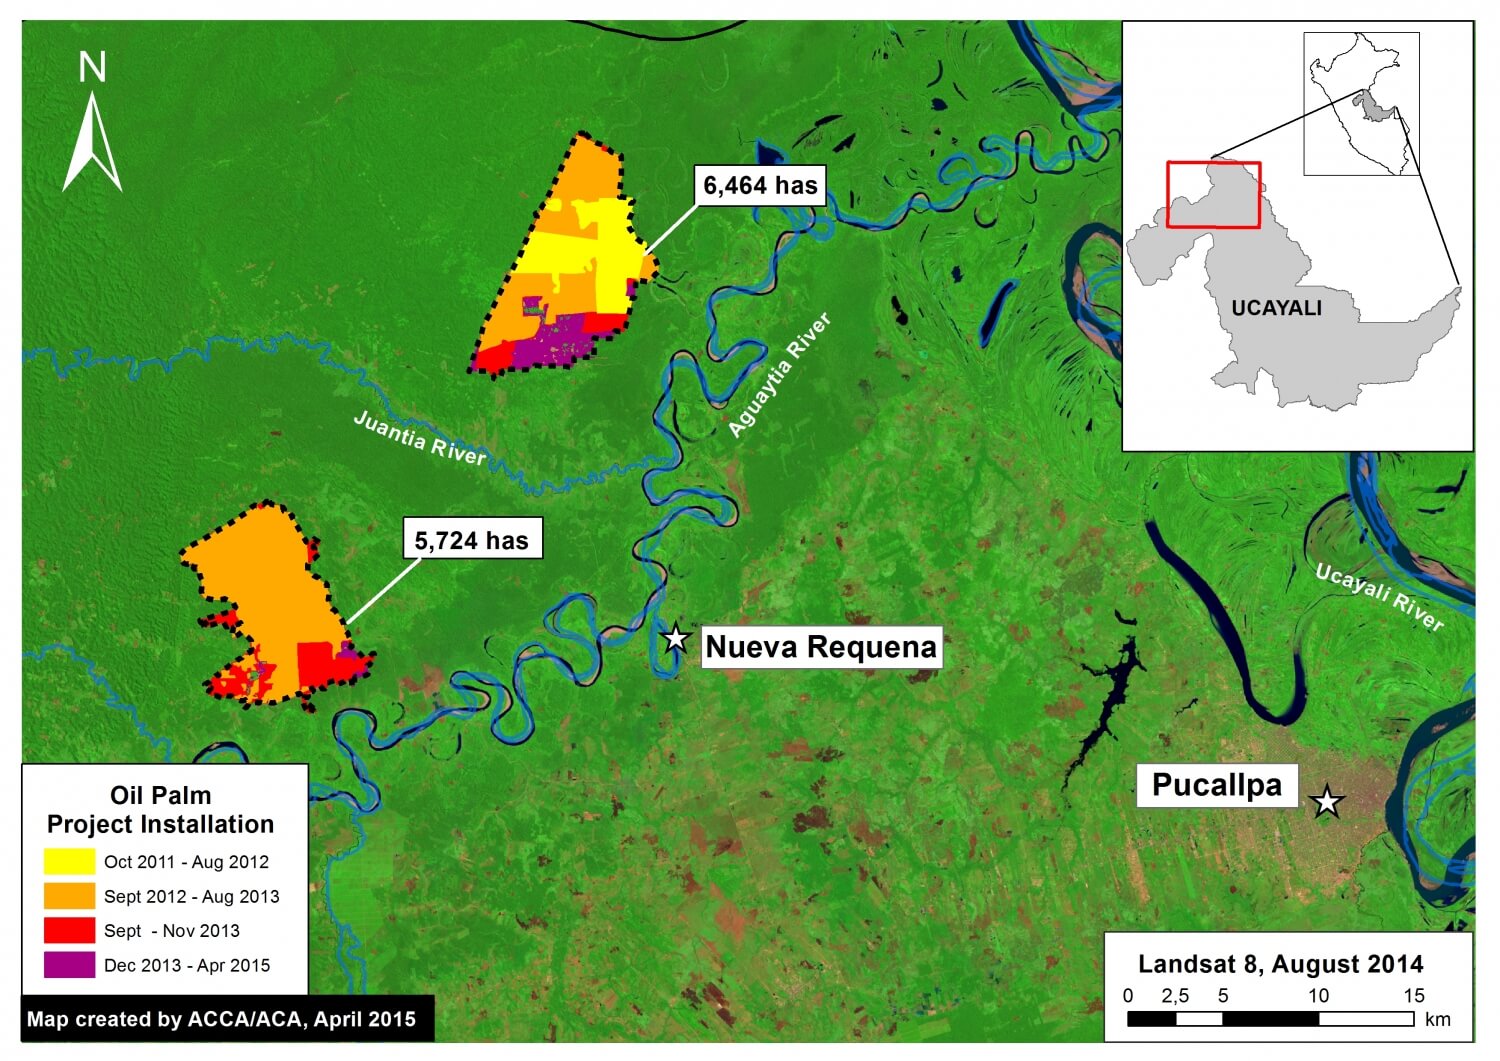
The vast majority of the Reserved Zone would become a National Park under the current proposal pending before the Peruvian government. The proposed Sierra del Divisor National Park covers a vast area (1,354,485 hectares) in the far eastern Peruvian Amazon (departments of Loreto and Ucayali), adjacent to the Brazilian border.
Note that several sections on the western side of the Reserved Zone would not be included, however. Part of the excluded area, in the northwest, will remain as a Reserved Zone and may be part of a future proposal for a Regional Conservation Area known.
Coca and Logging Roads in Southwestern Section (Zoom #1)
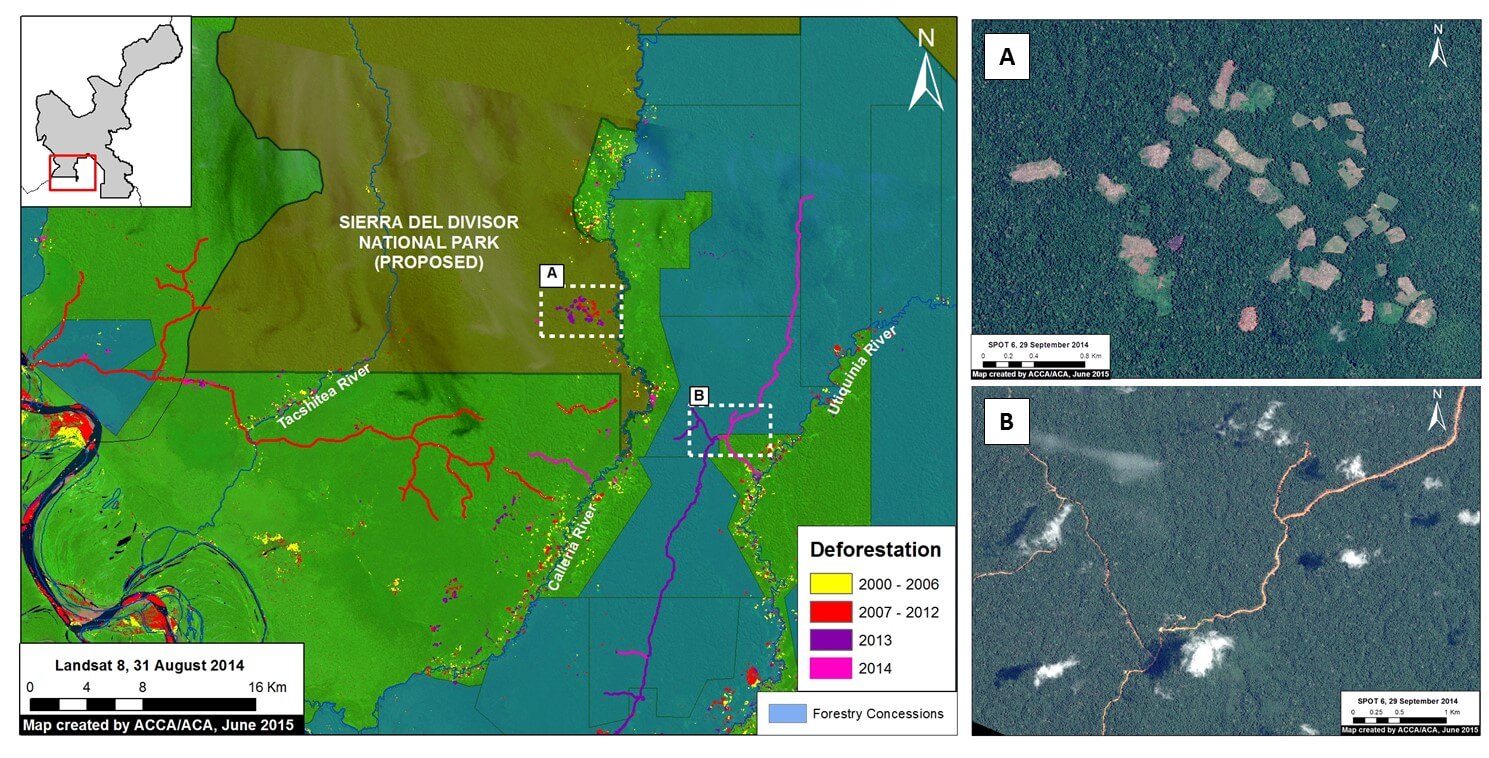
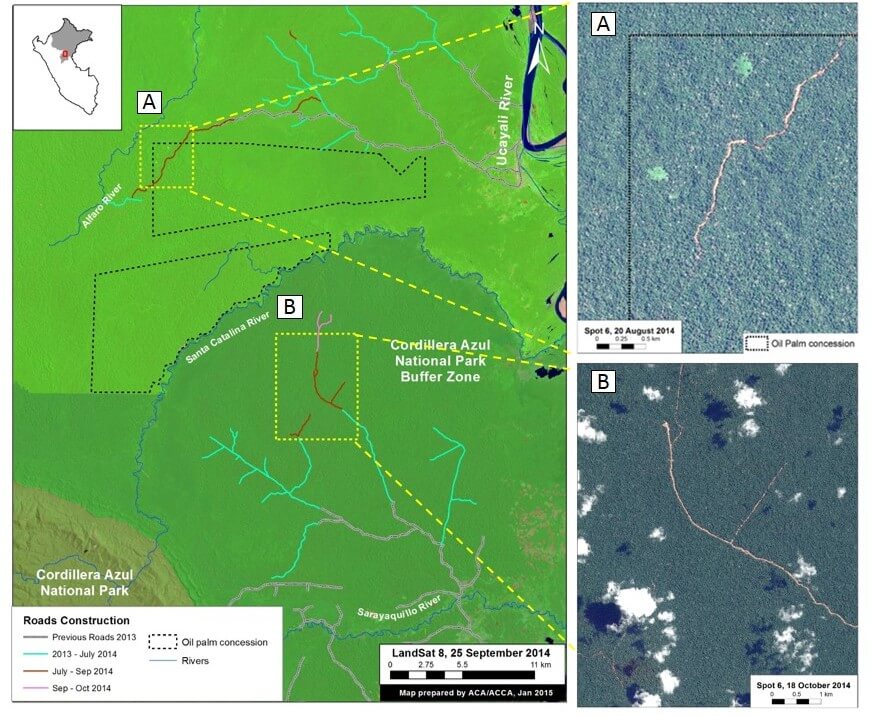
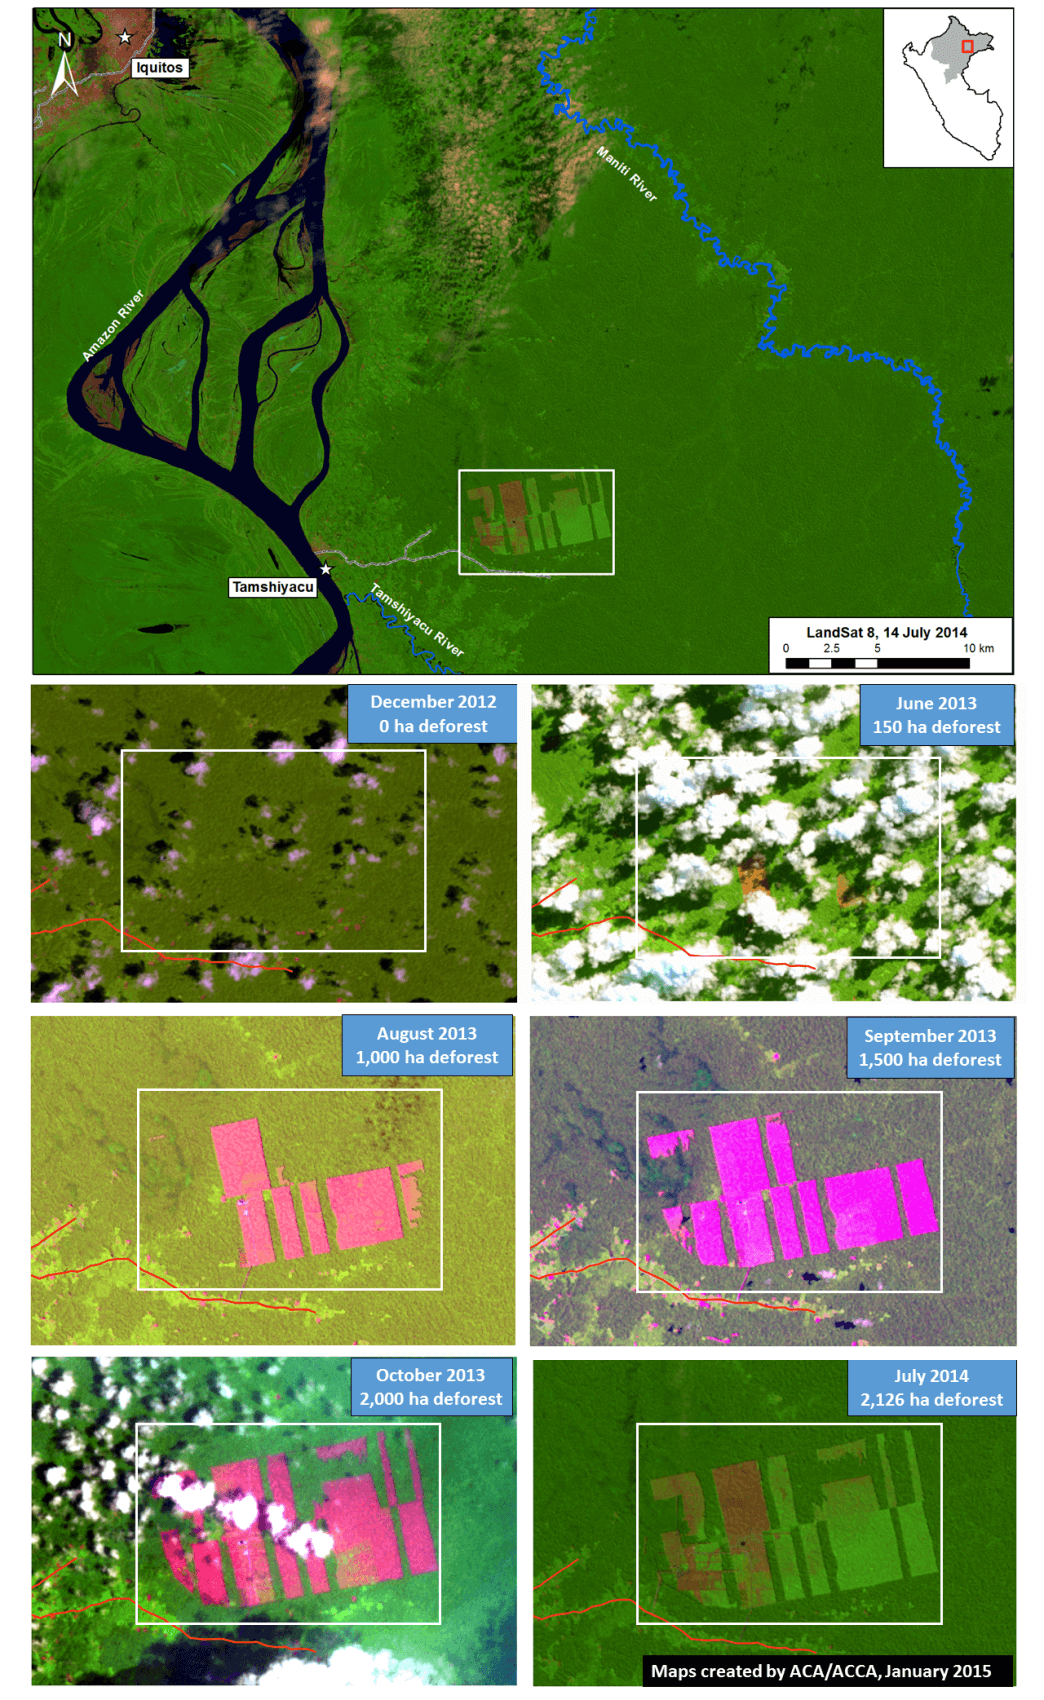
Image 7c provides an enhanced view of the southwestern section of the proposed National Park. It highlights an expanding deforestation cluster — 130 hectares between 2013 and 2014 — on the upper Calleria River (see “A” on the map). Our analysis indicates that illegal coca cultivation is the cause of this deforestation. Panel A shows a high resolution satellite image of this deforestation.
Also note that a new road is being constructed near the southwestern park boundary (see “B” on the map). We presume it to be a logging road because it passes through a forestry concession. Most notably, there was significant new construction in both 2013 and 2014, indicating that the road is in active use. In addition, high resolution imagery (see panel B) shows road width of about 30 meters, indicating that it may be designed for larger vehicles and heavy machinery.
Logging Road Approaching Northwestern Section (Zoom #2)
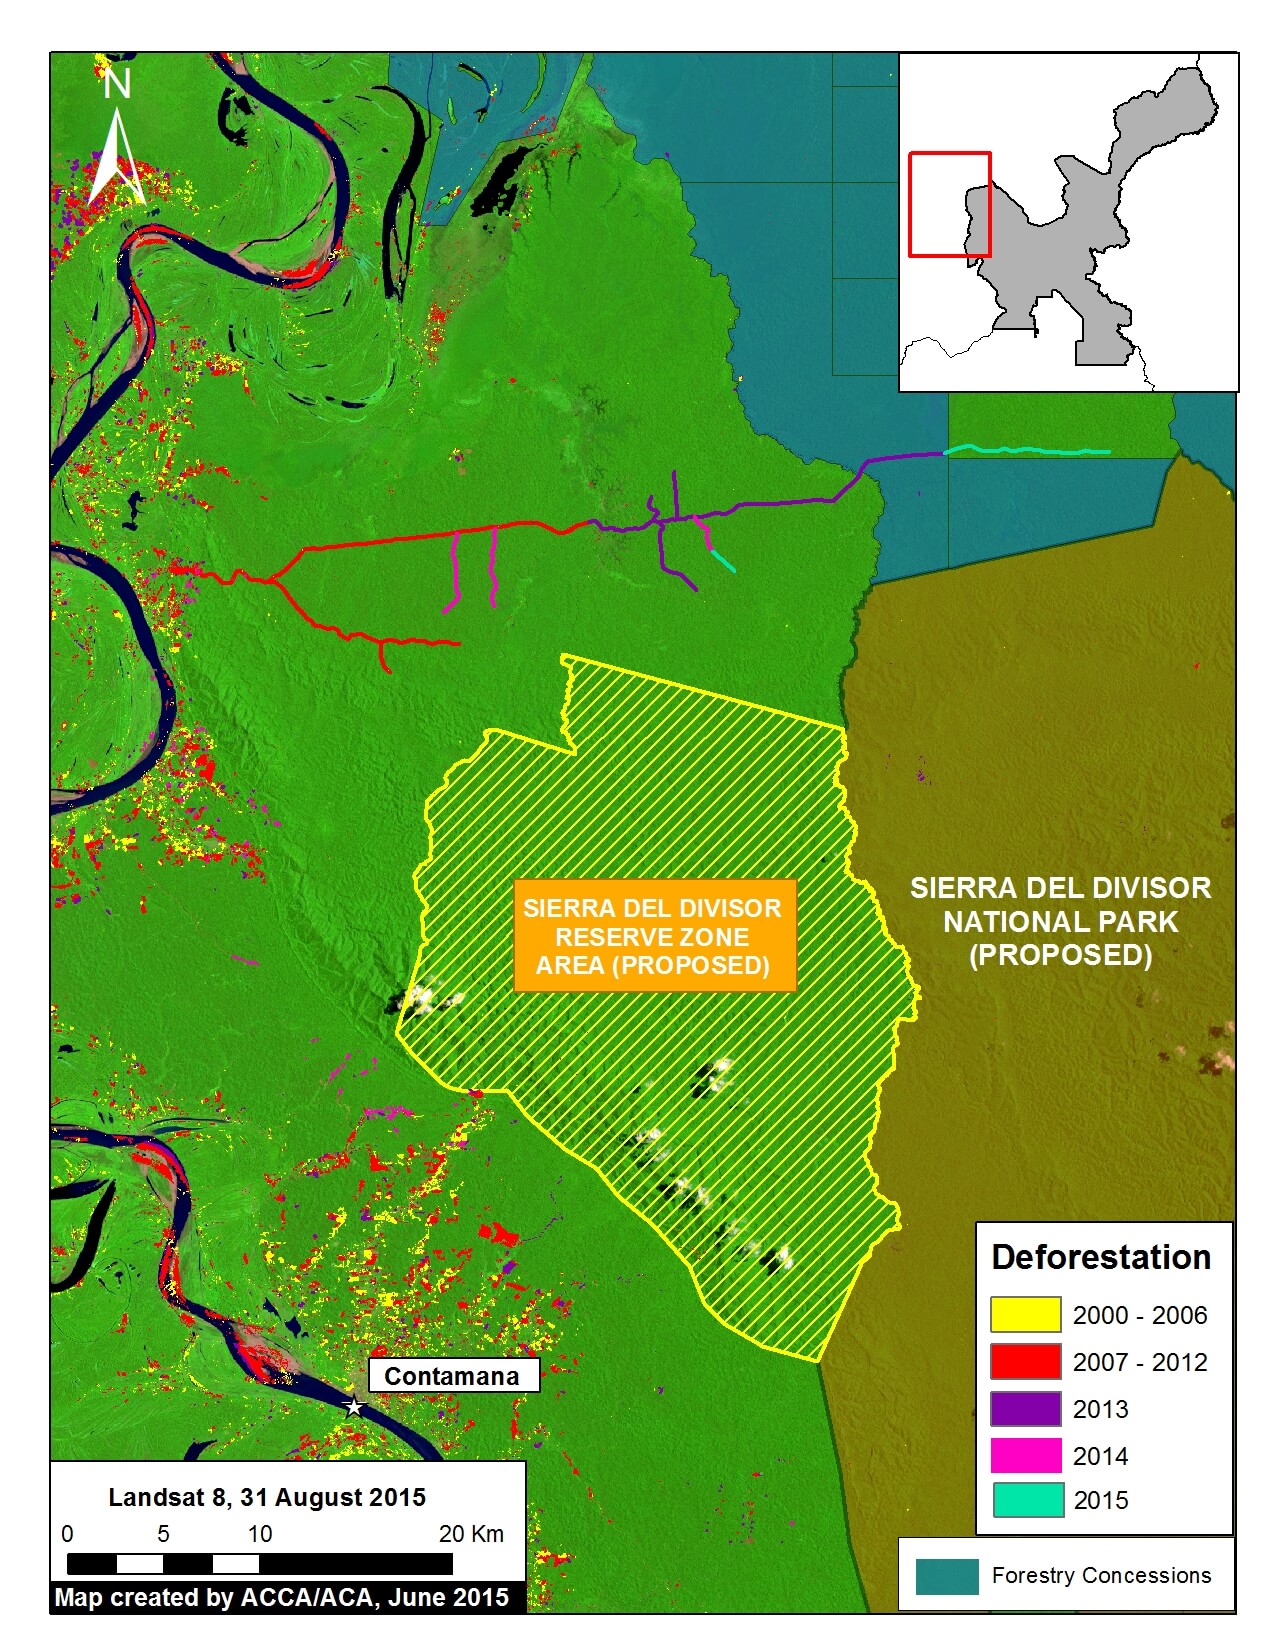
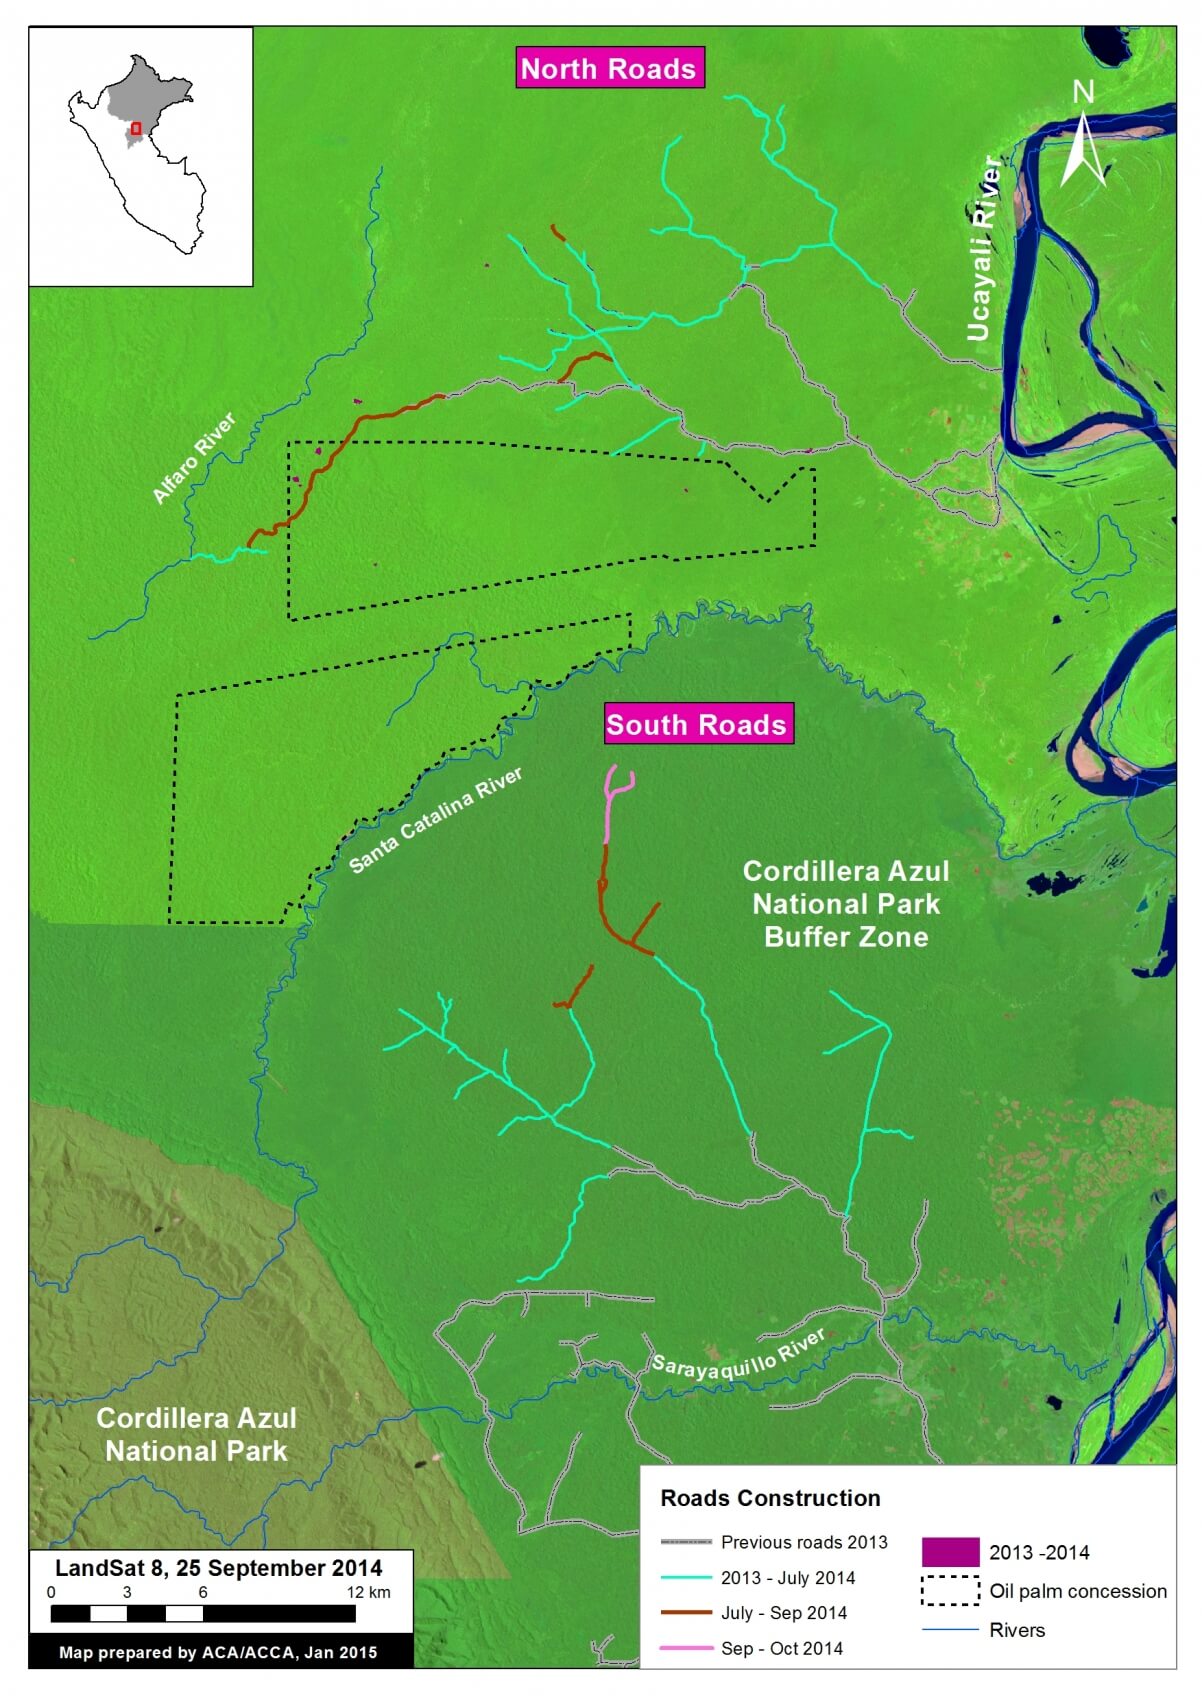
Image 7d provides an enhanced view of the northwestern section of the proposed National Park, showing the construction of another new logging road. We presume that it is a logging road because it is passing through forestry concessions with no other obvious destination. Most notably, there was new construction in 2013, 2014, and 2015 indicating that is an active logging road.
Also note the expanding deforestation, especially in 2014, outside of the town of Contamana, indicating the importance of creating a Regional Conservation Area in this area adjacent to the proposed National Park.
Illegal Logging and Gold Mining in Southeastern Section (Zoom #3)
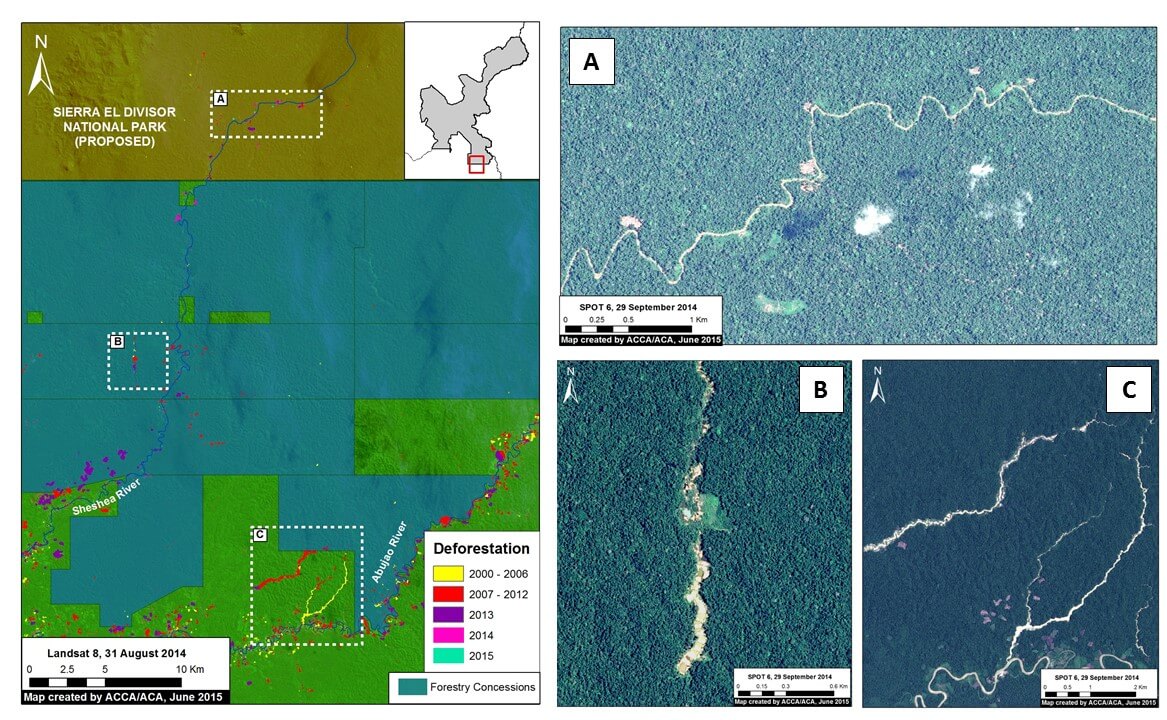
Image 7e provides an enhanced view of the southeastern section of the Proposed National park. It highlights that both illegal logging (see “A” on the map) and gold mining (see “B” and “C” on the map) are present.
It is important to emphasize that this southeast section is part of the Isconahua Territorial Reserve administered by the Ministry of Culture. This is an official land designation in favor of indigenous peoples in isolation, to protect their rights, habitat, and the conditions that ensure their existence and integrity as a people.
Regarding the illegal logging, our analysis indicates the deforestation within the proposed National Park along the upper Shesha River is caused by a series of logging camps. Panel A shows a high resolution satellite image of this deforestation. This illegal logging is within the Isconahua Territorial Reserve.
Regarding the gold mining, there are two principal zones causing deforestation, one along the Shesha River and the other along the Abujao River. Panels B and C show high resolution images of these two mining areas. The headwaters of both river systems are born in the proposed park.
SERNANP Response
In response to this article, SERNANP (the Peruvian protected areas agency) issued this statement:
La Zona Reservada Sierra del Divisor es un espacio de carácter transitorio a cargo del Servicio Nacional de Áreas Naturales Protegidas por el Estado (SERNANP). La zona aledaña a esta área acoge a 14 Comunidades Nativas, las cuales aprovechan los servicios ecosistémicos en beneficio de más de 500 familias.
En los últimos años la ZRSD ha logrado mejores resultados en su lucha contra la tala ilegal enfrentando esta amenaza sobre todo en espacios de ámbito de las reservas territoriales, y continúa alerta por la deforestación asociada al cultivo ilícito de coca que se reporta en esta parte del país.
En ese marco, se ha reportado desde el 2011 a los sectores correspondientes para su incorporación dentro del Plan Anual de Reducción del Espacio Cocalero de tal forma que se haga frente a esta amenaza de manera estratégica.
Data Description:
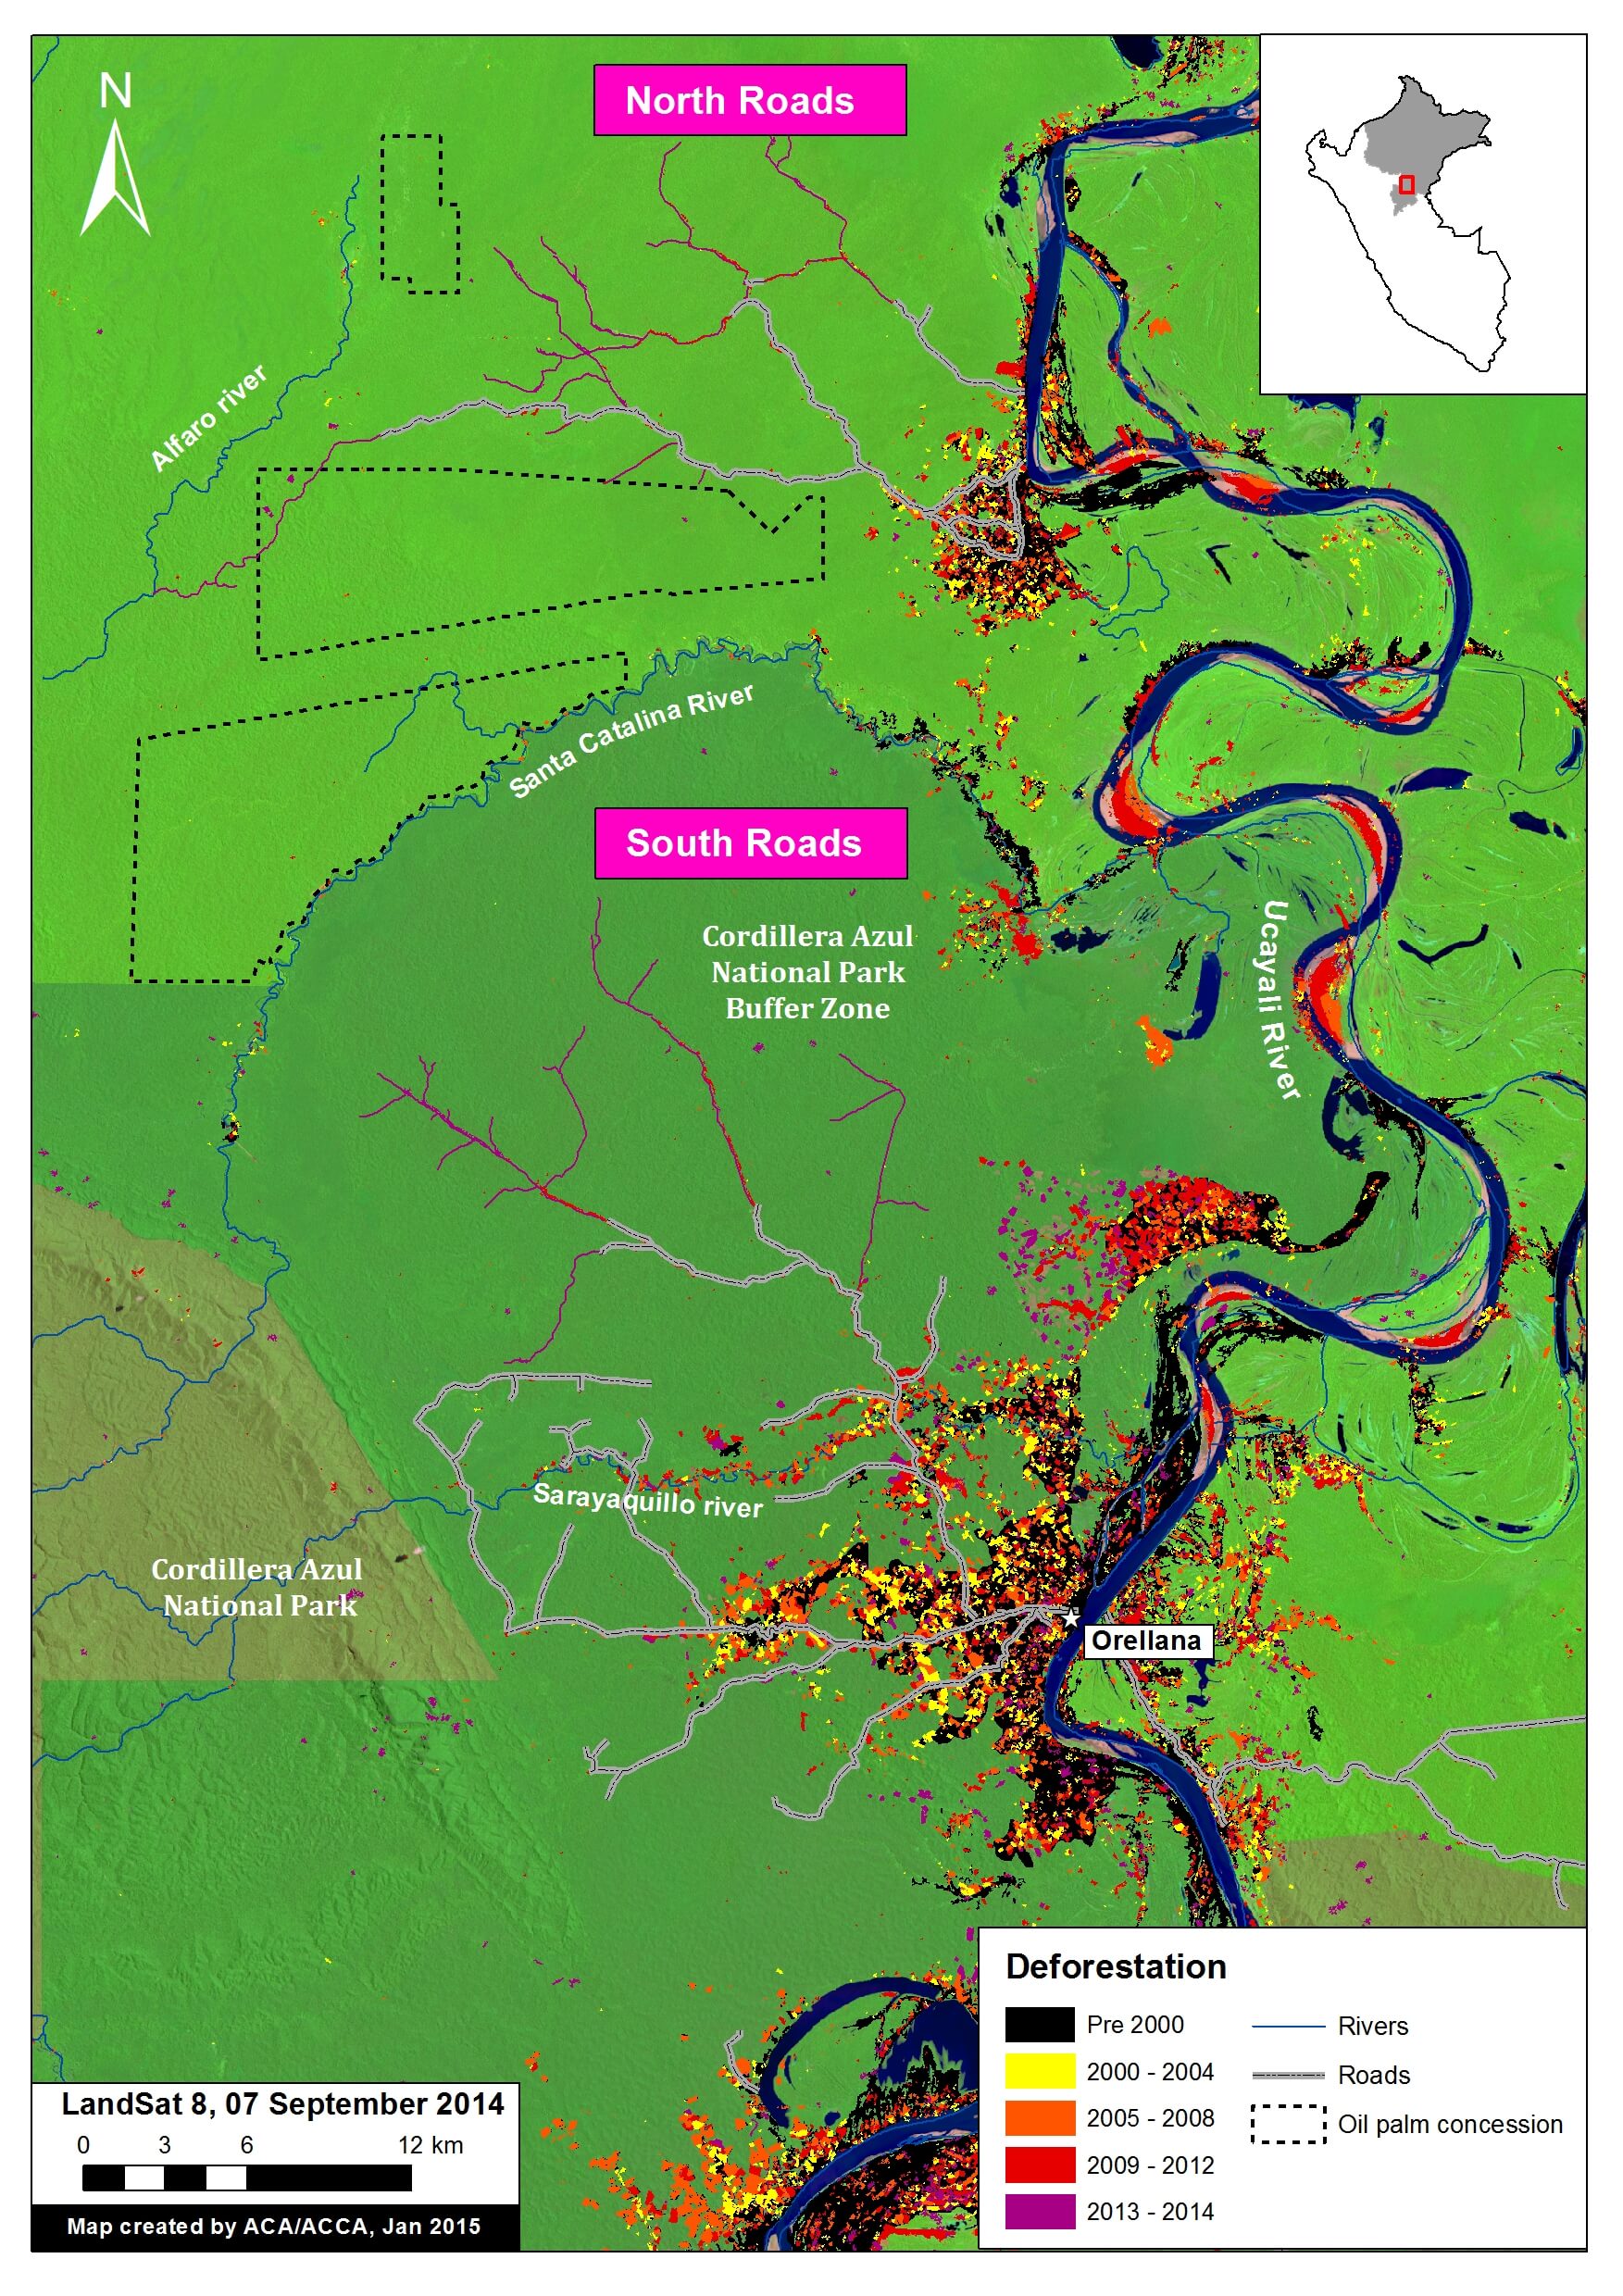
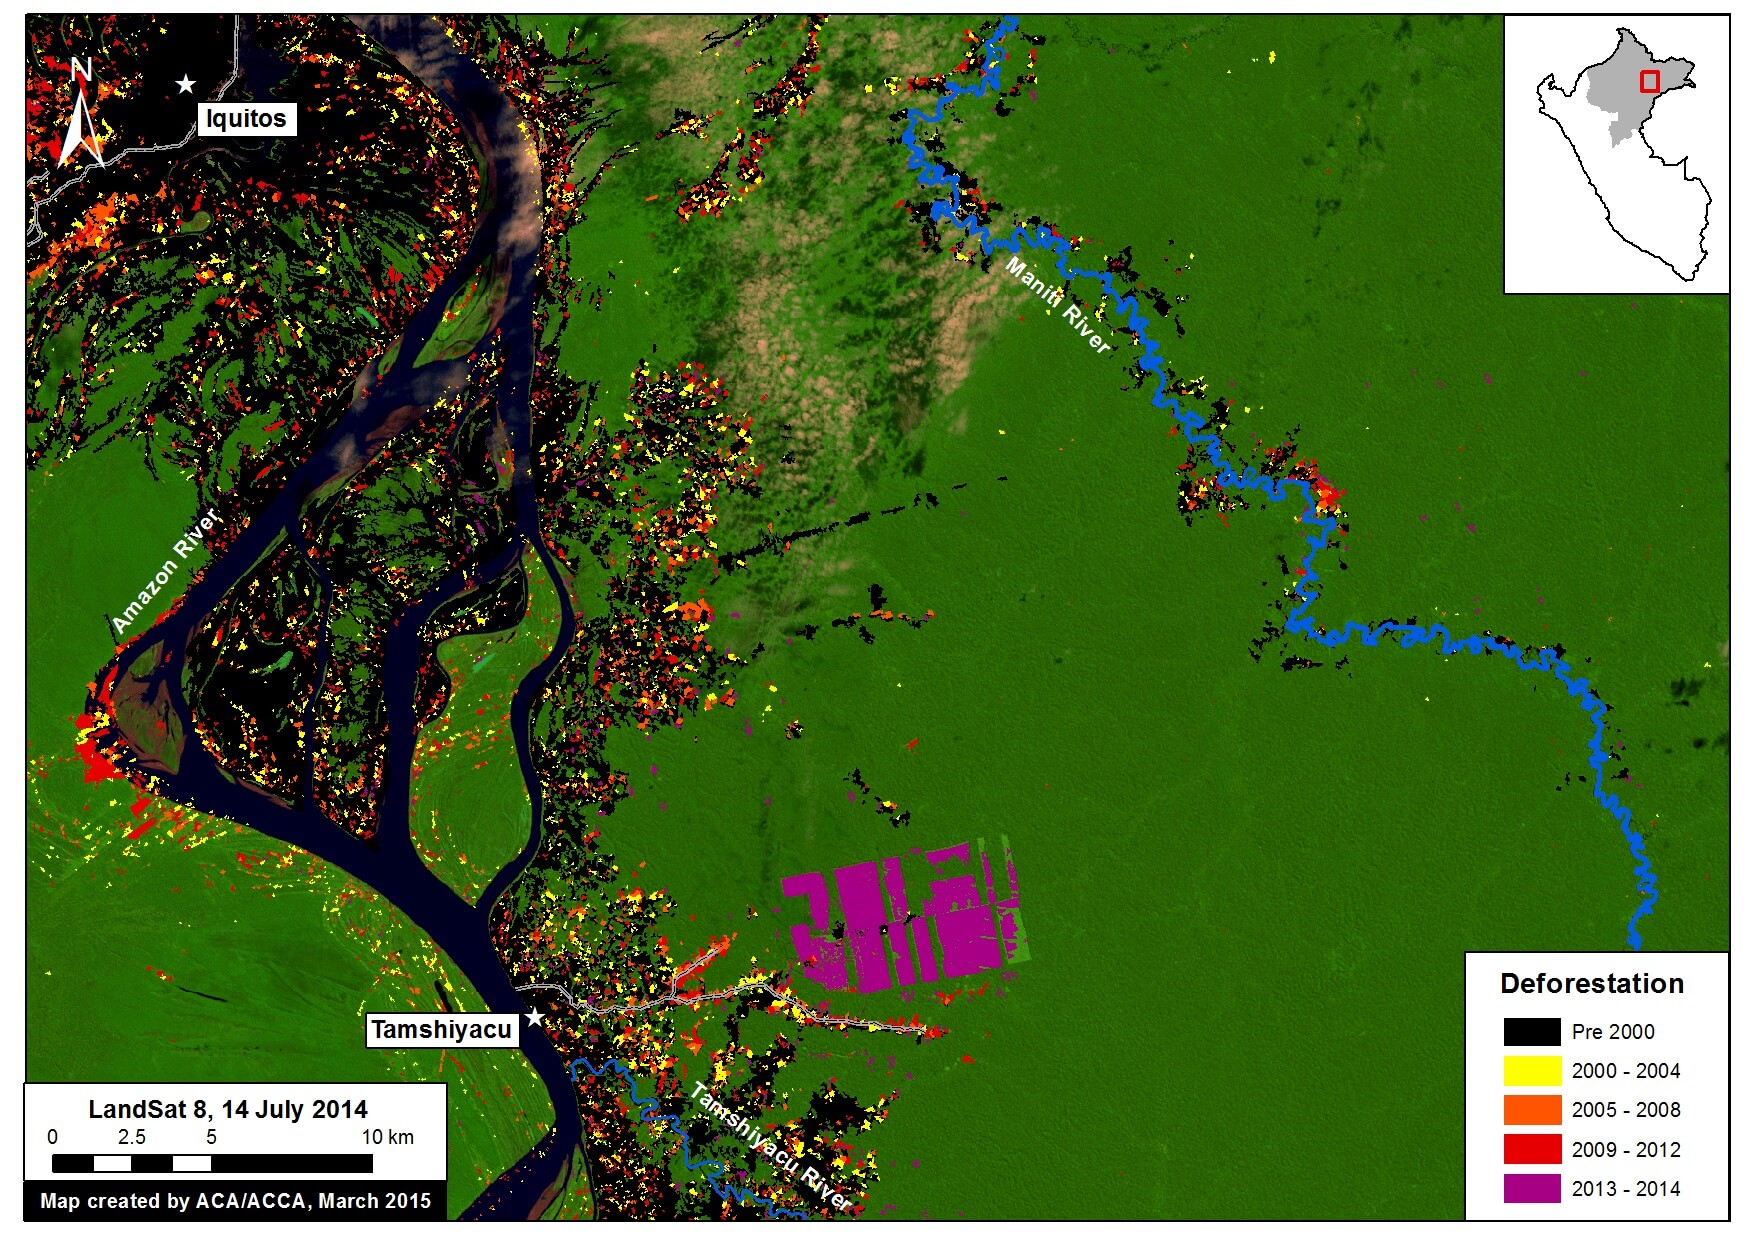
Background map is a mosaic of four Landsat 8 images (30 m resolution) from August and September 2014. Any variation of green indicates forest cover. Note there is some scattered cloud cover. Data is from USGS.
Protected areas are darker green. Data for the proposed Sierra del Divisor National Park comes from its technical document (expediente técnico).
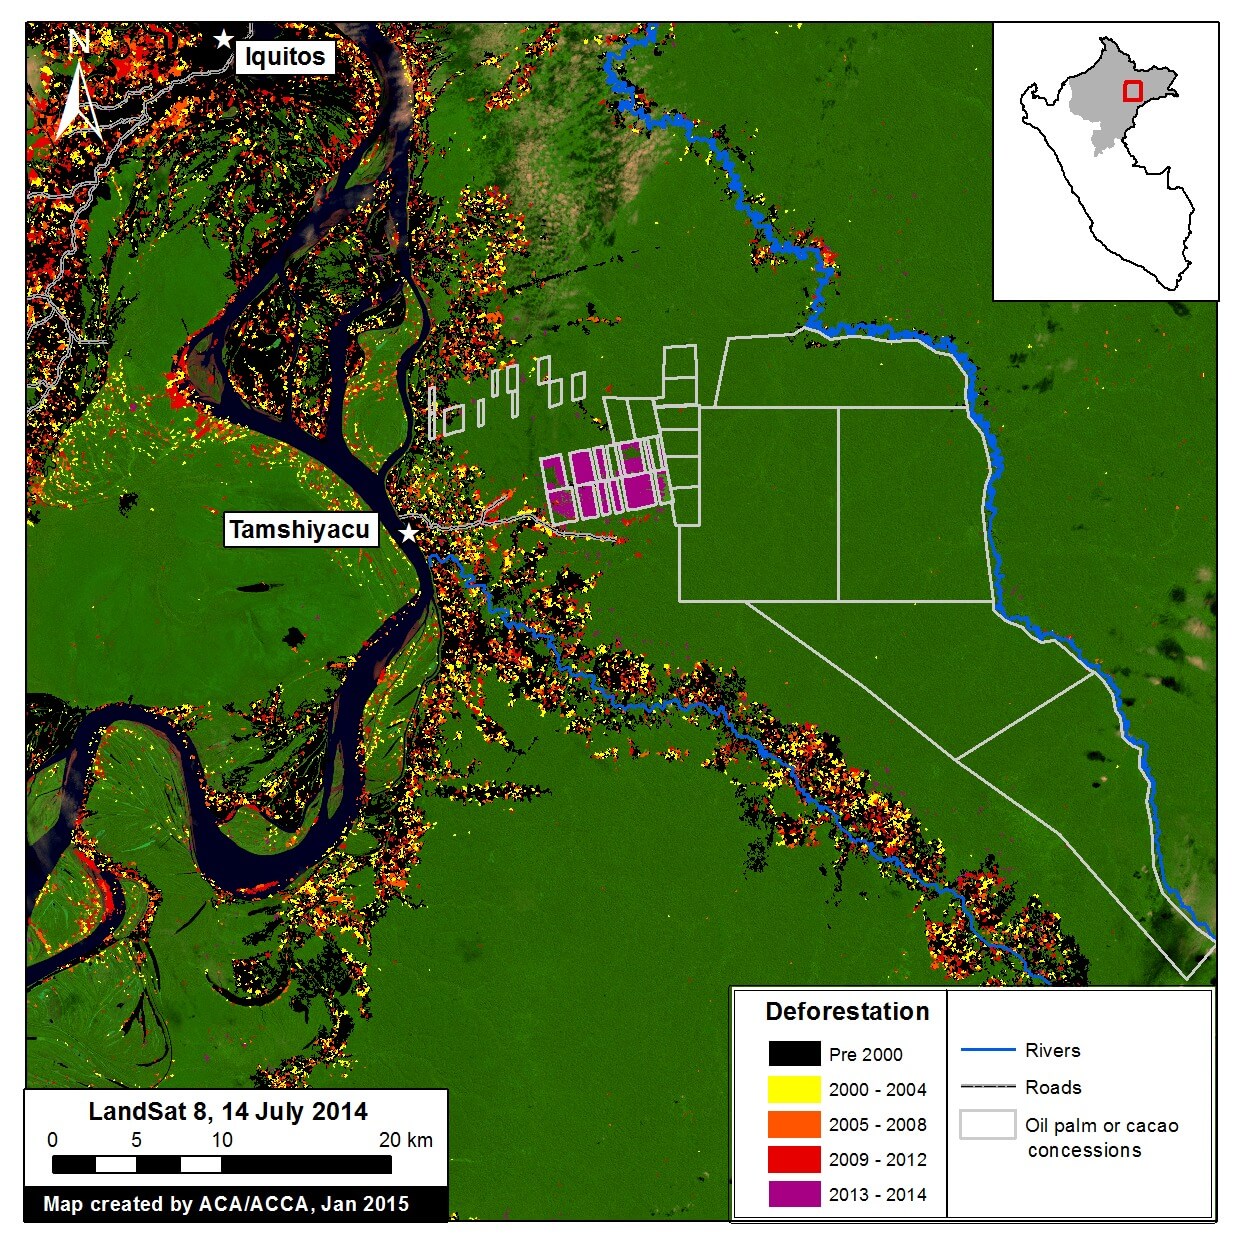
Black indicates areas that were deforested as of 2000 according to data from the Peruvian Environment Ministry (MINAM 2009). Yellow (2000-2006), red (2007-2012), and purple (2013) indicate areas that were deforested from 2000 to 2013 according to data published by Hansen et al. 2013 (Science 342: 850–53; Data download).
Pink and teal indicate areas that were deforested between 2014 and early 2015 based on our analysis of Landsat imagery using CLASlite forest monitoring software.
Citation
Finer M, Novoa S (2015) Sierra del Divisor: Growing Threats Highlight Importance of Creating National Park. MAAP Image #7. Link: https://maaproject.org/2015/06/image-7-sierra-del-divisor/
 Loading...