Image #15: Sierra Del Divisor – New Logging Road Threatens Northern Section of Proposed National Park

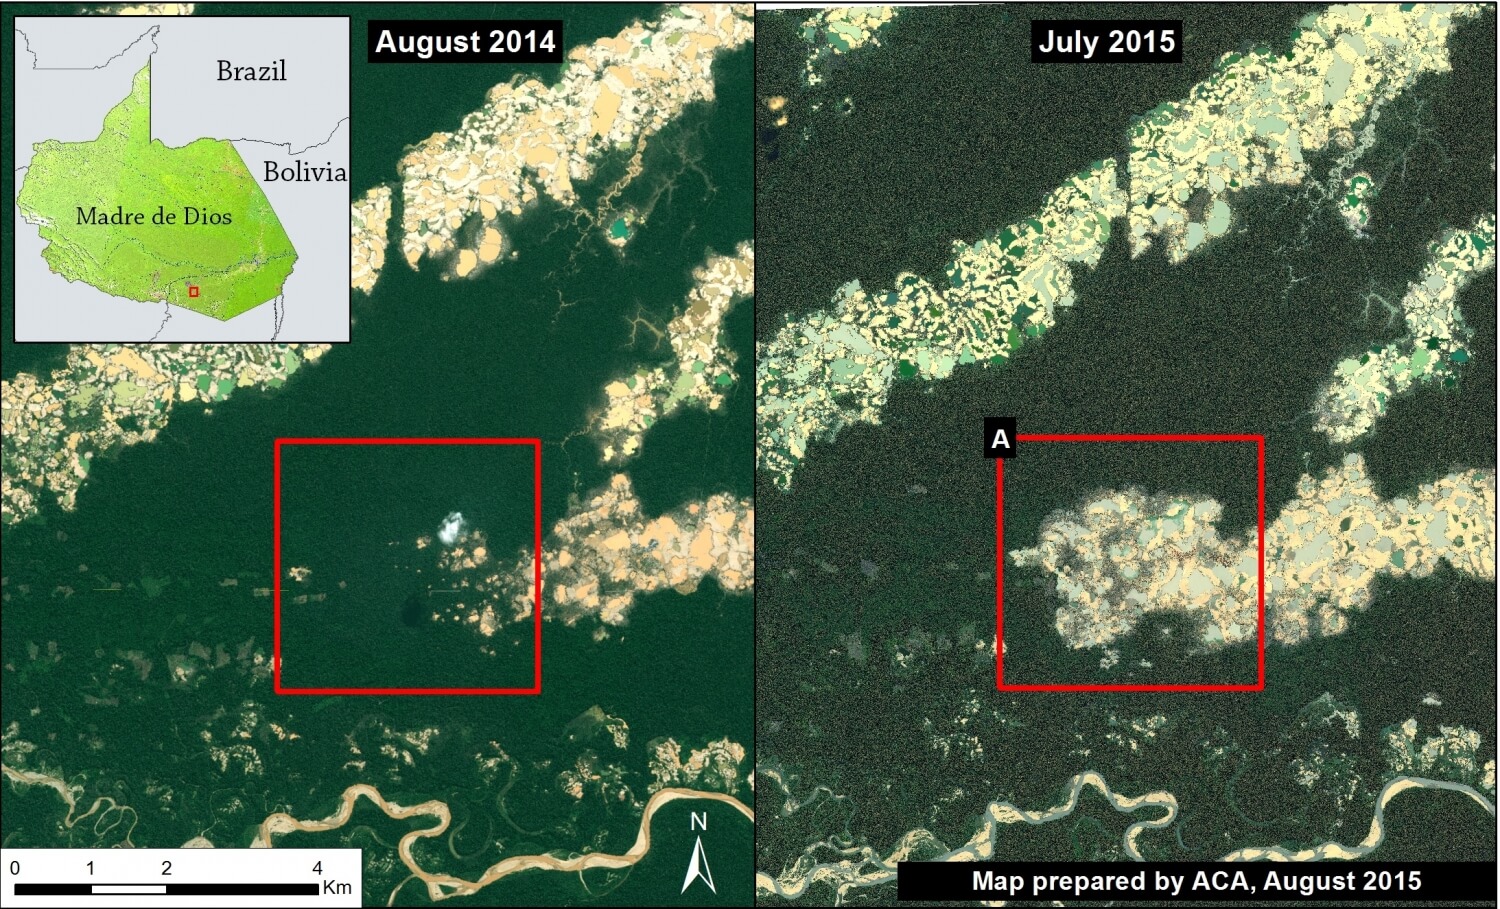
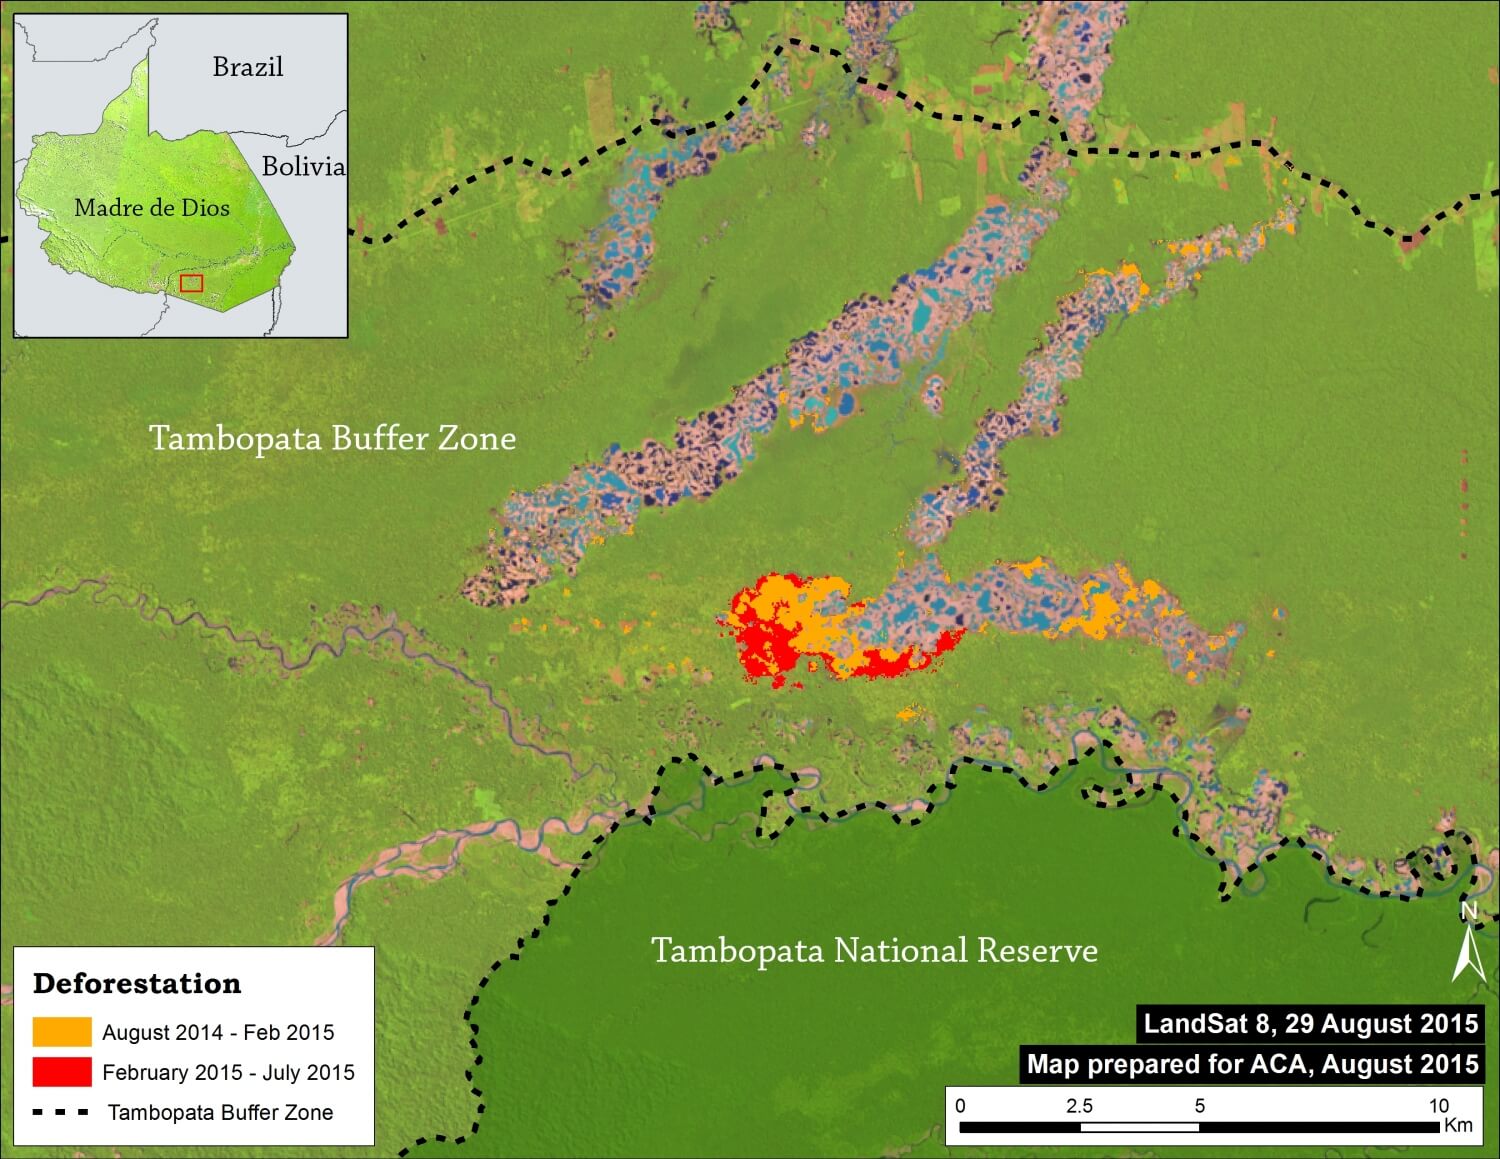
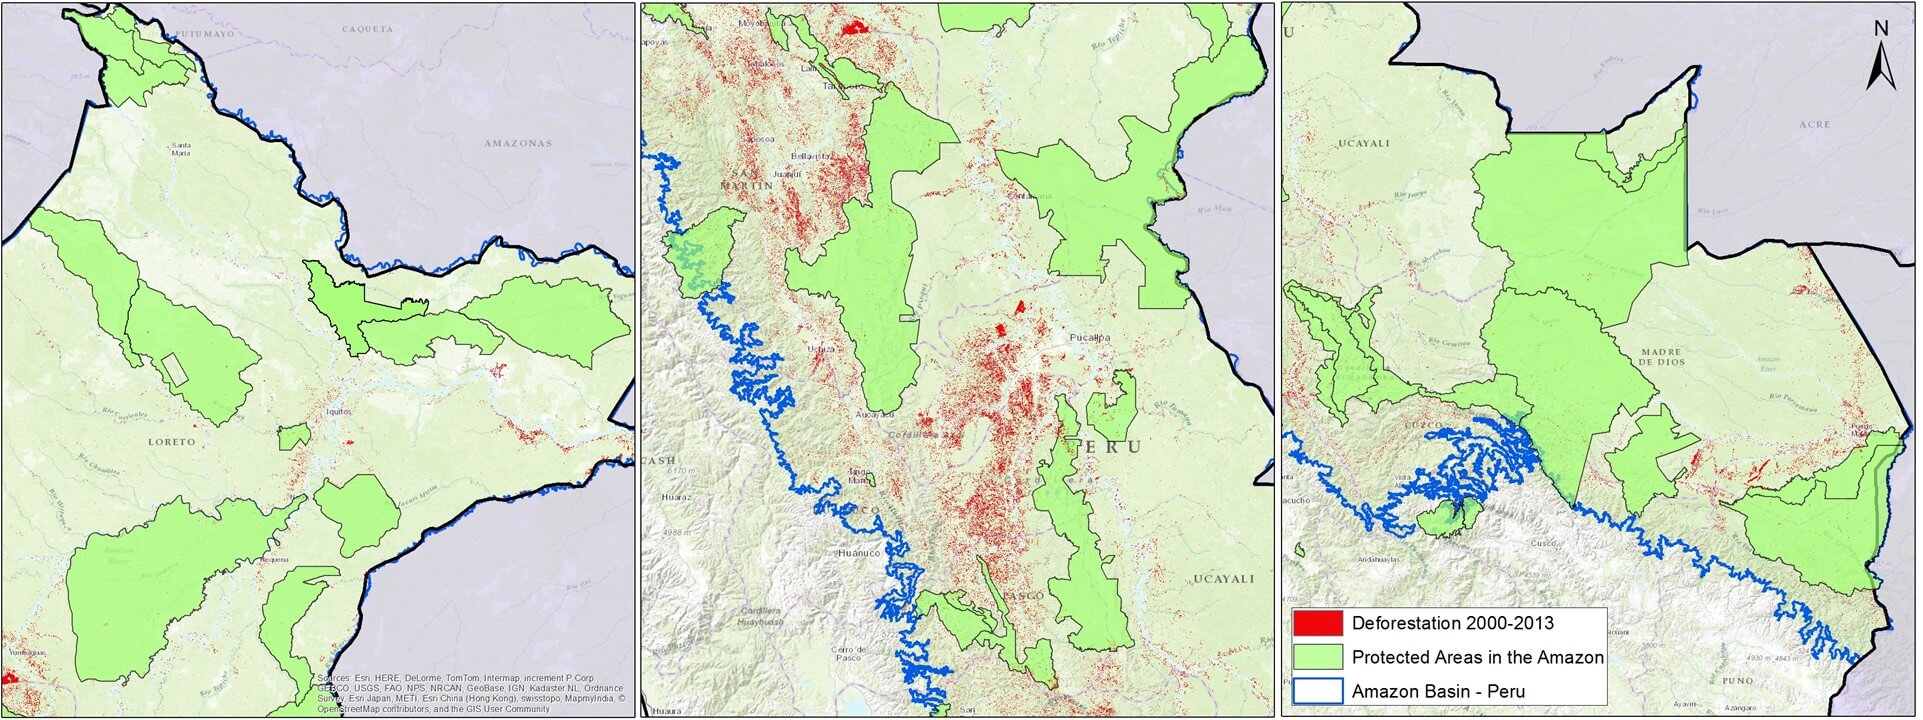
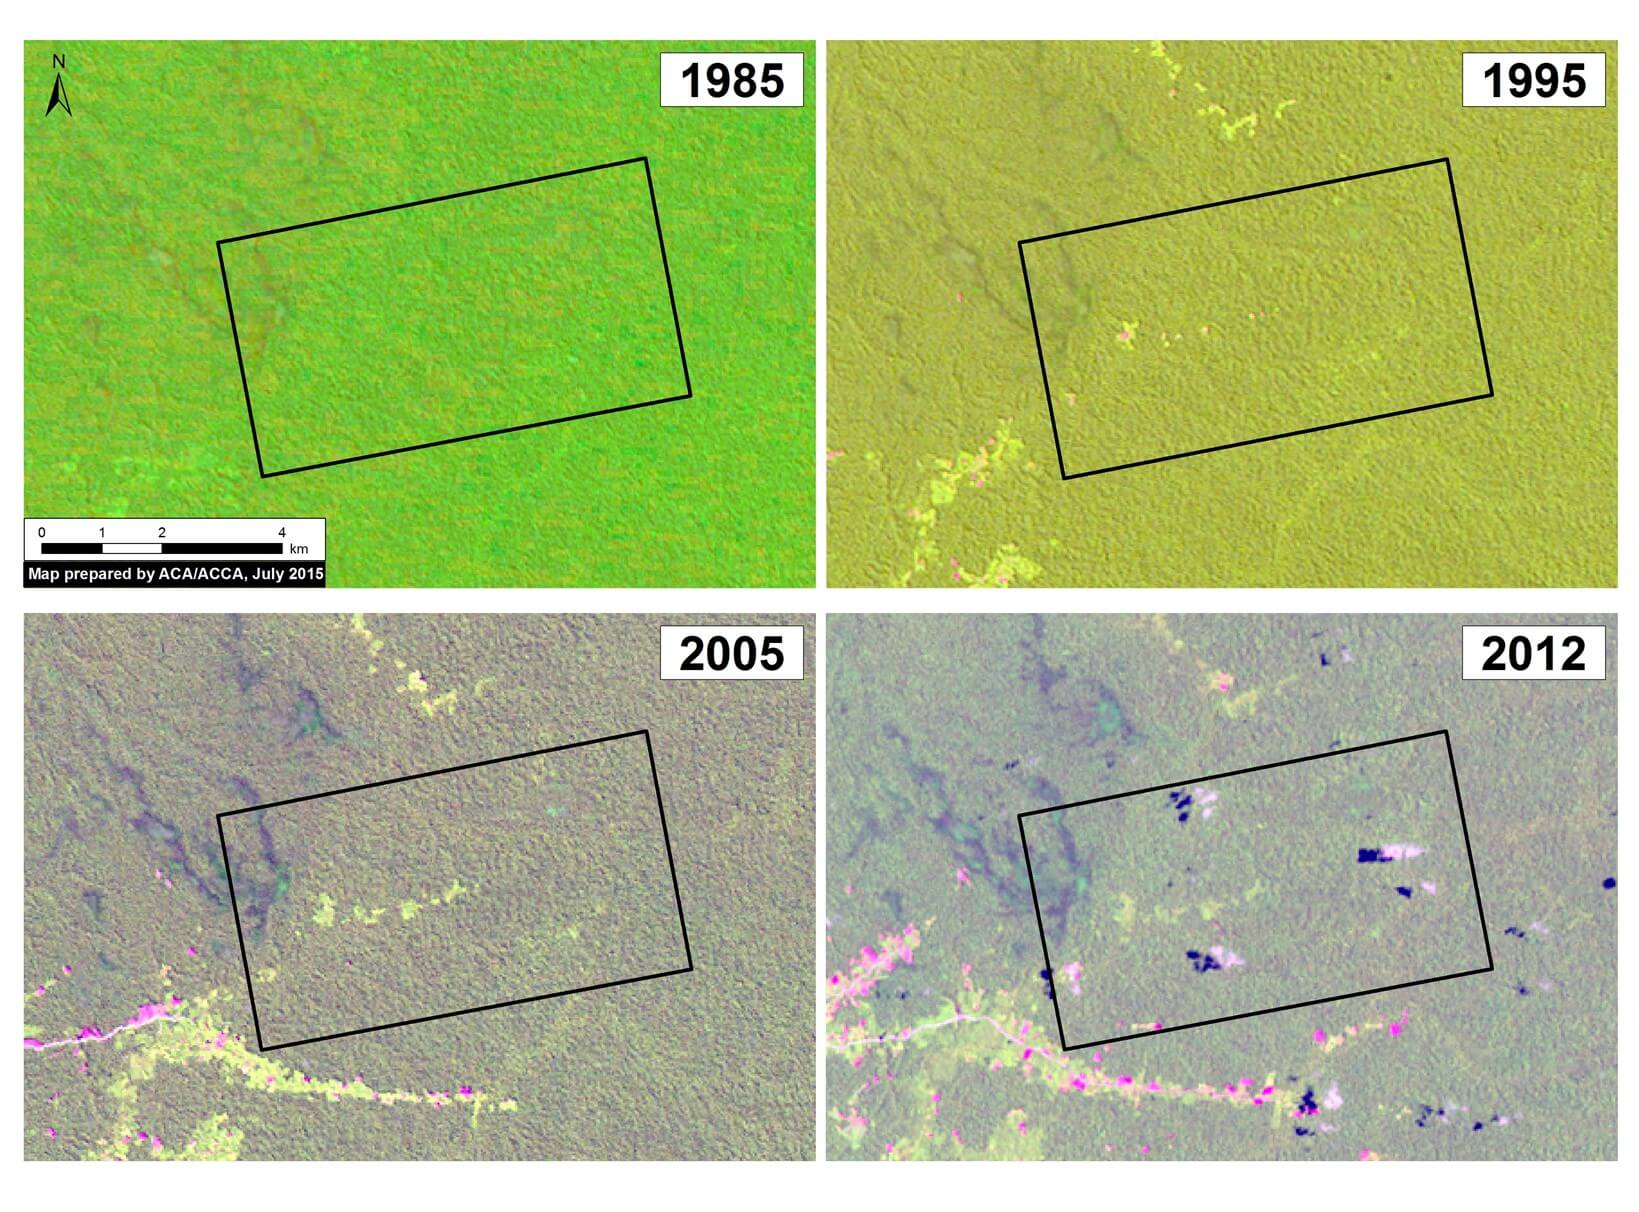
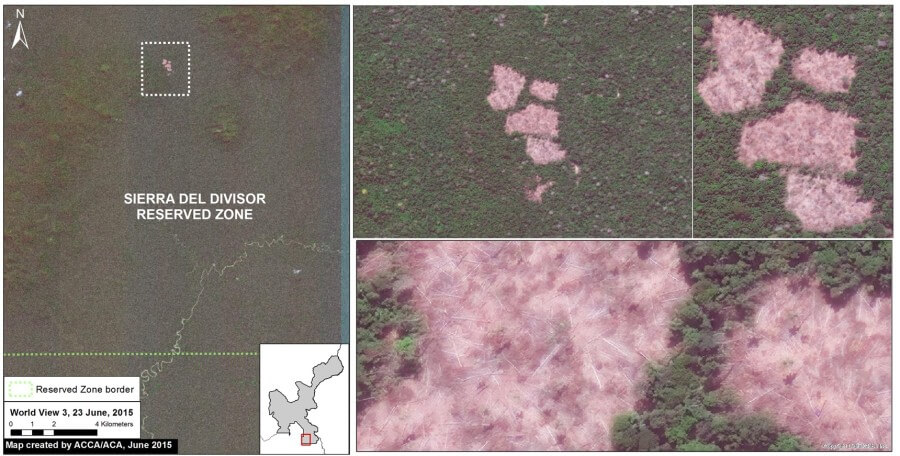
In MAAP #7, we emphasized the need to promote the Sierra del Divisor Reserved Zone to the category of National Park due to the growing threats within and around the area. Here in MAAP #15, we show how the construction of a new logging road threatens the northwest section of the current Reserved Zone. New high-resolution images reveal that the construction of this logging road has continued to expand in 2015, and now even crosses a corner of the Reserve.

In addition, in anticipation of the upcoming visit of Peruvian President Ollanta Humala to the United Nations in New York to discuss climate change, we present data on the levels of carbon stored in the proposed Sierra del Divisor National Park.

Image 15a. Landsat (30 m res) images of the new logging road crossing the Sierra del Divisor Reserved Zone. Data: USGS, SERNANP

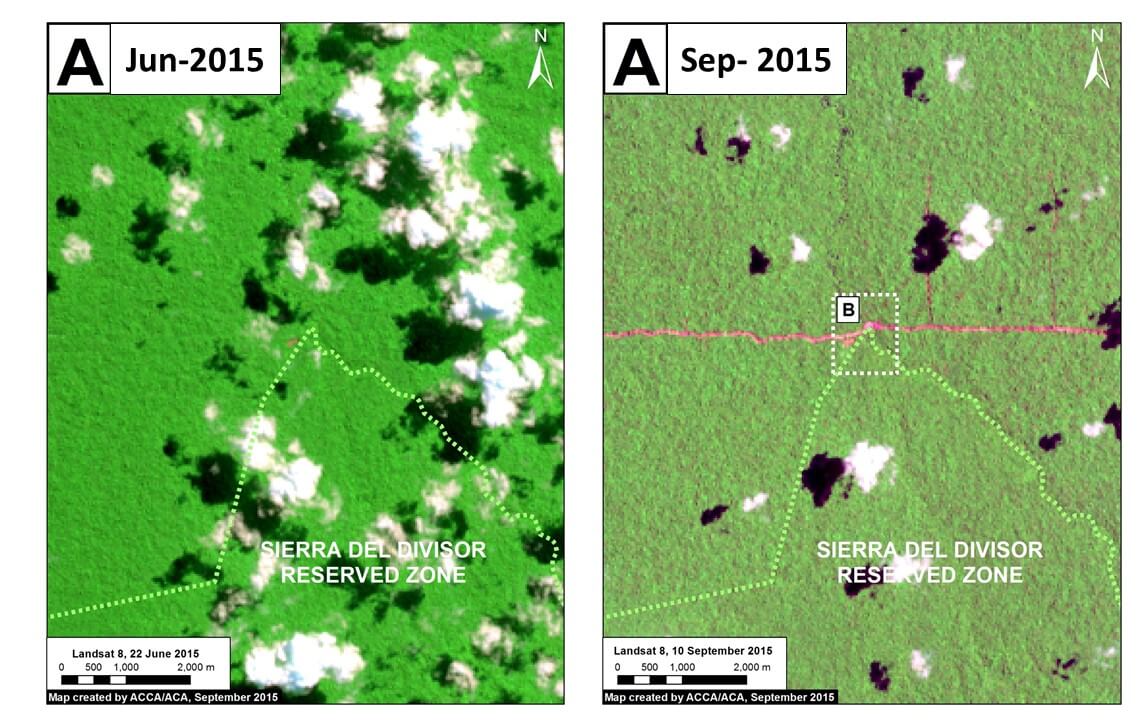
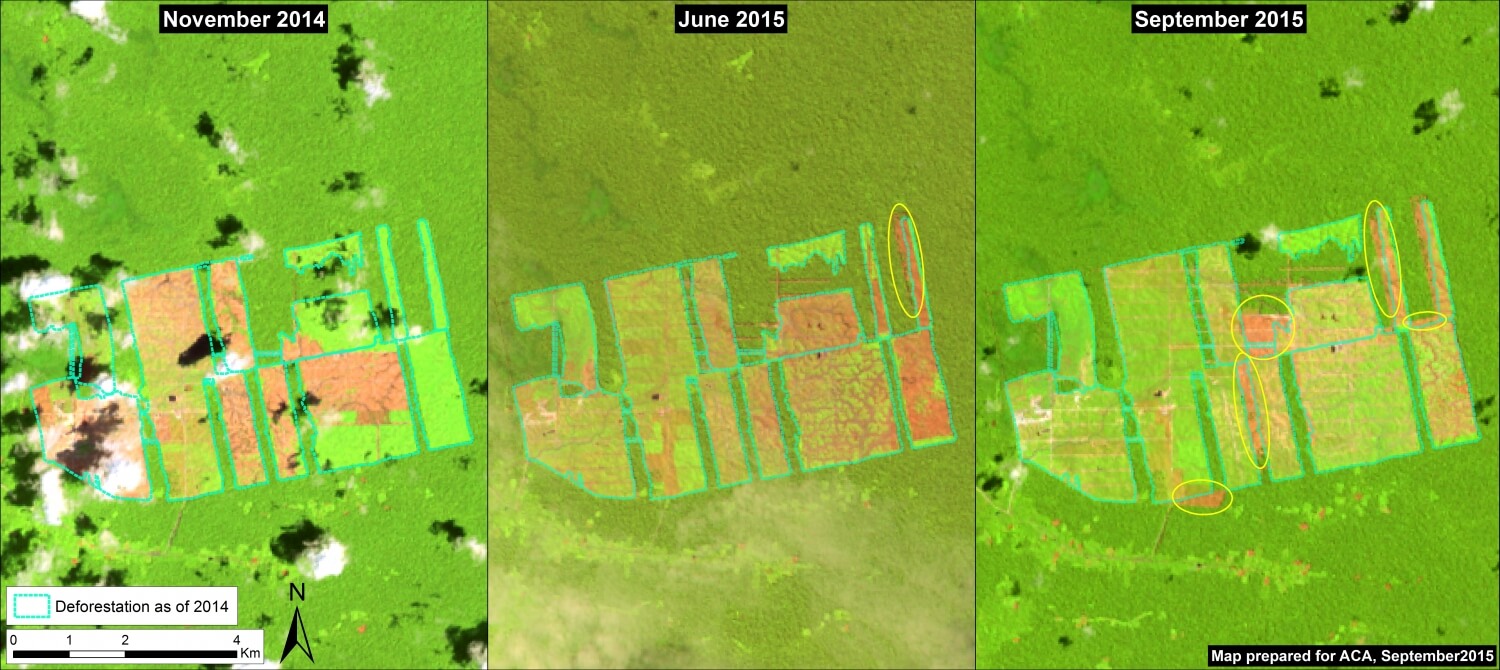
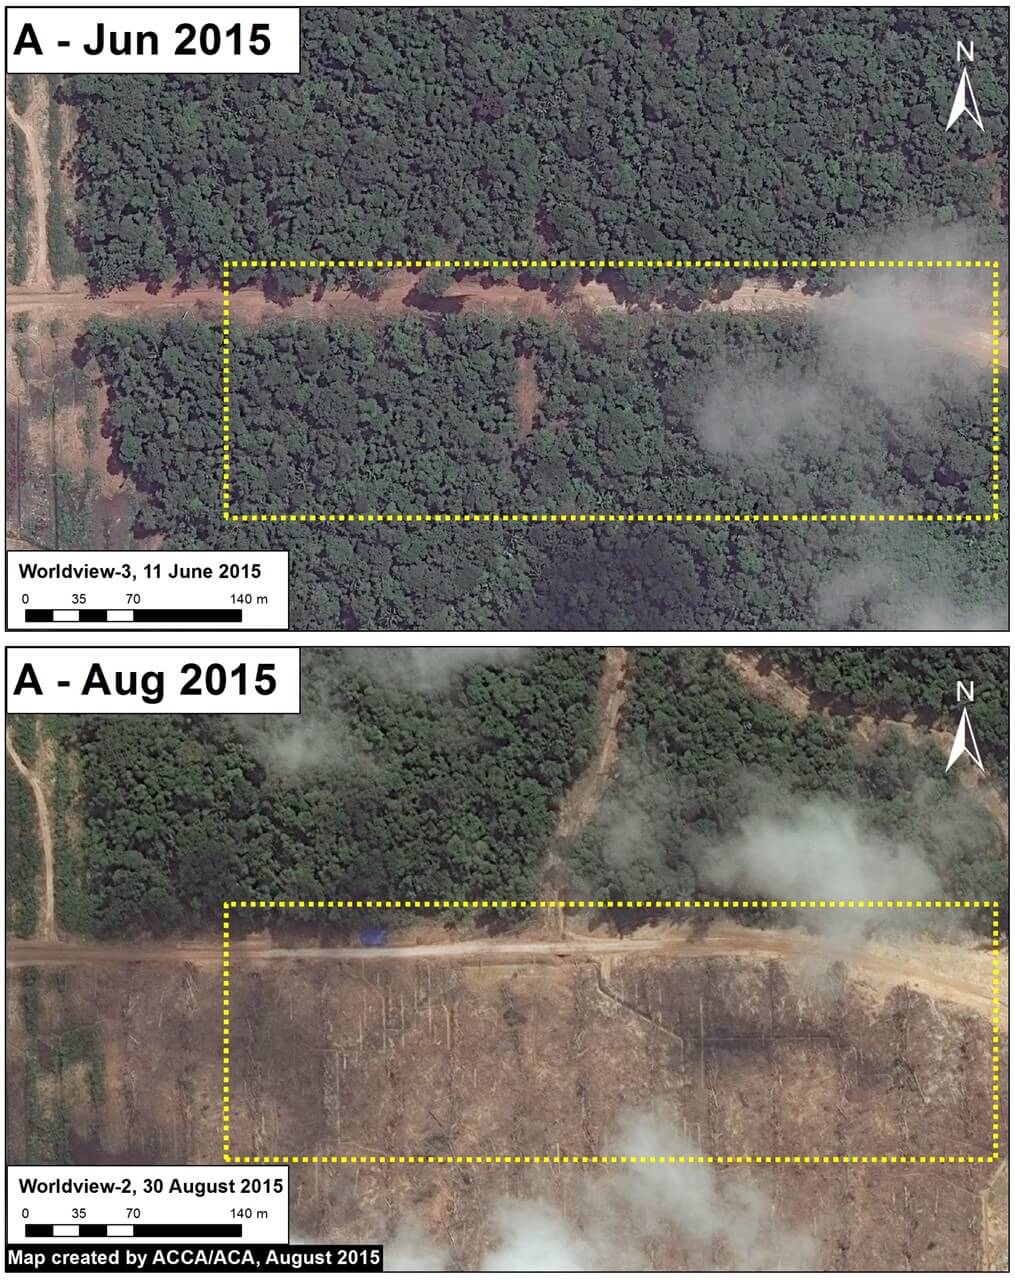
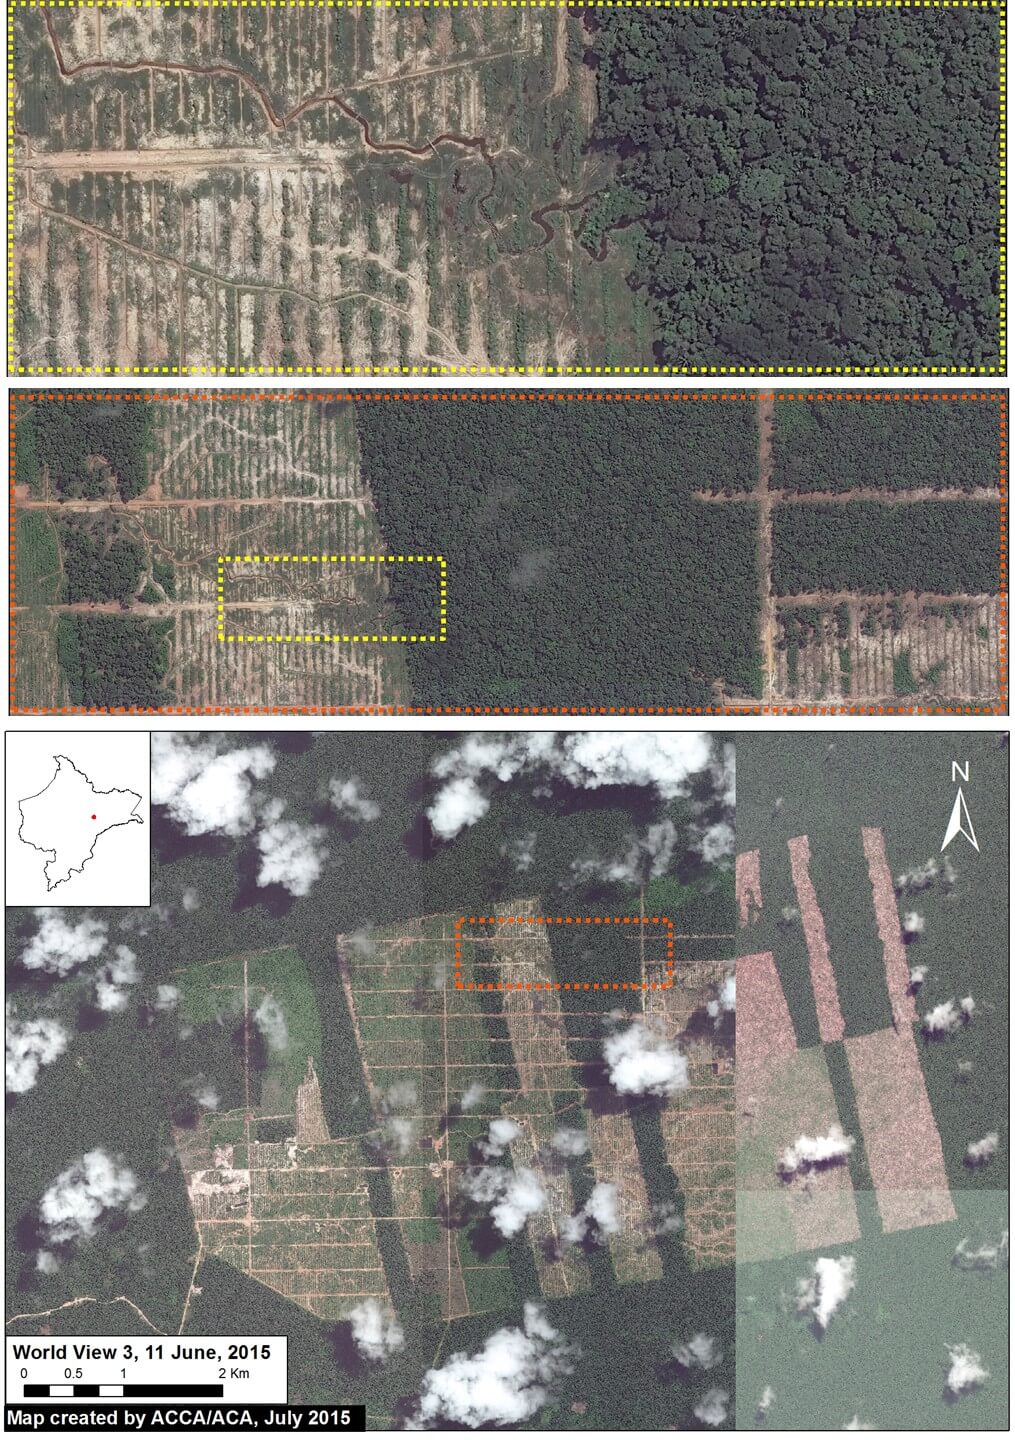
Image 15a shows the most recent expansion of the logging road between June (left panel) and September (right panel) 2015. For more context, note that the area displayed in Image 15a corresponds to the dashed box marked with the letter “A” in Image 15c.

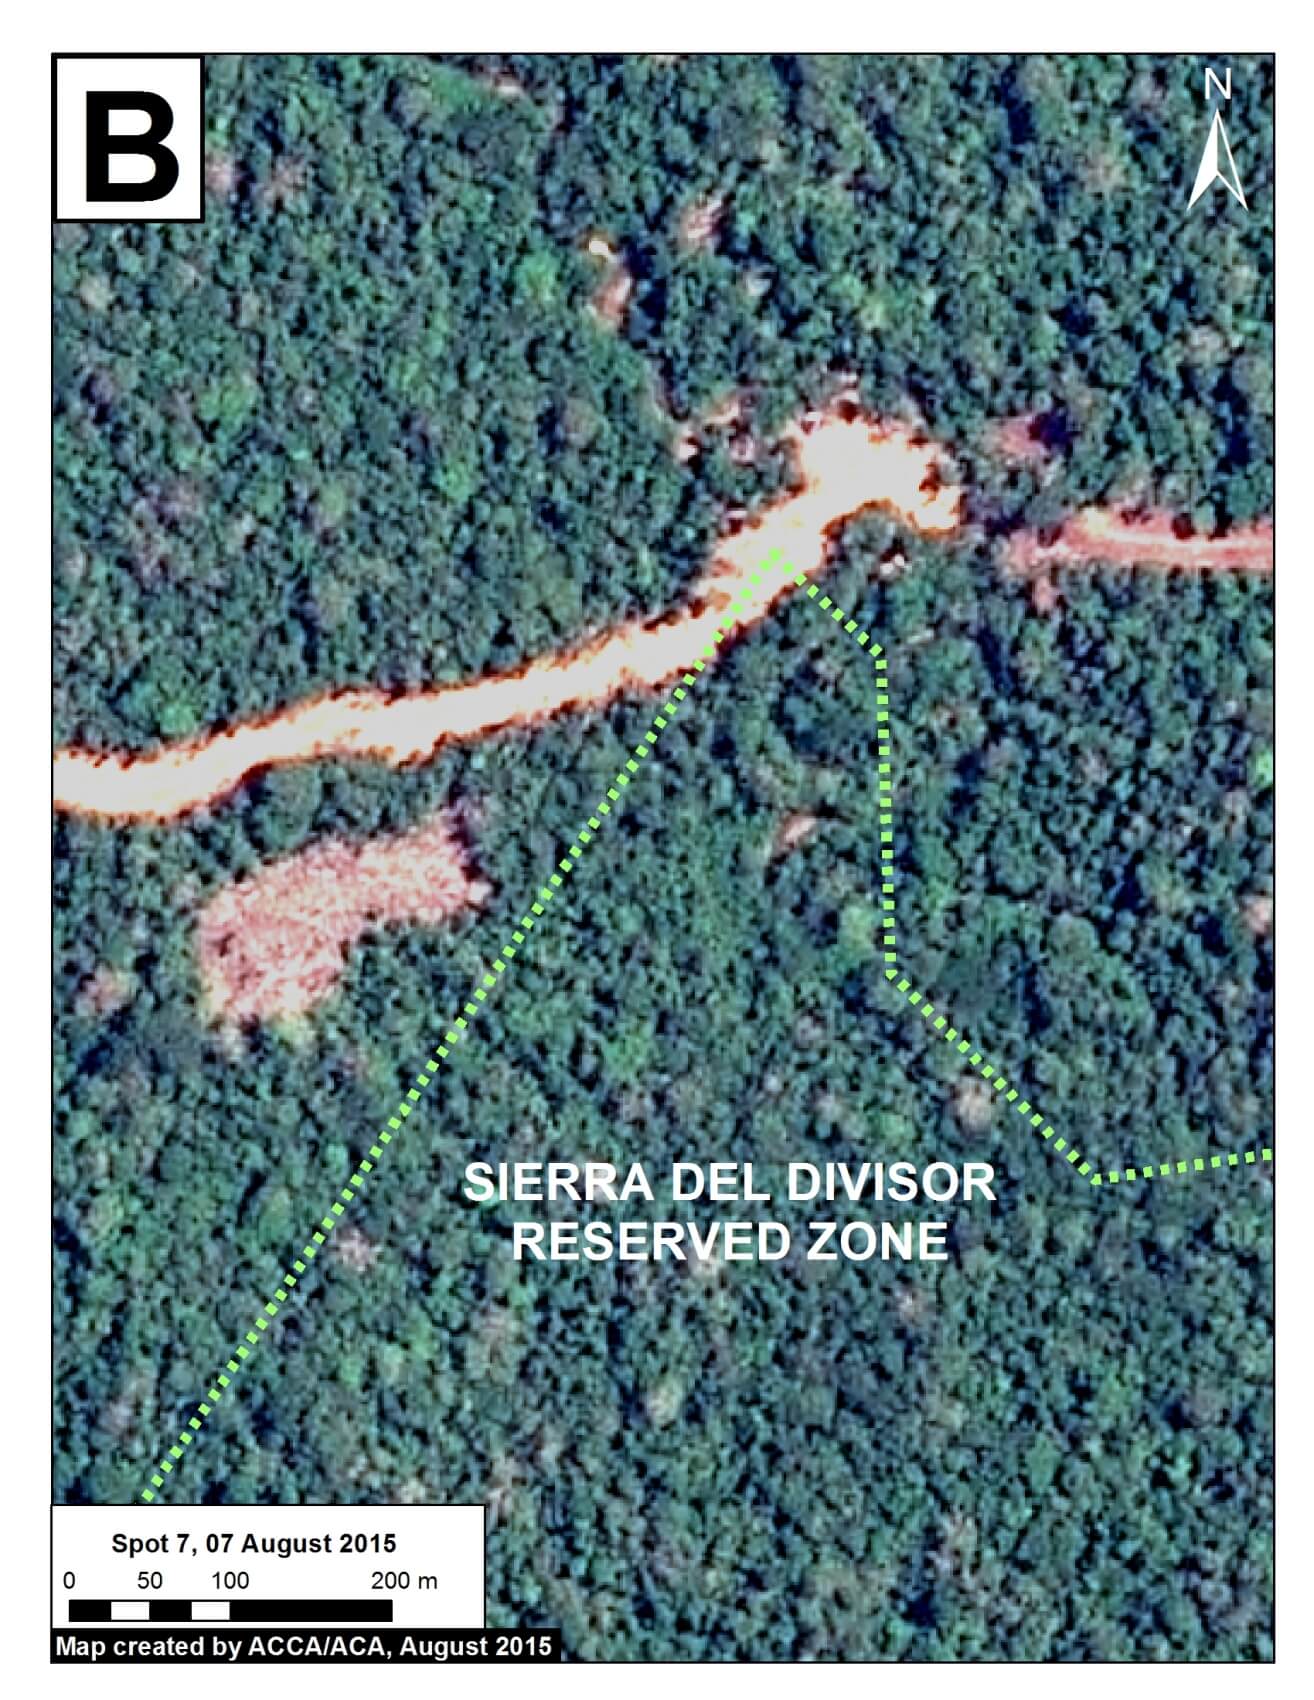
Image 15b displays a high-resolution (1.5 m) image from August 7 of the section of road crossing the northern section of the Sierra del Divisor Reserved Zone.

Image 15b. High-resolution image of logging road crossing northern tip of Reserved Zone. Data: SPOT 7 Airbus.

Expansion 2012 – 2015

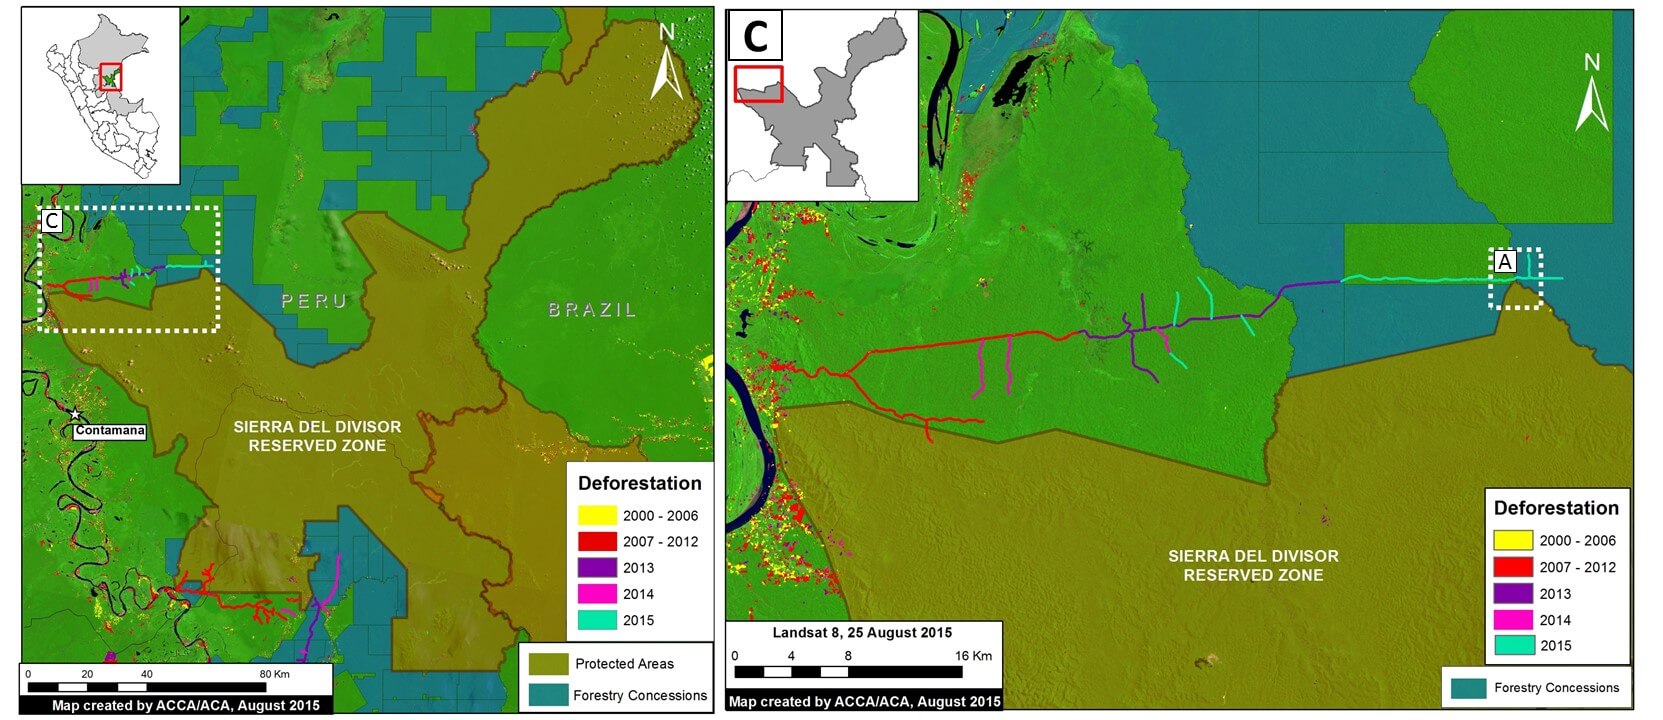
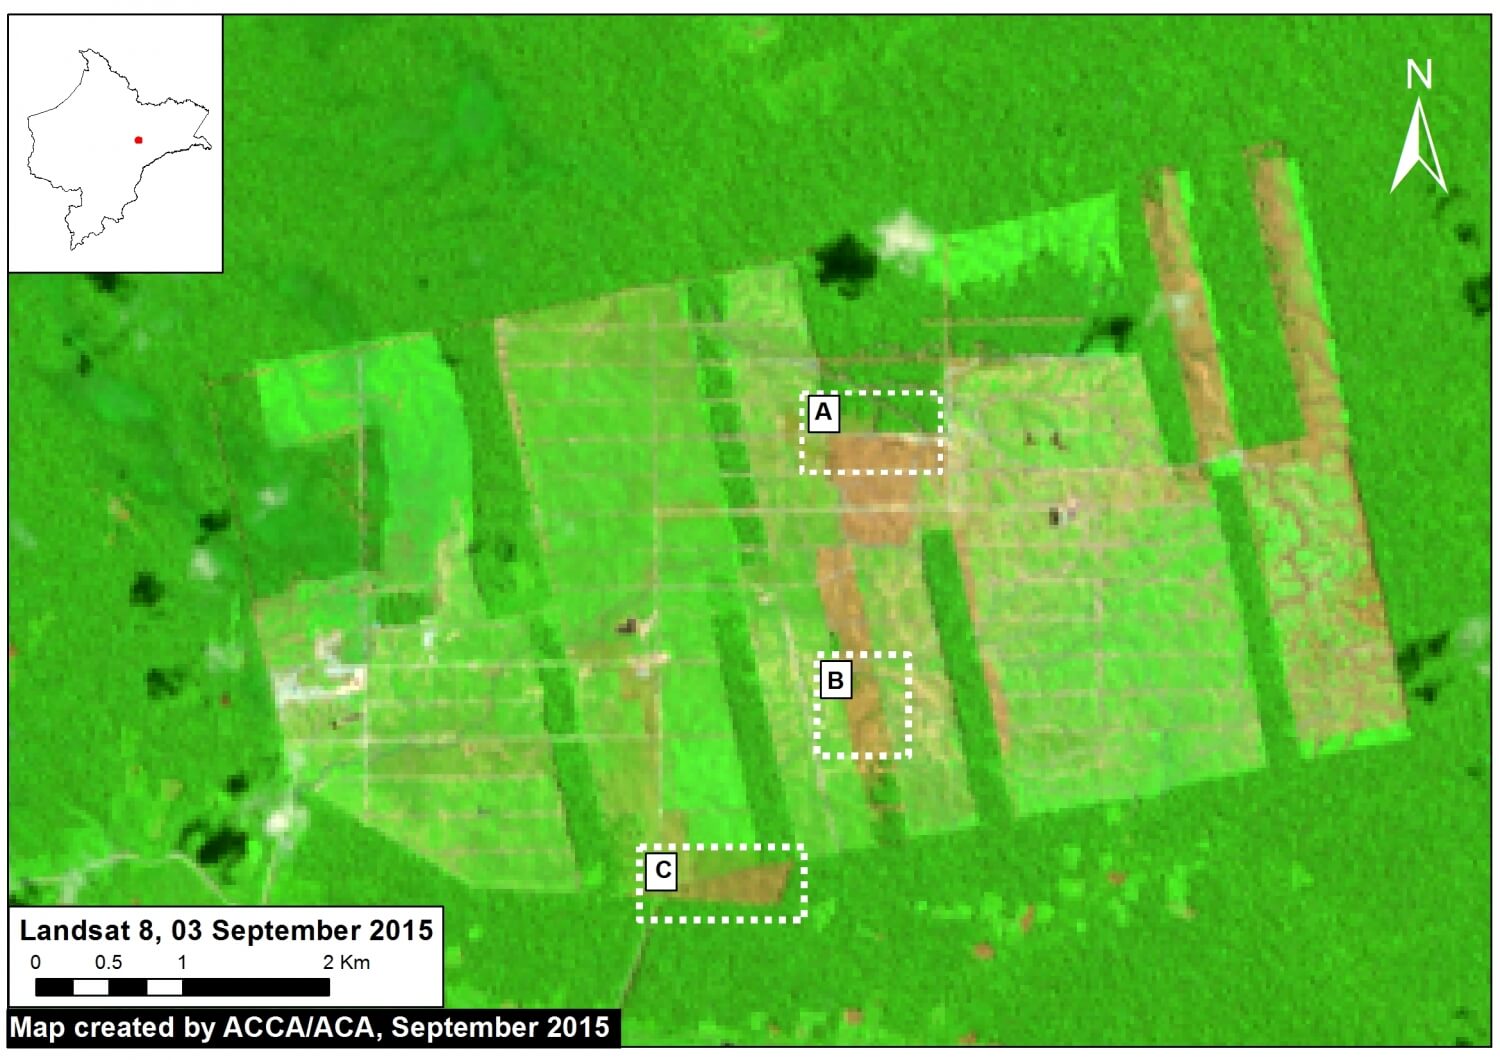
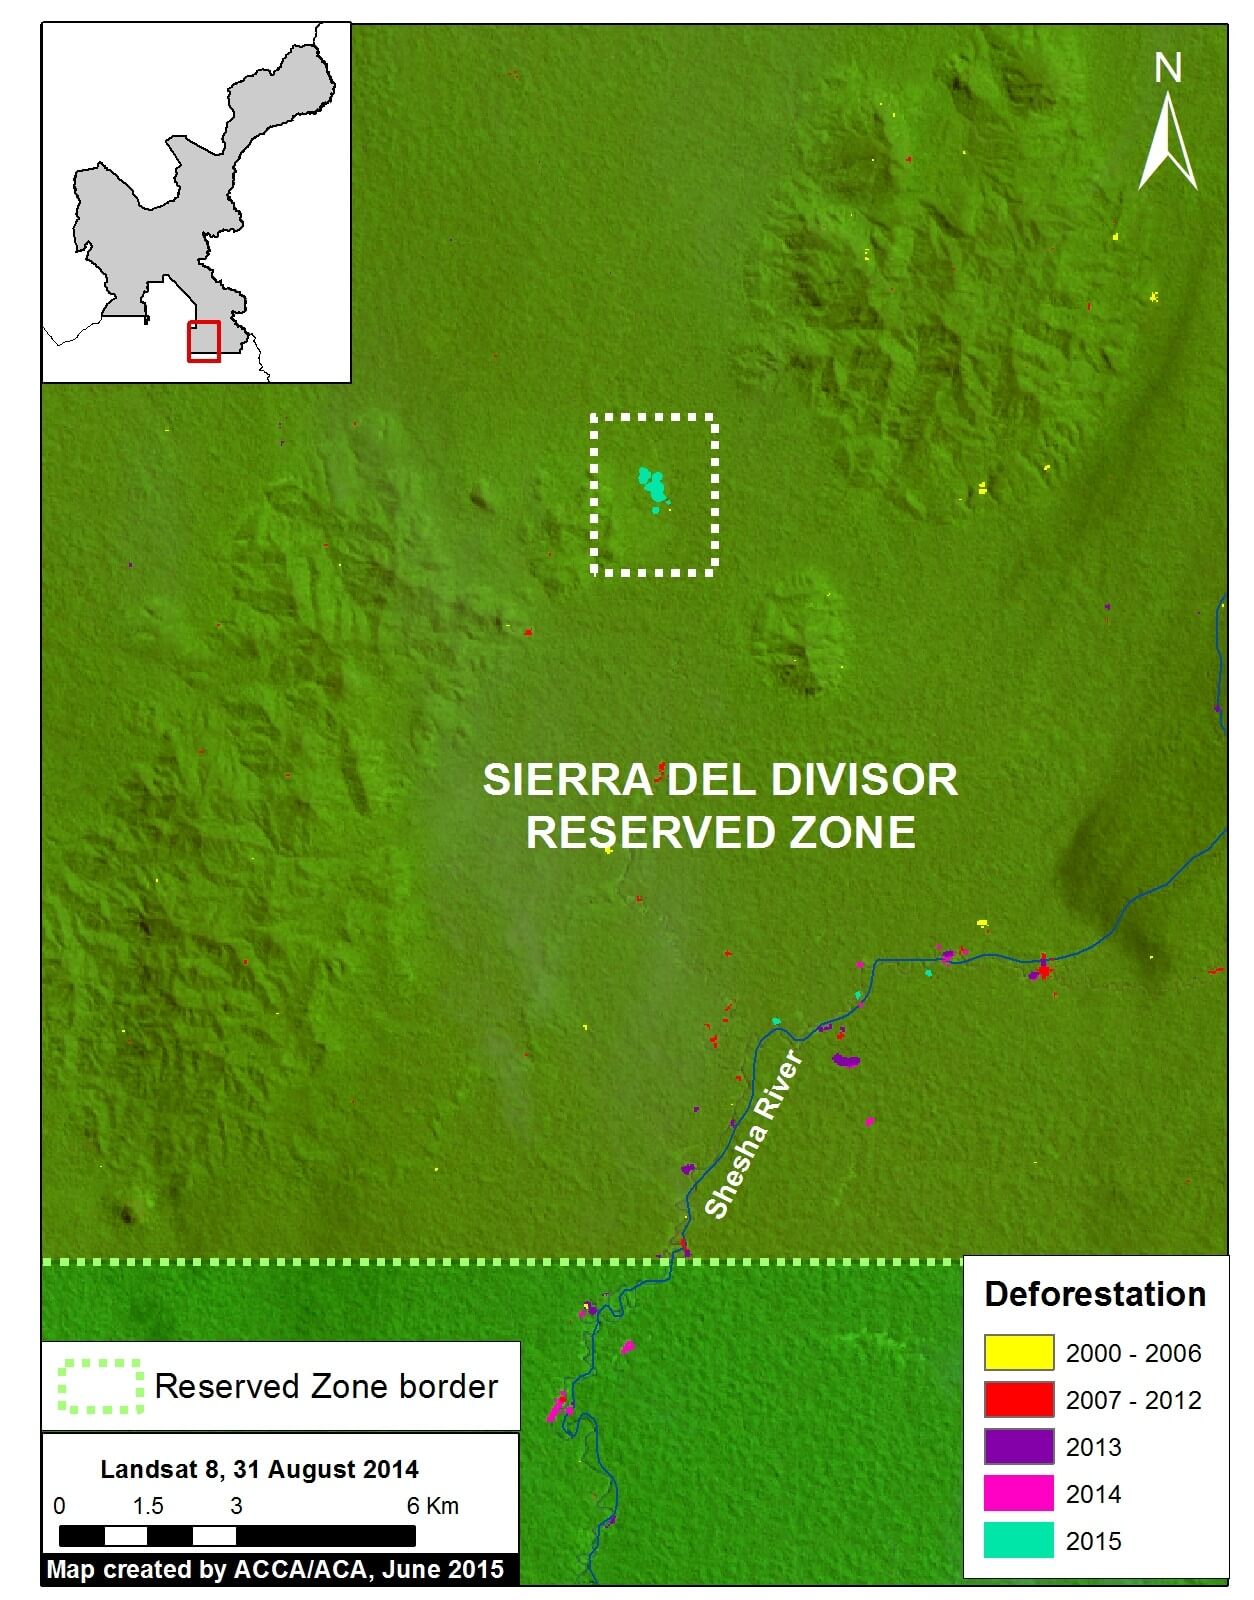
In Figure 15c, we show the expansion of this logging road from 2012 to 2015, totaling approximately 75 km of new road construction during these three years.

Image 15c. Expansion of the logging road in the northeast sector of the Reserve Zone. Data: MINAM-PNCB/MINAGRI-SERFOR, SERNANP, USGS.

Carbon Data


Imagen 15d. High-resolution carbon geography of Sierra del Divisor area. Data: Asner et al. 2014 a,b.

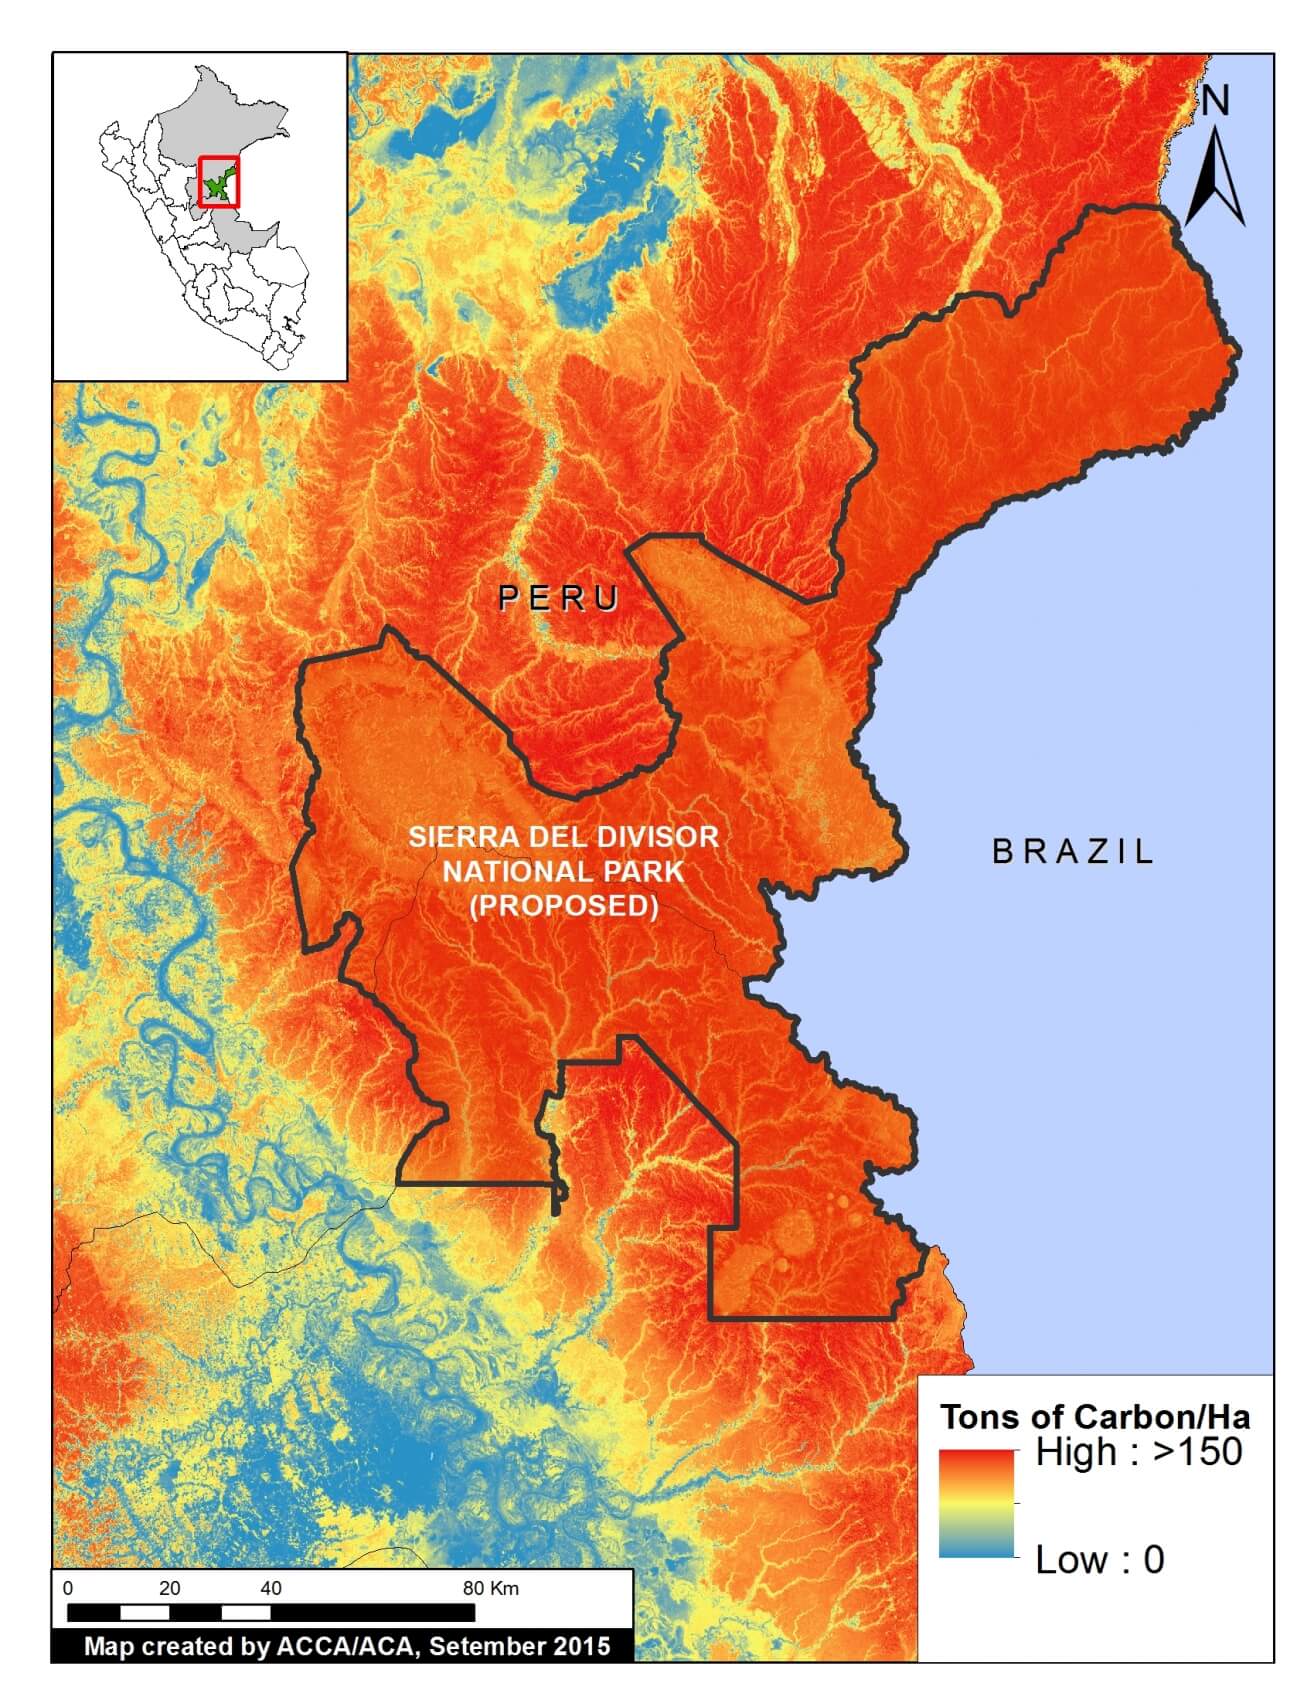
Dr. Greg Asner (from the Carnegie Institution for Science) and colleagues recently produced a high-resolution carbon map of Peru (Asner et al. 2014 a,b).

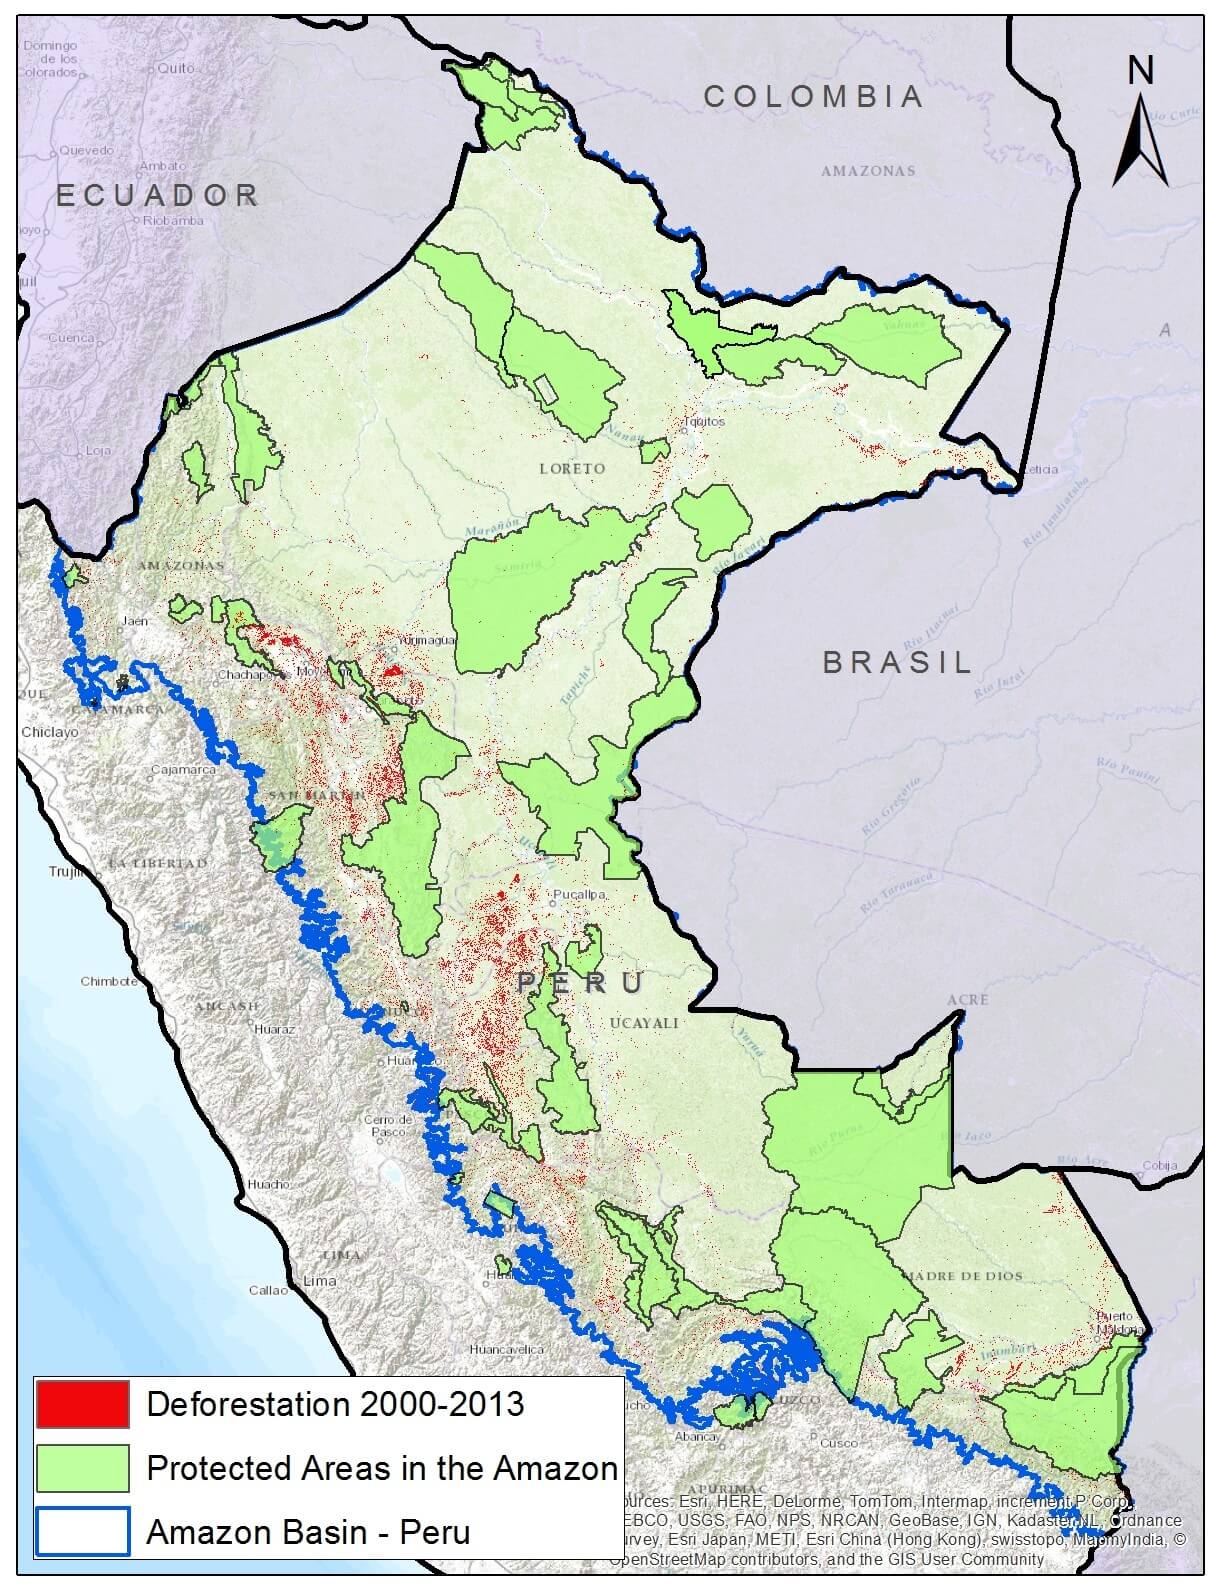
According to this data, the Sierra del Divisor Reserved Zone has the second largest carbon stock among all Peruvian protected areas (behind only Alto Purus National Park).

As seen in Image 15d, much of the proposed national park area contains high to very high carbon levels. Using this data, we calculated that the proposed Sierra del Divisor National Park contains approximately 165 million metric tons of above-ground carbon.


SERNANP Response

In response to this article, SERNANP (the Peruvian protected areas agency) issued this statement:

The deforestation alert in the northwest sector parallel to the Sierra del Divisor Reserved Zone is caused by the improvement of an alleged older road that runs along the natural protected area, which is being operateded by a neighboring forest concessionaire. We denounced this before the Special Prosecutor for Environmental Matters in Loreto in 2012, as we considered it irregular and a threat to the protected area.

[La deforestación que se advierte en el sector noroeste paralelo a la Zona Reservada Sierra del Divisor se origina por el mejoramiento de una supuesta carretera antigua que viene ejecutando un concesionario forestal colindante con el área natural protegida, la cual denunciamos ante la Fiscalía Especializada de Materia Ambiental – Loreto en el año 2012, por considerarla irregular y constituirse en una amenaza a este espacio protegido.] This past August, the Special Prosecutor scheduled an inspection, which was conducted jointly with the Public Prosecutor of the Ministry of the Environment. We have been making every effort to ensure that the Special Prosecutor performs the corresponding actions according to law, such as requiring OSINFOR to supervise the forest concessionaire due to the irregular events that we denounced.

[Recién en agosto último la Fiscalía programó la inspección fiscal, que se realizó conjuntamente con la Procuraduría Pública del Ministerio del Ambiente, en la cual venimos realizando todos los esfuerzos para que la Fiscalía Especializada realice las actuaciones que corresponde de acuerdo a Ley, así como requerir al OSINFOR supervise al concesionario forestal, por los hechos irregulares que denunciamos.] Lima, 17 de setiembre del 2015

References

Asner GP, Knapp DE, Martin RE, Tupayachi R, Anderson CB, et al. (2014 a) Targeted carbon conservation at national scales with high-resolution monitoring. Proceedings of the National Academy of Sciences, 111(47), E5016-E5022.

Asner GP, Knapp DE, Martin RE, Tupayachi R, Anderson CB, et al. (2014 b) The high-resolution carbon geography of Peru. Berkeley, CA: Minuteman Press.


Citation

Finer M, Novoa S (2015) Sierra del Divisor – New logging road crosses northern section of Reserve Zone MAAP: Image #15. Link: https://maaproject.org/2015/09/image15-sierra-divisor/


MAAP #14: Cusco – Increasing Deforestation Driven by Coca and Gold Mining

In MAAP #14 we take our first detailed look at the region of Cusco. The city of Cusco is of course well known as the former capital of the Inca empire and current gateway to Machu Picchu, but the greater Cusco region is a vast area including large tracts of Amazon forest. Here, we focus on the eastern Cusco region, an area that is experiencing increasing deforestation from gold mining and coca cultivation.

Image 14a. Recent deforestation patterns in northeast Cusco region. Data: PNCB, USGS, SERNANP, IBC.

Key Results

We highlight two major expanding deforestation zones in the eastern Cusco region. Both zones are along major tributaries of the Araza River, which itself is a tributary of the Inambari River.

1) Nuciniscato River (see Zoom A). We documented a major deforestation spike since 2010 along this river and its major tributaries. Since 2010, there has been deforestation of 764 ha, much of which appears to be related to gold mining.

2) Nojonunta River (see Zoom B). We document a recent (2014) deforestation surge in this area, much of which appears to be related to coca cultivation.

Data Description

In the following maps:

Any variation of green in the satellite imagery indicates areas of forest cover.

Yellow (2000-2004), orange (2005-2008), red (2009-2012), and purple (2013) indicate areas that were deforested between 2000 and 2013 according to data from the National Program of Forest Conservation for the Mitigation of Climate Change (PNCB) of the Ministry of the Environment of Peru.

The colors pink (2014) and turquoise (2015) indicate areas that were deforested in the last two years based on our analysis of Landsat imagery using CLASlite forest monitoring software.

Zoom A: Nuciniscato River


Image 14b. Zoom A (see Image 12a for context). Data: PNCB, USGS, SERNANP, IBC.

We documented the deforestation of 967 ha along the Nuciniscato River and its major tributaries since 2000. Image 14b shows that the vast majority (79% or 764 ha) of this deforestation has occurred since 2010. Peak deforestation occurred in 2012 (219 ha) and dipped slightly in 2014 (115 ha).

As noted in MAAP #6, part of this deforestation (along the upper Nuciniscato River) is entering the buffer zone of the Amarakaeri Communal Reserve.

Zooms A1 and A2: Examples of Deforestation in 2015

To better understand the principal deforestation drivers along the Nuciniscato River, we acquired high resolution satellite imagery. Much of the recent deforestation since 2010 is characteristic of gold mining: along river courses with forest clearing, earth removal, and waste-water lagoons. Images 14c and 14d both show very recent deforestation (between February and August 2015) with these characteristics.

Image 14c. Zoom A1 (see Image 14b for context). Data: SPOT 7 from Airbus, GeoEye from Digital Globe (NextView).
Image 14d. Zoom A2 (see Image 14b for context). Data: SPOT 7 from Airbus, GeoEye from Digital Globe (NextView).

Zoom B: Nojonunta River


Image 14e. Zoom B (see Image 21a for context). Data: PNCB, USGS.

We documented the deforestation of 477 ha along the Nojonunta River since 2000. Image 14e shows that the vast majority (85% or 403 ha) of this deforestation has occurred since 2010. Peak deforestation occurred in 2014 (207 ha), particularly in the upper Nojonunta.

Zoom B1: Deforestation Driven by Coca Cultivation


Image 14f. Zoom B1. Data: SPOT 7 from Airbus, UNODC 2014.

In the recent UNODC (United Nations Office on Drugs and Crime) report “Monitoreo de Cultivos de Coca 2014” [Coca Crop Monitoring 2014], it was reported that the area around the Nojonunta River (coca zone San Gabán) has a medium to high density of coca cultivation.

Image 14f displays the UNODC coca density data (left panel) in relation to a recent high resolution satellite image of the area (right panel). Thus, the data indicates that coca cultivation is a major driver of the deforestation detected in this case.

Citation

Finer M, Novoa S (2015) Increasing deforestation in Northeast Cusco region from coca and gold mining. MAAP: Image #14. Link: https://maaproject.org/2015/09/image-14-cusco/

MAAP #13: Clearing of Primary Forest for Cacao Resumes in Tamshiyacu (Loreto, Peru)

As confirmed in MAAP #9, the company United Cacao (through its subsidiary in Peru, Cacao Peru North) cleared 2,126 hectares of primary forest between May 2013 and August 2014 to establish a large-scale cacao plantation outside the town of Tamshiyacu, in northeastern Peru (Loreto region). New satellite imagery reveals that the forest clearing has recently resumed in 2015. We detected the cutting of 150 hectares in recent months, bringing the total area cleared as part of the United Cacao project to 2,276 hectares.

Image 13a shows a series of satellite images (NASA Landsat) taken between November 2014 and August 2015. In these images, a clearing of 24 hectares was detected in the period from November 2014 to June 2015. This reduction in forest clearing was possibly because of the Resolution issued by the Ministry of Agriculture, which temporarily paralyzed the agricultural activities of United Cacao.

However, more recent images have revealed a large increase in forest clearing – 126 hectares – between June and August 2015.

This brings to 2,276 ha the total forest clearing generated by the United Cacao project between May 2013 and August 2015.

In the Landsat images, the dark green color indicates forest cover, the light green secondary vegetation, the pink color indicates exposed ground (a key indicator of forest clearing), while scattered patches in black and white indicate clouds and their shadows.

Forest clearing between June and August 2015


Image 13b Base map indicating the location of a series of zooms. Data: USGS.

Image 13b indicates the location of a number of zooms (see below) that clearly illustrate the forest clearing that occurred between June and August 2015. The images 13c – 13e are of each respective zoom and show each area before and after the forest clearing. Note that Worldview-3 imagery resolution is 33 cm and Worldview-2 imagery resolution is 50 cm.

Imagen 13c. Zoom A. Data: WorldView from Digital Globe (NextView).
Image 13d. Zoom B. Data: WorldView from Digital Globe (NextView).
Image 13e. Zoom C. Data: WorldView from Digital Globe (NextView).

Changing the Cacao Production Model in Peru

According to a recent interview with the President of United Cacao, the company is adopting the agro-industrial model. In other words, it is changing cacao production in Peru from the traditional small-scale model sited on long-deforested land for the agro-industrial model that requires large land parcels that are normally occupied by forests.

Image #12: High-Resolution View of Illegal Gold Mining Deforestation in La Pampa (Madre De Dios, Peru)

In MAAP #1, we described the expansion of deforestation through February 2015 in La Pampa, a gold mining hotspot located in the Madre de Dios region in the southern Peruvian Amazon. Since then, we have obtained a new high-resolution image showing the current situation (as of late July 2015) in great detail in La Pampa.

Here in MAAP #12, we present an analysis with the following three objectives: 1) Update data for the recent expansion of gold mining deforestation in La Pampa, 2) show a series of high-resolution images that illustrate the scale and magnitude of current gold mining operations, and 3) illustrate how the Tambopata National Reserve currently represents a good defense against deforestation expansion.

Image 12a. High-resolution images showing the expansion of deforestation by gold mining in La Pampa between August 2014 and July 29, 2015. Data: GeoEye and WorldView2 from Digital Globe (NextView).

Image 12a shows, in high resolution, the expansion of gold mining deforestation in La Pampa during the last year (between August 2014 and July 2015). The red square indicates the main zone of deforestation.


Deforestation 2014-15


Image 12b. CLASlite Results 2014-15. Data: USGS, SERNANP.

Image 12b shows the CLASlite results of the expansion of gold mining deforestation in La Pampa during the past year (between August 2014 and July 2015). We found deforestation of 725 hectares (Ha) in the last year, including 224 Ha since February (the date of the last image analyzed in the MAAP #1). This equates to nearly 1,000 soccer fields of deforestation throughout the year.

High Resolution View – July 2015

This series of maps illustrates the scale and magnitude of gold mining operations in La Pampa as of July 29, 2015, just two weeks after a major raid by the Peruvian government against illegal gold mining camps.

Image 12c. Zoom A (see Image 12a for context). Date of image: July 29, 2015. Data: WorldView2 from Digital Globe (NextView).

Image 12c displays, in high-resolution, the current center of the mining activity in La Pampa. Note that it is a zoom of zone A indicated in Image 12a. One can see the high density of gold mining operations and infrastructure in almost every area of the image. Also note in Image 12c that the location of four additional zooms described below are also shown.

Images 12d – g show a series of additional zooms from four different locations within the center of the current mining activity in this sector of La Pampa and highlights the scale and magnitude of operations.

Image 12d. Zoom B (see Image 12c for context). Data: WorldView2 from Digital Globe (NextView).
Image 12e. Zoom C (see Image 12c for context). Data: WorldView2 from Digital Globe (NextView).
Image 12f. Zoom D (see Image 12c for context). Data: WorldView2 from Digital Globe (NextView).
Image 12g. Zoom E (see Image 12c for context). Data: WorldView2 from Digital Globe (NextView).

Tambopata National Reserve: Defense Against Deforestation

Image 12h illustrates how the Tambopata National Reserve remains a good defense against deforestation.

Image 12h. Tambopata National Reserve. Date of Image: July 29, 2015. Data: WorldView2 from Digital Globe (NextView).

SERNANP Response

In response to this article, SERNANP (the Peruvian protected areas agency) issued this statement:

The area known as La Pampa is located in the buffer zone of the Tambopata National Reserve (RNTAMB) in the Madre de Dios region.

“El sector denominado La Pampa se encuentra ubicado en la zona de amortiguamiento de la Reserva Nacional Tambopata (RNTAMB) en la región Madre de Dios.”

In its capacity as lead agency of natural protected areas of Peru, SERNANP has been making great efforts to deal with illegal mining and other activities that threaten the Reserve. As part of these actions, we carried out monitoring in this region through images from LANDSAT 8). This monitoring system has confirmed the excellent state of conservation of the Reserve. Information has also been collected by park guards on patrols conducted along the Malinowski River and on monitoring trails located within the protected area.

“En su calidad de ente rector de las áreas naturales protegidas del Perú, el SERNANP viene realizando grandes esfuerzos para hacer frente a la minería ilegal y otras actividades que amenacen a la Reserva. Como parte de estas acciones se realiza un monitoreo mediante imágenes (LANSAT 8), sistema que ha corroborado el óptimo estado de conservación de la Reserva, información que ha sido recopilada también por los guardaparques en los patrullajes realizados a lo largo del río Malinowski y en las trochas de monitoreo ubicadas al interior del área protegida.”

Similarly, this system has allowed SERNANP to collect information on threats in the buffer zone, data that has been shared promptly with leading authorities on illegal mining. This information is centered on points of access to the buffer zone, trails, gas stations, distances, among others; this has contributed to the development and implementation of the strategy against illegal mining in the Tambopata Natural Reserve.

“Asimismo, este sistema ha permitido recopilar información sobre las amenazas en la zona de amortiguamiento, datos que han sido compartidos oportunamente con las principales autoridades competentes en materia de minería ilegal. Esta información está centrada en puntos de acceso a la zona de amortiguamiento, trochas, grifos, distancias, entre otros; lo que ha contribuido en la elaboración y aplicación de la estrategia de la RN Tambopata contra la minería ilegal.”

This strategy also includes the continued involvement and support of the Chief of the Tambopata National Reserve on issues related to the promotion of economic activities and the exploitation of natural resources by local populations, promoting tourism as a strategy for conservation of the protected area, lectures on environmental education, and others.

“Esta estrategia comprende también la permanente participación y apoyo de la Jefatura de la Reserva Nacional Tambopata en temas relacionados con el impulso de actividades económicas como el aprovechamiento de recursos naturales por parte de las poblaciones locales, la promoción del turismo como estrategia de conservación del área protegida, charlas de educación ambiental, entre otros.”


Citation

Finer M, Olexy T (2015) High Resolution View of Illegal Gold Mining in La Pampa (Madre de Dios, Peru). MAAP #12. Link: https://maaproject.org/2015/08/image12-lapampa/

Image #11: Importance of Protected Areas in The Peruvian Amazon

The Peruvian national protected areas system, known as SINANPE, is critically important to Amazon conservation efforts in the country.

There are currently 46 protected areas in the Peruvian Amazon under national or regional administration*. In total, these areas cover 19.5 million hectares and include a wide variety of designations, including areas of indirect use (those with strict protection, such as National Parks) and direct use (those that allow the exploitation of natural resources, such as National Reserves) under national administration and Regional Conservation Areas under regional administration.

Here, MAAP #11 presents a deforestation analysis that demonstrates the effectiveness of protected areas in relation to the surrounding landscape in the Peruvian Amazon.

Image 11a. Recent forest loss in relation to protected areas in the Peruvian Amazon. Data: SERNANP, PNCB-MINAM/SERFOR-MINAGRI, NatureServe.
Image 11a. Recent forest loss in relation to protected areas in the Peruvian Amazon. Data: SERNANP,

Key Results

Image 11a shows recent (2000 – 2013) forest loss patterns in relation to the current national protected area system in the Peruvian Amazon (Image 11b shows the same, but with zooms of the northern, central, and southern regions, respectively). Note that some of the documented forest loss surely comes from natural causes, such as landslides or meandering rivers.

Across all protected areas administered nationally (such as National Parks and National Reserves), we found that deforestation was significantly lower starting at 2 km within their boundaries compared to outside them (see Images 11b and 11c).

The rate of deforestation outside of protected areas is more than twice of that within them (within the 5 km buffer zone study area, see below).

Image 11b. Regional zooms (north, central, south) of recent forest loss in relation to protected areas. Data: SERNANP, PNCB-MINAM/SERFOR-MINAGRI, NatureServe.

Deforestation Analysis – Methods

We conducted a basic analysis of all protected areas administered nationally (National Park, National Sanctuary, Historic Sanctuary, National Reserve, Protection Forest, Communal Reserve, and Reserved Zone) to estimate their relative effectiveness in controlling deforestation in relation to the surrounding landscape. The forest loss data comes from the National Program of Forest Conservation for the Mitigation of Climate Change (PNCB) of the Ministry of the Environment of Peru. This deforestation analysis had two key components.

Image 11c. Illustration of spatial intervals for deforestation analysis.

First, we compared recent forest loss within versus outside each protected area at four different spatial intervals: 1 km, 2 km, 3 km, and 5 km (see Image 11c). In other words, starting at the boundary line for each area, we created a 1 km buffer both inside and outside the area and compared the relative (forest loss/area *100) deforestation. We then repeated this analysis for the other intervals. The establishment of these intervals areas is based on the assumption that the closer to the limits of each protected area, deforestation could be more related to anthropogenic activities in surrounding areas, which is expected to reduce the effect of natural losses due to changes in the courses of rivers and landslides in unstable areas.

Second, we controlled for protected area creation date. If an area was created prior to 2000, such as Manu National Park created in 1973, we used the complete 2000-2013 PNCB forest loss dataset. If an area was created after 2000, such as Alto Purus National Park created in 2004, we used just the forest loss dataset for the years following its creation (in this case, 2005-2013).

This analysis was designed to show general patterns, not be a definitive evaluation of the effectiveness of protected areas. A more complete evaluation could control for additional variables (such as slope, elevation, climate, distance to population centers, etc…).

Deforestation Analysis – Results


Image 11d. Results of deforestation analysis.

Across all protected areas administered nationally, we found that deforestation was significantly lower starting at 2 km within their boundaries compared to outside them (p < 0.05) (see Image 11d). The significance level increased by an order of magnitude between 3 and 5 km. We didn’t detect a significant difference between 1 km within and outside the protected area boundaries.

On average, we found that 0.5% of the area within protected areas experienced forest loss between 2000-2013, while outside the protected areas was nearly 1.2%. In other words, the rate of deforestation outside of protected areas is more than twice of that within them. Furthermore, as mentioned earlier, some forest loss within the protected areas surely comes from natural causes, such as landslides or meandering rivers.

Related Studies

As noted above, this analysis was designed to show general patterns, not be a definitive evaluation of the effectiveness of protected areas. Several other recent studies have pointed out the importance of controlling for additional variables.

In a study focused on the Brazilian Amazon, Pfaff et al (PLOS ONE 2015) found that is important to control for the location of protected areas, which is often in more isolated areas with lower deforestation pressures.

Specifically regarding the Peruvian Amazon, a study by the research organization Resources for the Future (2014) found that “the average protected area reduces forest cover change”. This study rigorously controlled for a number of key variables (such as elevation, slope, climate, and distance to cities), but used older and more limited forest loss and protected areas data.

*This total of 46 protected areas includes: a) all the categories considered part of SINANPE (including Reserved Zones and Regional Conservation Areas) except for Private Conservation Areas, and b) all areas that are totally or partially located in the Amazon basin.

SERNANP Response

In response to this article, SERNANP (the Peruvian protected areas agency) issued this statement:

Actualmente el SERNANP viene realizando una verificación en campo por parte del personal guardaparque de las Áreas Naturales Protegidas durante sus acciones de patrullaje merced a la información de pérdida de bosque proporcionada por el Ministerio del Ambiente, periodo 2013-2014, a fin de determinar si el cambio de la cobertura se debe a causas naturales o antrópicas. Esto podrá complementar el análisis desarrollado por ACCA.

Es importante señalar, que el SERNANP viene aplicando el enfoque ecosistémico en la planificación y gestión de las Áreas Naturales Protegidas, en este sentido desarrolla acciones que permiten evitar la deforestación al interior de estos espacios protegidos, pero a su vez nos proponemos que en su entorno se desarrollen actividades compatibles con la conservación que eviten el fraccionamiento del hábitat y permitan la sostenibilidad de la conservación de las Áreas Naturales Protegidas a futuro.

En este sentido, considerando de vital importancia generar alianzas con las entidades que toman decisiones en el territorio fuera de estos espacios, hemos establecido a nivel nacional un trabajo conjunto con los Gobiernos Regionales a fin de integrar las Áreas Naturales Protegidas dentro de corredores de conservación con otras modalidades de conservación que se impulsan a través de sus sistemas regionales de conservación. Con ello, se esperaría detener el fraccionamiento de hábitat alrededor de las Áreas Naturales Protegidas, lo que podría conllevar a su insostenibilidad a futuro. Al respecto, es preciso mencionar que los Sistemas Regionales de Conservación cuentan con un espacio de coordinación donde se reúnen las principales instituciones que gestionan territorio y en la cual se discuten las iniciativas de desarrollo social y económico para que se realicen en armonía con la conservación de la biodiversidad del país, el SERNANP forma parte de estos espacios a nivel nacional.


Citation

Finer M, Novoa S (2015) Importance of Protected Areas in the Peruvian Amazon. MAAP: Image #11. Link: https://maaproject.org/2015/08/image-11-protected-areas

Mining News Watch #17

Mining News Watch #17 covers the time period June 10- July 30, 2015

Top Stories 

  • On July 13th, the Peruvian police carried out a major raid in the La Pampa mining zone (Madre de Dios), the first major government operation against illegal mining in eight months.
  • Following the raid, the regional President of Madre de Dios, Luis Otsuka, complained of the inefficiency of the formalization process in Madre de Dios, and how it is damaging the region’s economy.
  • Technical reports released by the Amazon Conservation Association (ACA) and the Conservación Amazónica (ACCA) has found growing deforestation in the Amarakaeri Communal Reserve and Sierra del Divisor.
  • OjoPublico released an investigative report on the foreign financing of illegal mining in South America, including the foreign businesses that help finance illegal gold mining.

Read Full Article >

MAAP #9: Confirming Forest Clearing for Cacao in Tamshiyacu (Loreto, Peru) Came from Primary Forest

Recall that in Image #2 we documented the rapid clearing of 2,126 hectares of primary forest between May 2013 and August 2014 for a new cacao project outside of the town of Tamshiyacu in the northern Peruvian Amazon (Department of Loreto).

However, the company that carried out the forest clearing (United Cacao, through its wholly-owned subsidiary in Peru, Cacao del Peru Norte) has responded “that this area had been used for farming since the late 1990s, and thus it was not primary forest…There was no high-conservation-value forest on that land (Cannon JC, 2015, mongabay.com).” In addition, the company’s website states that “The site was heavily logged of all tropical hardwoods in the 1980s.”

Here, in Image #9, we 1) publish new high-resolution (33 cm) satellite imagery that shows how the cacao project is expanding into dense, closed-canopy forest and 2) detail exactly how we determined that the vast majority of the clearing indeed came from primary forest. These findings are critically important because the company has major expansion plans.

Image of the Week 9a. Mosaic of very high-resolution (33 cm) images of the United Cacao plantation near Tamshiyacu, Peru, in June 2015. Colors indicate insets. Data: WorldView-3 from Digital Globe (NextView).

Key Results:

We obtained very high-resolution (33 cm) satellite imagery taken over the United Cacao plantation in June 2015 (see Image 9a). In this imagery, one can clearly see that the cacao project is embedded and expanding into dense, closed-canopy forest.

We analyzed a series of satellite (Landsat) images dating back to 1985 to determine that, prior to the arrival of United Cacao in 2013, the project area 1) had NOT been used for major farming activities, 2) was NOT heavily logged of all tropical hardwoods, and 3) was dominated (98%) by primary forest (see Image 9b). In fact, by analyzing spectral signatures in the Landsat images, we confirm that the area cleared by United Cacao in 2013 was dominated by primary forest (see Image 9c).

We show data from the Carnegie Airborne Observatory showing that the majority of the United Cacao project area had the highest possible value of carbon (over 150 tons per hectare) immediately prior to the forest clearing in 2013.

Finally, we present information indicating that the current documented forest clearing of 2,126 hectares may soon double or triple.

Landsat Time-series


Image 9b. Landsat time-series (1985-2012) of the future United Cacao plantation area (indicated by black box) prior to arrival of the company. Data: USGS

Image 9b displays a series of Landsat images dating back to 1985 showing that, prior to the arrival of United Cacao, the area was dominated (nearly 98%) by primary forest and NOT used for major agriculture activities or heavily logged of all tropical hardwoods.

In these Landsat images, dark green indicates forest cover, light green indicates secondary vegetation, pink indicates exposed ground (and is therefore a key indicator of recent forest clearing), and the scattered white and black spots indicate clouds and their shade.

In 1985, the future cacao project area (indicated by black box) was completely covered by forest with no signs of clearing, major logging, or farming. By 1995, there were a few scattered areas of cleared forest in the center of the future project area. By 2005, there was a slight expansion of these cleared areas in the center of the future project area. By 2012, immediately before the start of forest clearing, the future project area appeared much the same: a few scattered areas of cleared forest in the center, but the vast majority of the area was primary forest.

We defined primary forest as an area that from the earliest available image (in this case, from 1985) was characterized by dense closed-canopy coverage and experienced no major clearing events.

NDVI Analysis


Image 9c. NDVI analysis of the United Cacao plantation area prior to arrival of the company. Letters indicate significance (i.e., “a” values are significantly different than “b” values). Data: USGS.

To further investigate the issue of primary forest, we used the Landsat imagery to conduct an NDVI (Normalized Difference Vegetation Index) analysis. NDVI is a common index of photosynthetic activity, or “greenness,” based on the fact that different surfaces (primary forest, secondary forest, water, bare ground, etc…) reflect light (visible and near-infrared) differently.

As seen in Image 9c, we obtained NDVI measurements across four different years (1985, 1995, 2005, and 2012) for 100 random points from each of three different areas: 1) area cleared by United Cacao in 2013 (orange dots), 2) nearby protected area that is proxy for primary forest (yellow dots), and 3) disturbed area along a major river that is proxy for secondary forest (purple dots).

For all four years, we found that the NDVI values for the area cleared by United Cacao in 2013 were similar to those of the nearby protected area (in fact, these values were nearly identical in 1985 and 1995), but significantly different than the disturbed area along the major river. In other words, the forest cleared by United Cacao was nearly identical to our proxy for primary forest and significantly different than our proxy for secondary forest. Thus, we conclude that United Cacao cleared over 2,000 hectares of primary forest in 2013.

Carbon Data Tells the Same Story


Image 9d. High-resolution carbon map of United Cacao plantation area (indicated by black box) prior to forest clearing. Data: Asner et al (2014) The high-resolution carbon geography of Peru. Berkeley, CA: Minuteman Press.

The Carnegie Airborne Observatory, led by Dr. Greg Asner, and the Peruvian Ministry of Environment, recently produced a high-resolution carbon geography of Peru. Interestingly, they mapped the carbon content of the United Cacao plantation area immediately prior to the forest clearing.

As seen in Image 9d, the vast majority of the United Cacao project area had the highest possible value of carbon (over 150 tons per hectare) immediately prior to the forest clearing in 2013. The only exceptions were the scattered previously cleared areas identified in Image 9b.

According to Asner, “The carbon levels were extremely high, indicating that they were large, intact forests that we normally picture when we think of primary Amazon forest.”

More Forest Clearing Coming…


Image 9e. Project area map from the United Cacao website.

According to its website, United Cacao owns around 3,250 hectares near Tamshiyacu, and this total may soon increase to 4,000 hectares. In addition, the company has started an initiative with local farmers that may include an additional 3,250 hectares.

Thus, the current documented forest clearing of 2,126 hectares may soon double or triple.

Finally, it is worth mentioning that we detected a sawmill within the project area. This discovery raises the question, Has the company obtained the necessary permits for this activity?

Image 9f. A sawmill detected within the cacao project area. Inset: The pink dot indicates location of sawmill within the project area. Data: WorldView-3 de Digital Globe (NextView).

Citation

Finer M, Novoa S (2015) Demonstrating that Forest Clearing for Cacao in Tamshiyacu (Loreto, Peru) came from Primary Forest. MAAP: Image #8. Link: https://maaproject.org/2015/06/image-9-cacao-tamshiyacu/

Image #10: Bahuaja Sonene National Park – Increasing Deforestation Within and Around Southern Section (Puno, Peru)

Here, in MAAP #10, we show the results of a deforestation analysis of two sectors of Bahuaja Sonene National Park and its surrounding buffer zone. The Park, which covers an area of more than 1.6 million hectares in the regions of Puno and Madre de Dios in the southern Peruvian Amazon, is an area of high biological diversity.

Specifically, we found increasing deforestation in 1) the buffer zone of the Park’s western section (Loromayo sector) and 2) inside the Park’s southeastern section (Colorado sector). In both cases, we identified shifting cultivation associated with coca cultivation as one of the main drivers of deforestation.

Image 10a. Deforestation detected in and around Bahuaja Sonene National Park and its buffer zone. Please note that Zooms “A” and “B” are described in more detail below. Data: SERNANP, PNCB, USGS.

Key Results

We highlight two key areas within and around Bahuaja Sonene National Park where deforestation grew substantially between 2013 and 2015:

1) Sector Loromayo, located in the buffer zone immediately outside the western section of the Park (see Zoom A). We estimate that more than 1,000 hectares (ha) were deforested since 2010, peaking in 2014 (331 ha). This expanding deforestation entered the Park in 2014.

2) Sector Colorado, located in the southeastern section of the Park (see Zoom B). We estimate, between 2001 to 2014, the deforestation of over 530 hectares inside the Park and over 1,170 hectares in the surrounding buffer zone. As in Loromayo, there was a notable increase in deforestation starting in 2010, with the peak occurring in 2014.

In both sectors, Loromayo and Colorado, we identified that one of the main drivers of deforestation is coca cultivation.

Description of Data

In the following maps:

Any variation of green in the satellite imagery indicates areas of forest cover.

Yellow (2000-2004), orange (2005-2008), red (2009-2012), and purple (2013) indicate areas that were deforested between 2000 and 2013 according to data from the National Program of Forest Conservation for the Mitigation of Climate Change (PNCB) of the Ministry of the Environment of Peru.

The colors pink (2014) and turquoise (2015) indicate areas that were deforested in the last two years based on our analysis of Landsat imagery using CLASlite forest monitoring software.

Zoom A: Loromayo River (western buffer zone)


Image 10b. The expansion of deforestation along the Loromayo river in the buffer zone to the west of Bahuaja Sonene National Park. Data: SERNANP, USGS, IBC, PNCB.

As shown in Figure 10b, we identified a striking pattern of deforestation in the sector Loromayo, located between the Malinowski and Chaspa rivers in the Park’s western buffer zone in the department of Puno. Note that the deforestation entered the Park in 2014.

In this area, we documented the deforestation of 1,005 hectares since 2010. This deforestation peaked in 2014, with 331 hectares, including 1.8 hectares within the Park. Not much data is yet available for 2015.

Please note that we previously reported on the advance of gold mining deforestation seen in Image 10b along the Malinowski River in MAAP #5.

Sector Loromayo: Shifting Agriculture that includes Coca Cultivation


Image 10c. Coca density data (upper panel) in relation to a recent high resolution satellite image of the area (lower panel). Data: UNODC 2014, SERNANP, Worldview-2 from Digital Globe (NextView).

In the recent UNODC (United Nations Office on Drugs and Crime) report “Monitoreo de Cultivos de Coca 2014” [Coca Crop Monitoring 2014], it was reported that the Loromayo sector (coca zone San Gabán) has a medium to high density of coca cultivation, with a recent increase of 5.9% since 2013. Therefore, we conculde that coca cultivation is one of the major drivers of the observed deforestation.

Image 10c displays the most recent UNODC coca density data (upper panel) in relation to a recent high resolution satellite image of the area (lower panel). Deforestation is rapidly expanding in the vicinity of the Park boundary. Unfortunately, in this image, a few clouds cover the small area where the deforestation recently entered Park.

Zoom B: Sector Colorado (Southeastern section of Park)

Image 10d. The expansion of deforestation in the Colorado sector of Bahuaja Sonene National Park. Data: SERNANP, USGS, IBC, PNCB.

As seen in Figure 10d, deforestation is well established and increasing in the sector Colorado, located in the southeast section of Bahuaja Sonene National Park, with the Region of Puno. Our analysis in this area extended from the upper Tambopata River to the Azata river.

We document the deforestation, since 2001, of 538 ha inside the Park and an additional 1,172 ha within the surrounding buffer zone. Similar to the sector Loromayo sector, there was a marked increase in deforestation since 2010, with a peak in 2014. More than half of the deforestation (53%, 287 ha) occurred since 2010, with a maximum of 81 ha in 2014. Not much data is yet available for 2015.

Sector Colorado: Presence of Coca Cultivation Inside the Park


Image 10e. Coca density data (upper panel) in relation to a recent high resolution satellite image of the area (lower panel). Data: UNODC 2014, SERNANP, SPOT6 from Airbus.

According to a recent report by the Wildlife Conservation Society (WCS), the deforestation in the Colorado sector was a result of the advance of agriculture and livestock cultivation in the area. Moreover, according to the recent UNODC report noted above, this sector (coca zone Inambari-Tambopata) also has a high density of coca, with 108 ha on the interior of Bahuaja Sonene National Park and 1,610 ha in the buffer zone, likely making it one of the major drivers of the observed deforestation.

Image 10e displays the UNODC coca density data (upper panel) in relation to a recent high resolution satellite image of the area (lower panel).

SERNANP Response

In response to this article, SERNANP (the Peruvian protected areas agency) issued this statement:

“El sector denominado como Colorado es sector ubicado dentro del Parque Nacional Bahuaja Sonene, que actualmente se encuentra zonificado como Zona de Recuperación; dicha zonificación se otorga a aquellas zonas que por actividades antrópicas han sido afectadas y que necesitan estudios complementarios para determinar su zonificación definitiva.”

[The sector named ‘Colorado’ is a sector located within the Bahuaja Sonene National Park, which currently is zoned as a ‘Restoration Zone.’ Said zoning is extended to those zones which have been affected due to anthropic activities and require supplementary studies so as to determine their definitive zoning designation.] Debemos señalar que en este sector se han detectado severas plagas que afectan los cultivos de frutos como la naranja y café, desencadenando que la población asentada en la zona de amortiguamiento del Parque se vean forzada a reemplazar estas plantaciones por el cultivo de coca en algunos casos.

[We should note that severe pests have been detected in this sector which affect the cultivation of fruit such as oranges and coffee; this has lead the population settled in the park’s buffer zone to have no choice but to replace these crops with the cultivation of coca in some cases.] Esta situación ha sido identificada y advertida oportunamente por el jefe del Parque Nacional Bahuaja Sonene a las entidades pertinentes para iniciar su erradicación; no obstante, el SERNANP también ha emprendido un trabajo conjunto con las autoridades locales y el comité de gestión del área natural protegida para combatir esta amenaza, lo cual figura en el Plan Maestro 2015-2019 del área en mención. Ahí se contemplan estrategias como la construcción de un puesto de control y vigilancia para monitorear permanentemente esta situación.

[The head of the Bahuaja Sonene National Park has identified and issued a warning about this situation in a timely manner to the relevant entities so as to initiate its eradication work; notwithstanding, SERNANP has also undertaken joint work with local authorities and the management committee of the natural protected area to combat this threat, which figures in the 2015-2019 Master Plan of the area in question. The latter contains strategies such as the construction of a checkpoint and guard post for permanently monitoring this situation.] Asimismo, se vienen promoviendo mesas de diálogo y el desarrollo de actividades económicas sostenibles que reemplacen los cultivos ilícitos y que garanticen la calidad de vida de la población de Colorado.”

[Likewise, dialogue roundtables and the development of sustainable economic activities have been promoted that can replace the illicit crops and guarantee quality of life for the population of Colorado.]

Citation

Finer M, Novoa S (2015) Bahuaja Sonene National Park – Increasing Deforestation Within and Around the Southern Section (Puno, Peru). MAAP: Image #10. Link: https://maaproject.org/2015/07/image-10-bahuaja/

References

UNODC. Monitoreo de cultivos ilícitos Perú 2014. p 29. (Lima, 2015).

Image #8: New Deforestation Detected Within Sierra Del Divisor (Peru) in June

Recall that in Image of the Week #7 we documented the increasing threats (illegal coca, logging, and mining) to the Sierra del Divisor Reserved Zone. We just obtained brand new, high-resolution imagery showing new deforestation deep within this protected area during the month of June. Here, Image of the Week #8, presents new maps of this recent deforestation. According to several consulted experts, the cause of this deforestation is illegal coca cultivation or a new illegal logging camp.

Image 8a: Very high resolution (38 cm) image from June 23 showing new deforestation within the Sierra del Divisor Reserved Zone. Data: WorldView-3 from Digital Globe (NextView).

New Deforestation Detected

Image 8a shows the new deforestation detected within the southeast section of the Sierra del Divisor Reserved Zone. As of June 23, 2015 (the date of the image), the total new deforestation was 13 hectares. This deforestion is located between the La Cúpula and Shesha hills.

In Image of the Week #7 we showed that there is a series of illegal logging camps nearby, but this new deforestation is located much deeper in the reserve. According to several consulted experts, the cause of the new deforestation is illegal coca cultivation or a new illegal logging camp.

Updated Baseline Map


Image 8b. Updated baseline map of the southeast section of the Sierra del Divisor Reserved Zone. Data: MINAM, SERNANP, USGS, IBC, Hansen/UMD/Google/USGS/NASA.

Image 8b is an updated map of the deforestation within the southeast section of the Sierra del Divisor Reserved Zone. Note that the new 2015 deforestation is found much deeper within the reserve than previous detected forest loss.

Confirming Recent Deforestation


Image 8c. Landsat time-series (2014-2015) of the recent deforestation. Data: USGS.

To better understand how the recent deforestation unfolded, we created a satellite (Landsat) image time-series. Note that in Image 8c all four panels show the exact same area over time. In August 2014, our focal area was completely forested. The first evidence of deforestation is seen in May 2015. In June 2015, the deforestation grows quickly.

Deforestation Within the Isconahua Territorial Reserve

Image 8d. Deforestation within the Territorial Reserve Isconahua. Data: MINAM, SERNANP, USGS, IBC, Hansen/UMD/Google/USGS/NASA.

Image 8d shows the new deforestation is also located with the Isconahua Territorial Reserve.

This is an official land designation in favor of indigenous peoples in isolation, to protect their rights, habitat, and the conditions that ensure their existence and integrity as a people.

SERNANP Response

In response to this article, SERNANP (the Peruvian protected areas agency) issued this statement:

“The Sierra del Divisor Reserved Zone is a transitional area under the Peruvian National Service of Natural Protected Areas (SERNANP).

Over the past few years, Sierra del Divisor has made significant efforts in its fight against ilegal logging and other activities that threaten it. However, it is worth noting that Image of the Week #8: New Deforestation Detected Within Sierra del Divisor (Peru) in June corresponds with an area of overlap with the Isconahua Territorial Reserve, a sector in which the Ministry of Culture works in coordination with SERNANP.

As part of our actions, SERNANP has planned a flyover in the zone to verify information regarding the new deforestation alert in the Sierra del Divisor, and will continue with special park guard patrolling that began last week, despite the local climate conditions.”

+++

“La Zona Reservada Sierra del Divisor es un espacio de carácter transitorio a cargo del Servicio Nacional de Áreas Naturales Protegidas por el Estado (SERNANP).

En los últimos años la ZRSD ha realizado grandes esfuerzos en su lucha contra la tala ilegal y otras actividades que la amenazan. Sin embargo, hay que precisar que la Imagen de la Semana #8: Nueva Deforestación al Interior de la ZRSD corresponde al ámbito de traslape (superposición) con la Reserva Territorial Isconahua, donde también interviene el Ministerio de Cultura, la cual el SERNANP trabaja de manera conjunta con dicho sector.

En el marco de nuestras acciones, el SERNANP viene programando un sobrevuelo en la zona para verificar la información sobre la nueva alerta de deforestación en la ZRSD, y continuar con el patrullaje especial del personal guardaparque que viene realizando desde la semana pasada, pese a las condiciones climáticas del lugar”.

Citation

Finer M, Novoa S, Peña N (2015) Nueva Deforestación al Interior de la Zona Reservada Sierra del Divisor. MAAP: Imagen #8. Link: https://maaproject.org/2015/06/imagen-8-sierradivisor

Mining News Watch #16

Mining News Watch #16 covers the time period March 17- June 10, 2015

Top Stories

  • The Peruvian government announced in May that new complementary regulations for the formalization process will be released in August.
  • To date, only 16 permits have been issued for formalized mining, affecting just 631 of the 58,835 miners that started the process in Puno.
  • According to a pair of technical reports by the Amazon Conservation Association (ACA) and Conservaciόn Amazόnica (ACCA), 2,500 hectares (6,200 acres) has been deforested in the Tambopata National Reserve buffer zone due to illegal mining in the past two years.
  • The Ministry of the Environment (MINAM) reported that 40.5 tons of mercury enter the rivers of Madre de Dios annually.
  • The Foreign Relations Committee of the Peruvian Congress approved the Minamata Convention, and sent it to the full Peruvian Congress for final approval.

Read Full Article >