 Amazon Conservation’s sister organization Conservación Amazónica – ACCA, with support from Google.org, just finished up a two-year initiative that trained community members to use cutting-edge satellite and field technologies to combat deforestation in the southern Peruvian Amazon, now protecting over 150,000 acres of lowland forests.
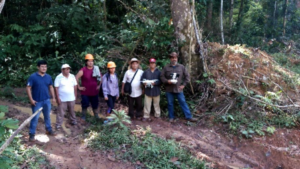
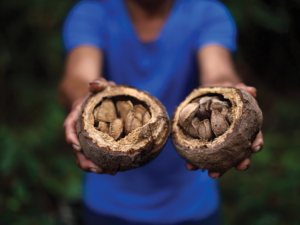
This initiative trained 75 Brazil nut harvesters and their families in forest monitoring technologies, which will help them safeguard forests to be used for sustainable purposes. Preventing deforestation of natural resources is not only environmentally important, but also economically, as the productive forests in and around the Madre de Dios area in Peru provide a sustainable and forest-friendly economic income to around 45,000 people, about 20% of the population.
In Peru, local families or associations can be granted a piece of public forests to be used for specific purposes – called a concession – such as harvesting nuts and berries, or for ecotourism. This system prevents acres of forests from falling victim to destructive activities, such as land squatting, illegal logging, or invasions by gold miners. Additionally, concessionaires are required by law to report on illicit activities in their concessions, which is a way the government gets community support to protect large swaths of forests.
 Before this program, concessionaires and their communities lacked capacity to monitor these large, remote areas and a way to rapidly and safely report deforestation in their territories. Our innovative methodology of combining real-time satellite imagery analysis and drone field technology (which includes smartapps and other technologies developed by Google) with legal training, gave concessionaires the ability to detect and report deforestation as it happened in their territory. This is a stark contrast from before, when the only way to monitor thousands of acres of forests was through foot patrols that took days to complete.
Now 75 Brazil nut harvesters and their families are using satellite imagery, early deforestation alerts, and GPS applications on mobile devices to monitor their forests. Among them, 23 individuals successfully obtained their licenses as drone pilots from the Ministry of Transport and Communications’ General Directorate of Civil Aeronautics. This means they can now their entire territory in minutes, without having to face potential risks of confronting dangerous individuals committing environmental crimes or even running into outsiders who might bring diseases like the novel coronavirus into their communities.
 Through this program, over 153,000 acres (62,000 hectares) of forests are now monitored and protected with technology by the local people we empowered. Moreover, technological kits were donated to each individual or local association, each containing a drone, a maintenance kit, a laptop and a printer, giving them the knowledge and tools needed to safeguard forests..
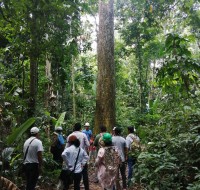
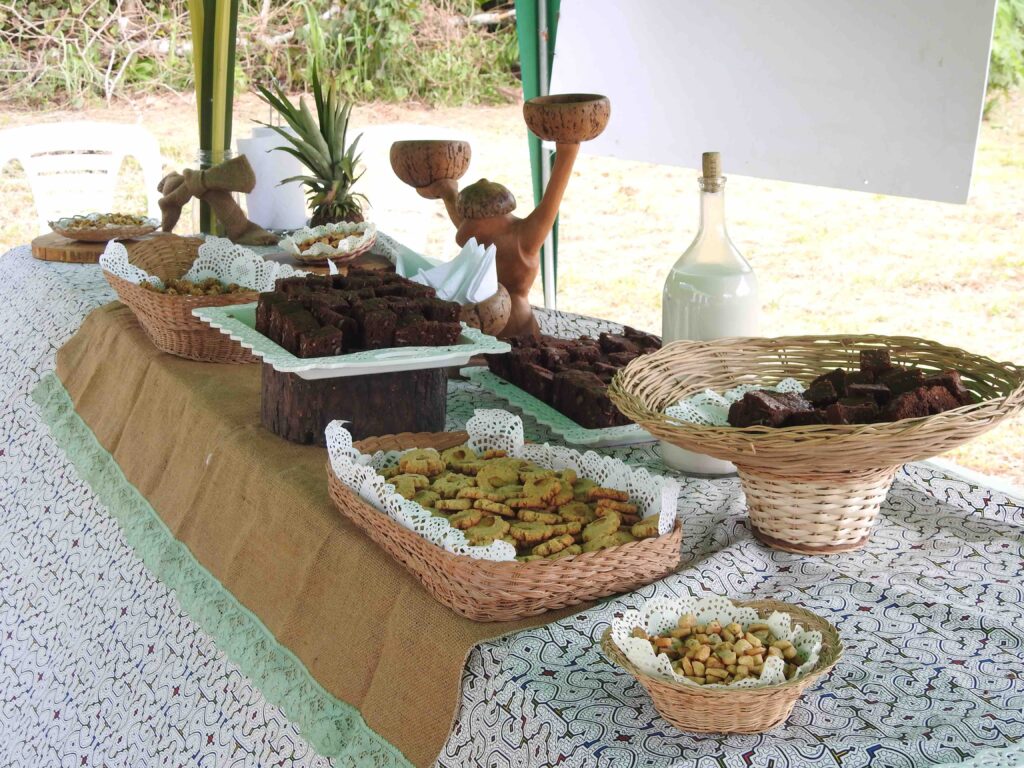
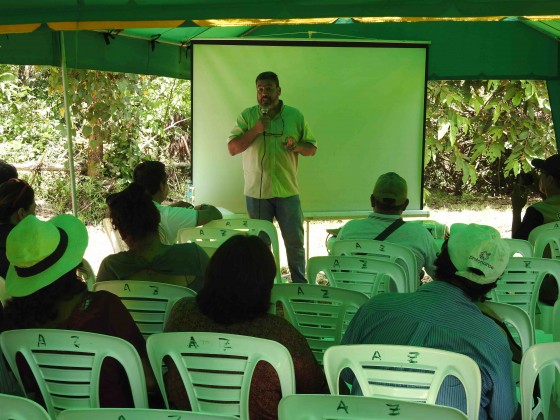
These successes were celebrated with a closing ceremony in the Castaña Amazon Park earlier this year. Local authorities and representatives of local organizations attended, such as the director of the Research Institute of the Peruvian Amazon (IIAP) and members of local harvesting associations. During the ceremony, attendees enjoyed Brazil nut appetizers, while watching presentations about the project, the results achieved, and the collaborators and participants. The event ended with a guided tour of the Brazil Nut Harvesting Center in the Castaña Amazon Park, which is noted as the first living Brazil nut tree park in the world.
 The project, led by our director of our Southwest Amazon Drone Center, Carlos Castañeda, will continue to provide technical support to maintain the donated drones and training to reinforce what they learned, as well as be available to answer any questions that may arise during monitoring and surveillance of their concessions. Thus, the continuity of the project and its sustainability are ensured.
This Google.org-funded project was the first of its kind nationwide in Peru. After this success, Amazon Conservation continues its mission of conserving the Amazon basin using new technologies. Over the next three years, we hope to strengthen the real-time monitoring of the forests by empowering local people and employing science and technology as a proven way to fight deforestation in the Amazon and create a model for other tropical forests around the world.
 For the past year our team in Bolivia and Peru have been working with EUROCLIMA+, an initiative of the European Commission focused on combating climate change in Latin America. We are working with local communities to pilot climate change resilience in their sustainable use of forest resources.
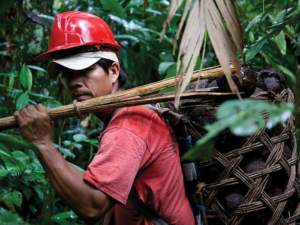 n Bolivia, coordinates this project. His team works in the northern part of Bolivia, where local communities heavily depend on these forest goods to make a living. “Almost all the families dedicate themselves to harvesting forest fruits, mainly the Brazil nut, which is their main economic activity.”
 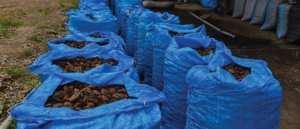 Tying the importance of conservation of these forests not only to climate change but also to economic sustainability of local and global economies is vital for countries and communities to see the value of forests. In fact, our area of work in Bolivia holds 85% of the Brazil nut production in the world, and keeping those forests standing through sustainable activities will have a significant impact in the fight against deforestation and carbon emissions.
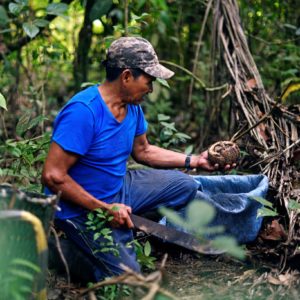 A key aspect of our work with EUROCLIMA+ is recognizing how these sustainable forest economies help mitigate the effects of climate change on communities and on the planet, which hadn’t previously been as much on peoples’ minds. This pilot work is also helping local communities become aware of how climate is changing the forests on which they depend, so they can plan for their long-term, sustainable use, without needing to turn to destructive practices like timber extraction and cattle ranching if a harvesting season is affected by global warming. This involves not only making sure we have healthy forests, but also helping communities diversify their source of income sustainably, such as harvesting other complementary forest products like açaí berries and sustainably farming paiche fish.
  The Escazú Agreement, a regional agreement on access to information, public participation and access to justice in environmental matters in Latin America and the Caribbean whose ratification is soon to be debated in Congress, has generated an intense reaction and discussion. There is a sector that affirms that this agreement would attempt against our sovereignty in the Amazon. Considering that if this agreement is ratified, the important decisions for the economic development of the country would remain in the hands of international spheres. On the other hand, others consider that such an agreement leads to improved information flow and citizen participation. Both are necessary for the development of the country, particularly in Peru where social and environmental conflicts have paralyzed many important works for the economy. Understanding the scope of the agreement and its true implications is crucial for the future of Peru.
 How can the Escazú Agreement threaten national sovereignty, and in particular, with our Amazon? To begin with, this is a Latin American regional agreement, which has been signed by 22 democratic nations (including those Amazonian), and so far, has been ratified by 9 of them. The agreement clearly states that decisions are the affairs of each country, within their own regulatory frameworks. It also stipulates that in cases where the conflict is between States, these – and only under a bilateral agreement – can be submitted to arbitration by the International Court of The Hague, as an international instance. That court does not have jurisdiction for internal affairs of a country, such as those between private, communities and the State. The resolution of controversies within a country is another matter, and only after exhausting the national justice mechanisms, they can be resolved by resorting to international bodies, which have nothing to do with the Escazú agreement.
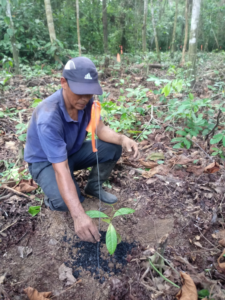
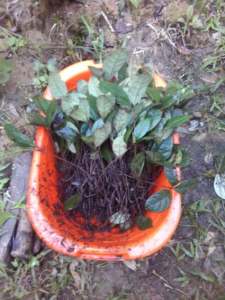
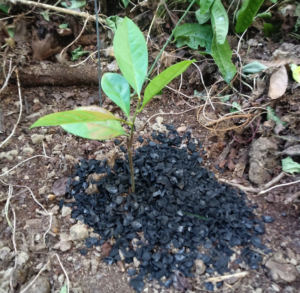
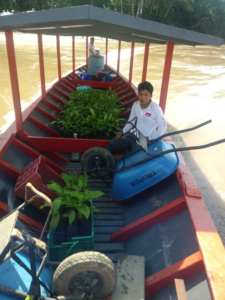
 seedlings mixed with biochar. The first 1,250 seedlings were transplanted to a target area of 2.1 hectares (5.2 acres), which had been verified as an ideal area for restoration through reforestation using this species. A tractor and a short boat trip down the river helped bring the seedlings to their new home, where they were planted throughout the end of 2019.

 Loading...