In the previous MAAP #25 and MAAP #26, we illustrated deforestation hotspots in the Peruvian Amazon for the periods 2012-2014 and 2015*, respectively. Here in MAAP #32, we present a complementary analysis based on the size of deforestation events.
Author: dcadmin
MAAP #30: Gold Mining Invasion of Tambopata National Reserve Intensifies
As described previously in MAAP #21, the illegal gold mining invasion of the Tambopata National Reserve began in late 2015. Here in MAAP #30, we confirm that this invasion continues to intensify in 2016.
Image 30a shows the invasion zone, where we document that the illegal mining is advancing on seven fronts within the northwest section of the reserve and has thus far directly caused the deforestation of 130 hectares (320 acres) since September 2015. Below, we show high-resolution zooms of fronts 1-5 (Inset A) and a major mining camp recently established just outside of the Reserve (Inset B).
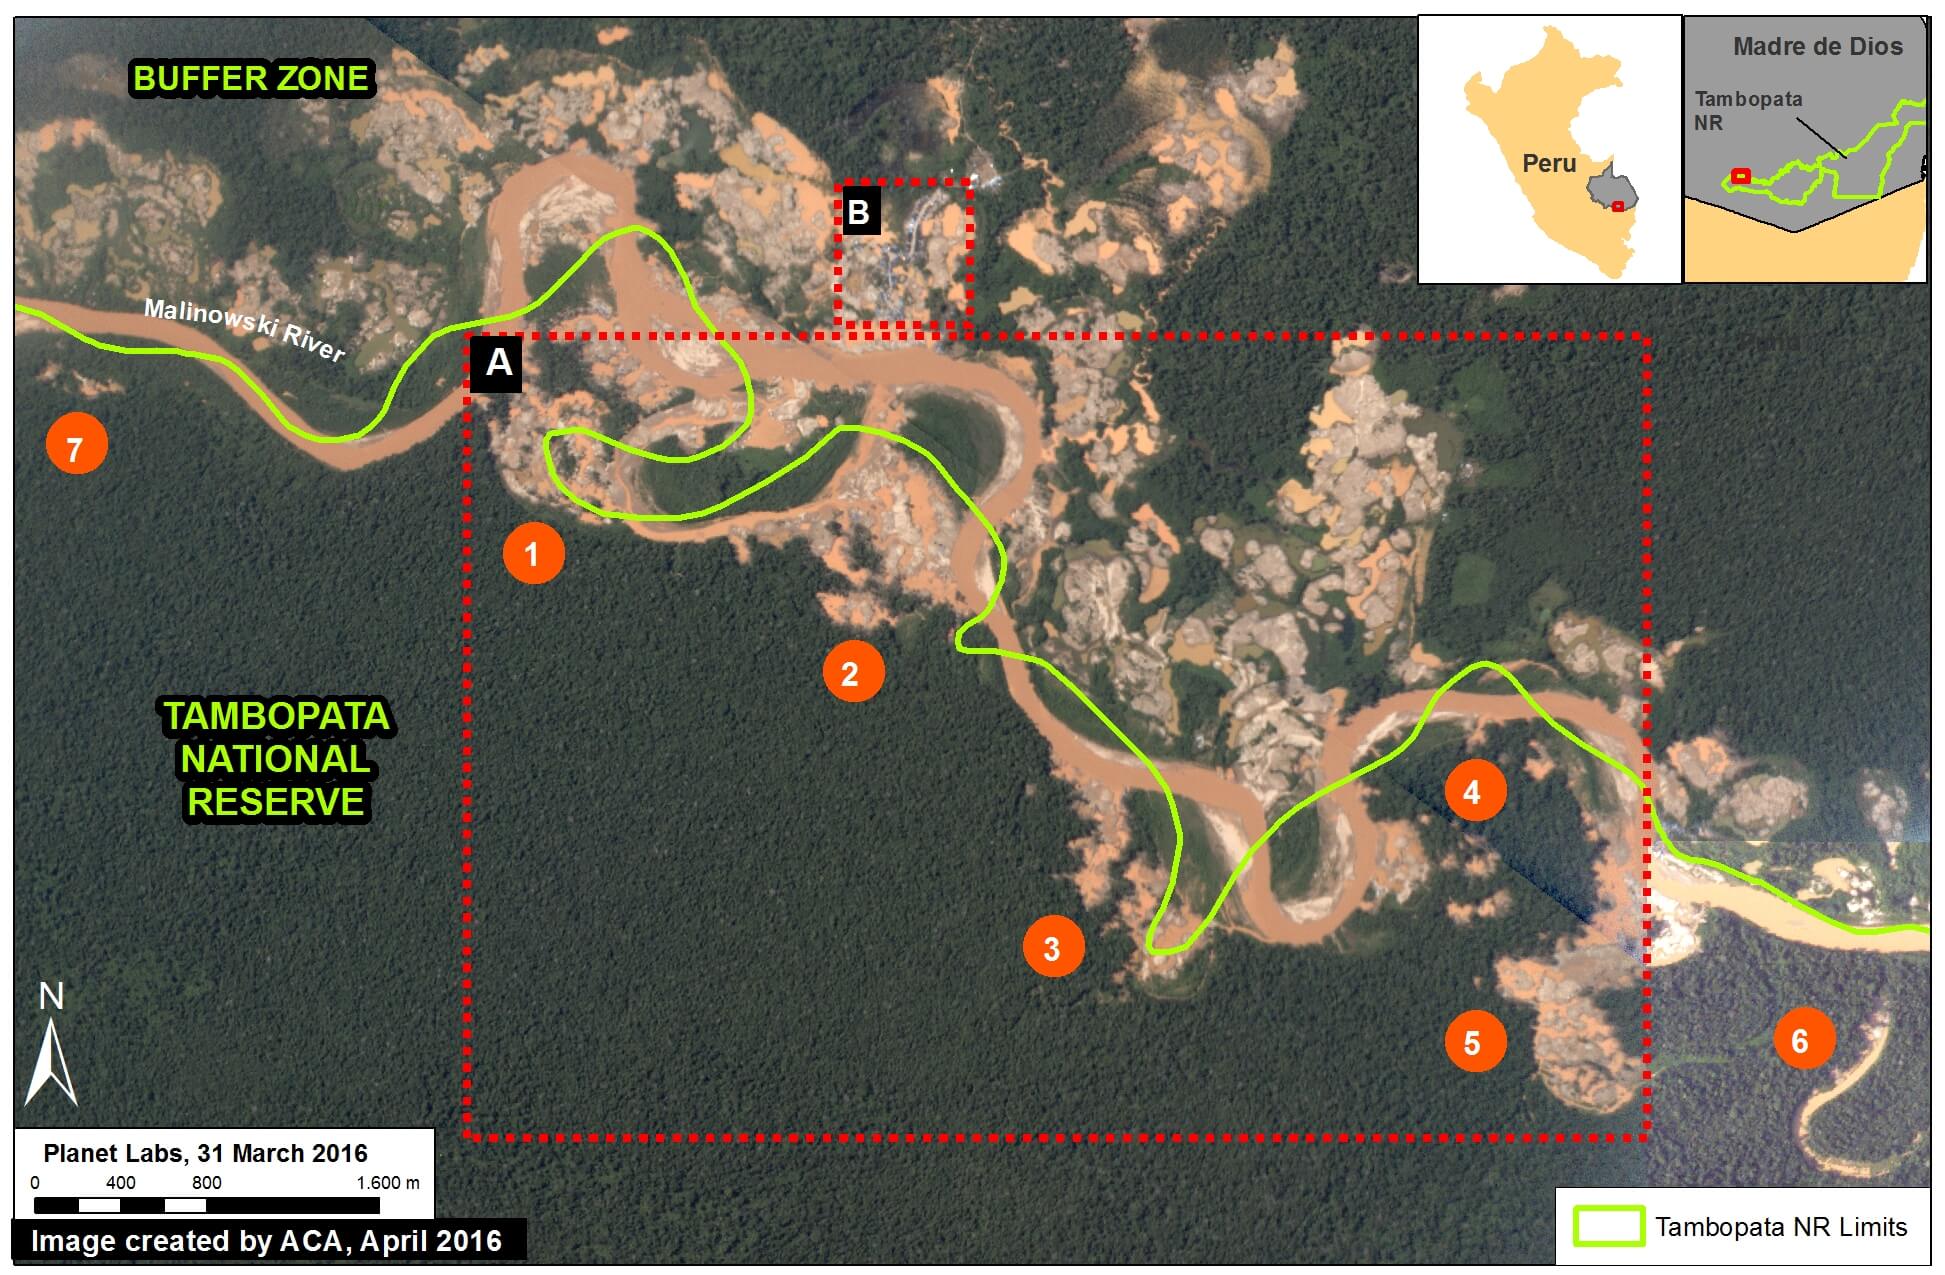
Image 30a. Data: Planet Labs, SERNANP
Invasion of Tambopata: Fronts 1-5
Image 30b shows the rapid expansion of deforestation in 5 of the fronts inside the Reserve between the end of January (left panel) and March (right panel) of 2016. This image corresponds to Inset A in Image 30a. Further below, Images 30c and 30d show high-resolution zooms of these 5 fronts.
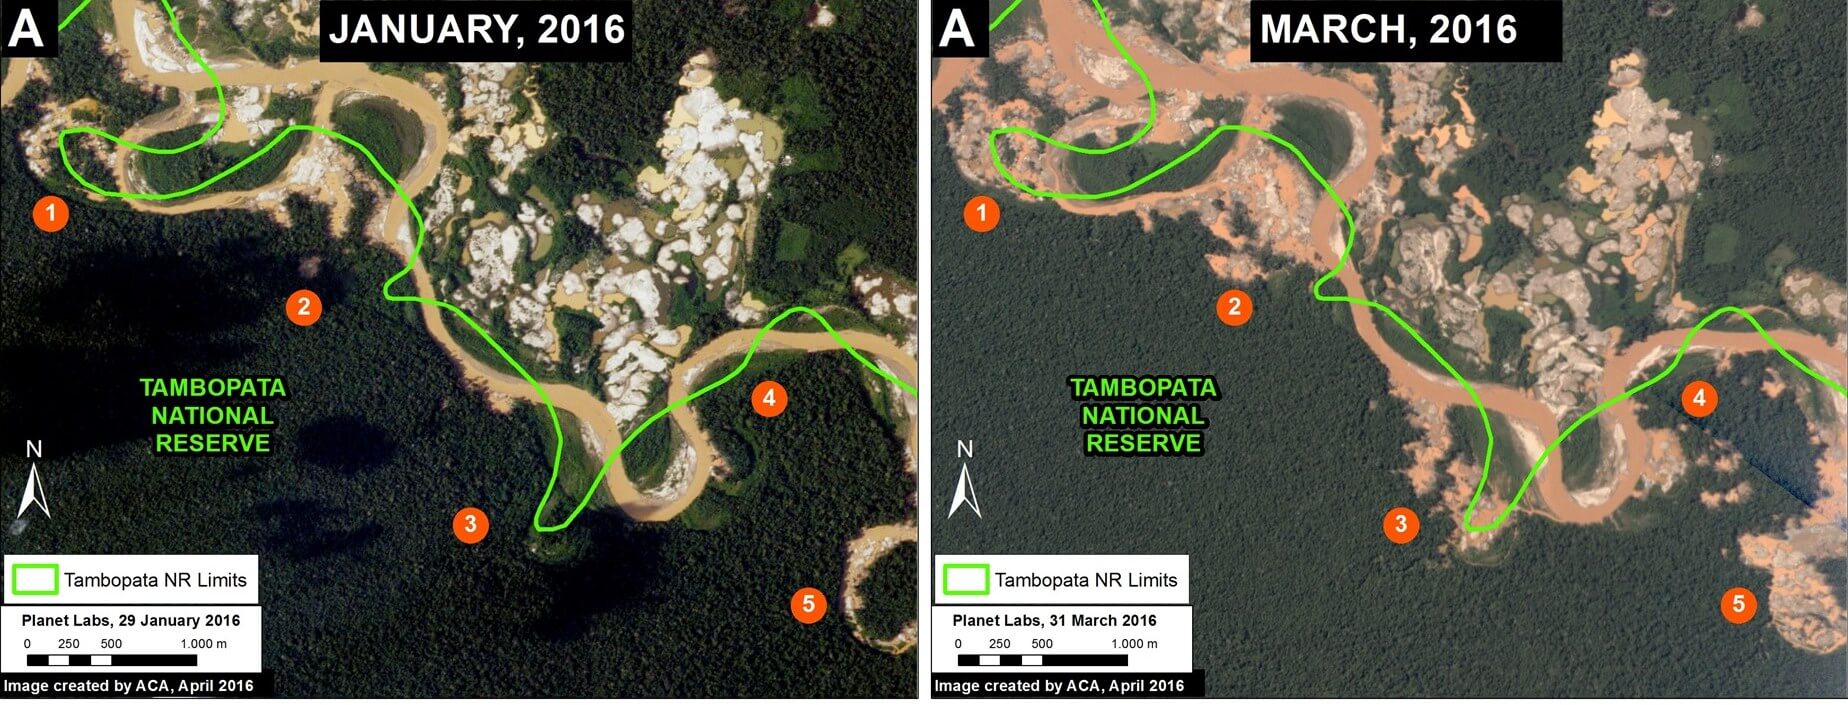
Image 30b. Data: Planet Labs, SERNANP
Zoom of Fronts 1 & 2
Image 30c shows a zoom of deforestation fronts 1 and 2 between January (left panel) and March (right panel) of 2016.
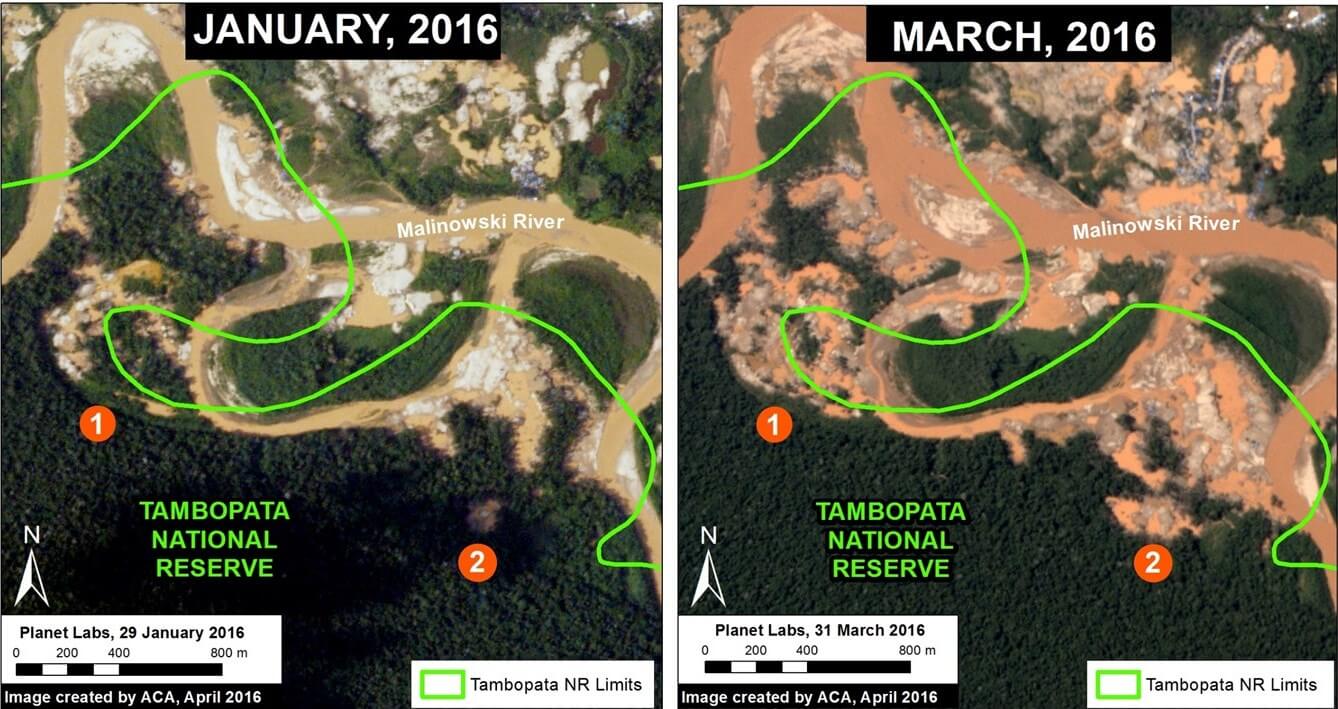
Image 30c. Data: Planet Labs, SERNANP
Zoom of Fronts 3, 4, & 5
Image 30d shows a zoom of fronts 3, 4, and 5 between January (left panel) and March (right panel) of 2016.
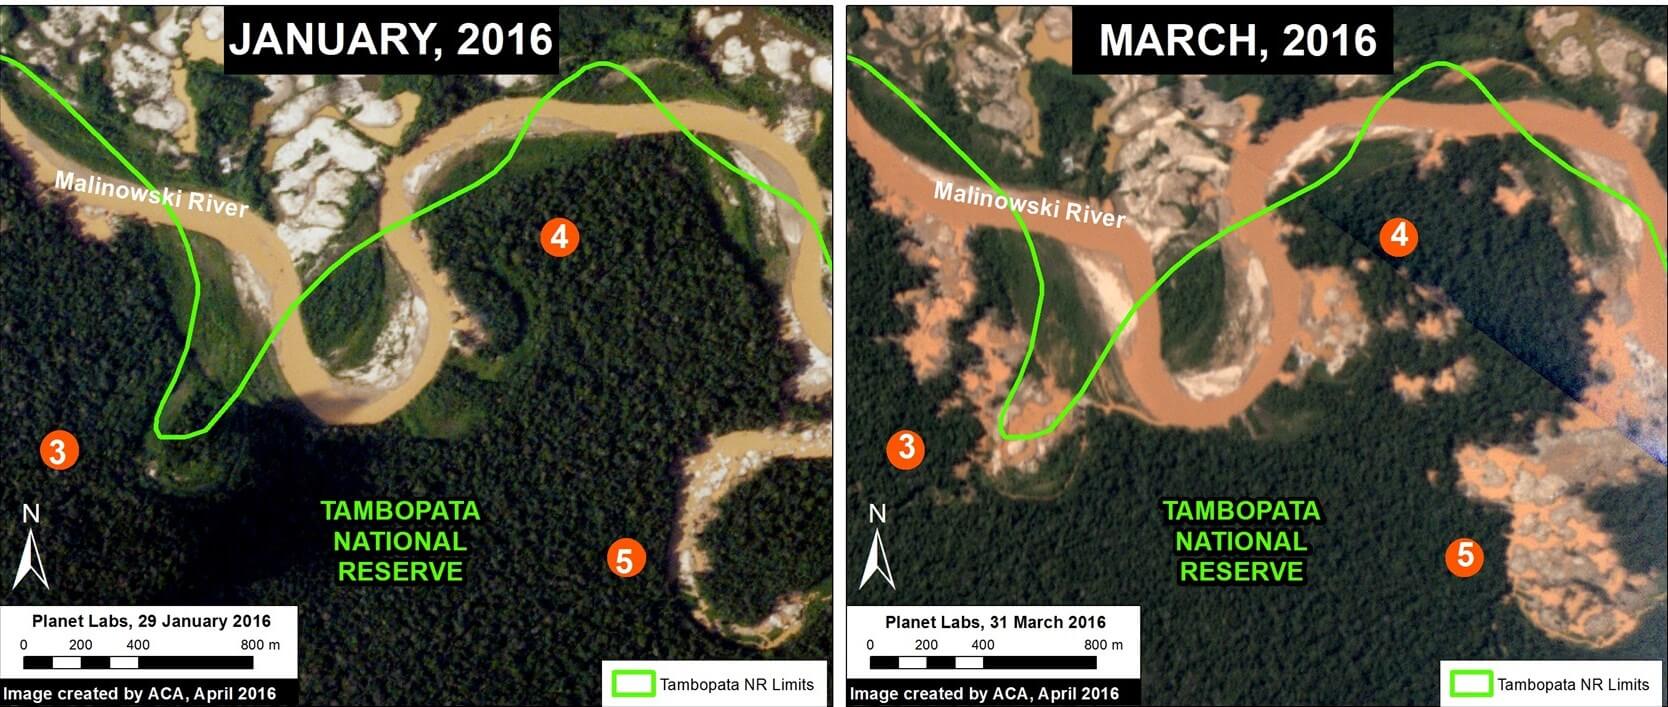
Image 30d. Data: Planet Labs, SERNANP
Major Mining Camp Adjacent to Tambopata Reserve
Image 30e shows, in high-resolution, the establishment of a major mining camp in front of the invaded section of the Reserve (and within the Reserve’s official buffer zone). This Image corresponds to Inset B in Image 30a.
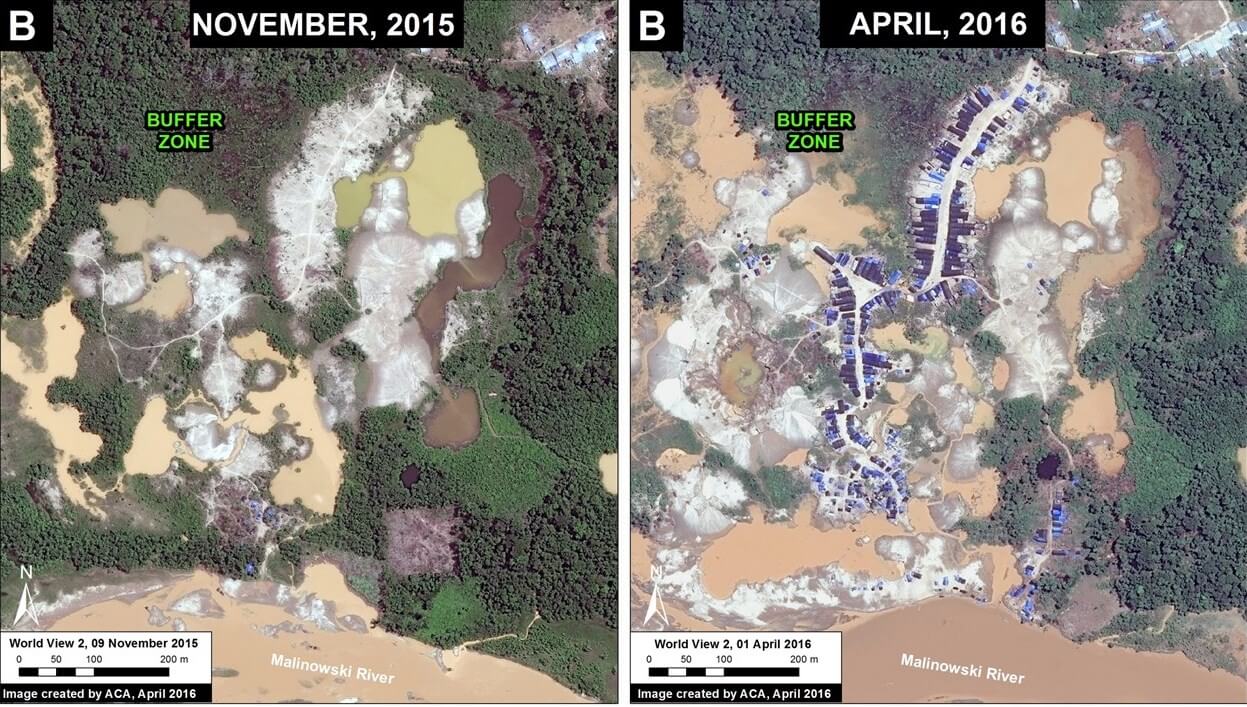
Image 30e. Data: WorldView-2 de Digital Globe (NextView).
Using Radar to Confirm Invasion Continues
In early 2016, the Peruvian government led two major interventions (on January 21 and February 23, respectively) against the illegal miners operating in the interior of the Reserve. However, Image 30f shows in red the continued advance of deforestation (44 hectares) between March 1 (left panel) and March 25 (right panel). In other words, using radar technology (which can pierce through cloud-cover) we can confirm that deforestation continued to advance after the government interventions.
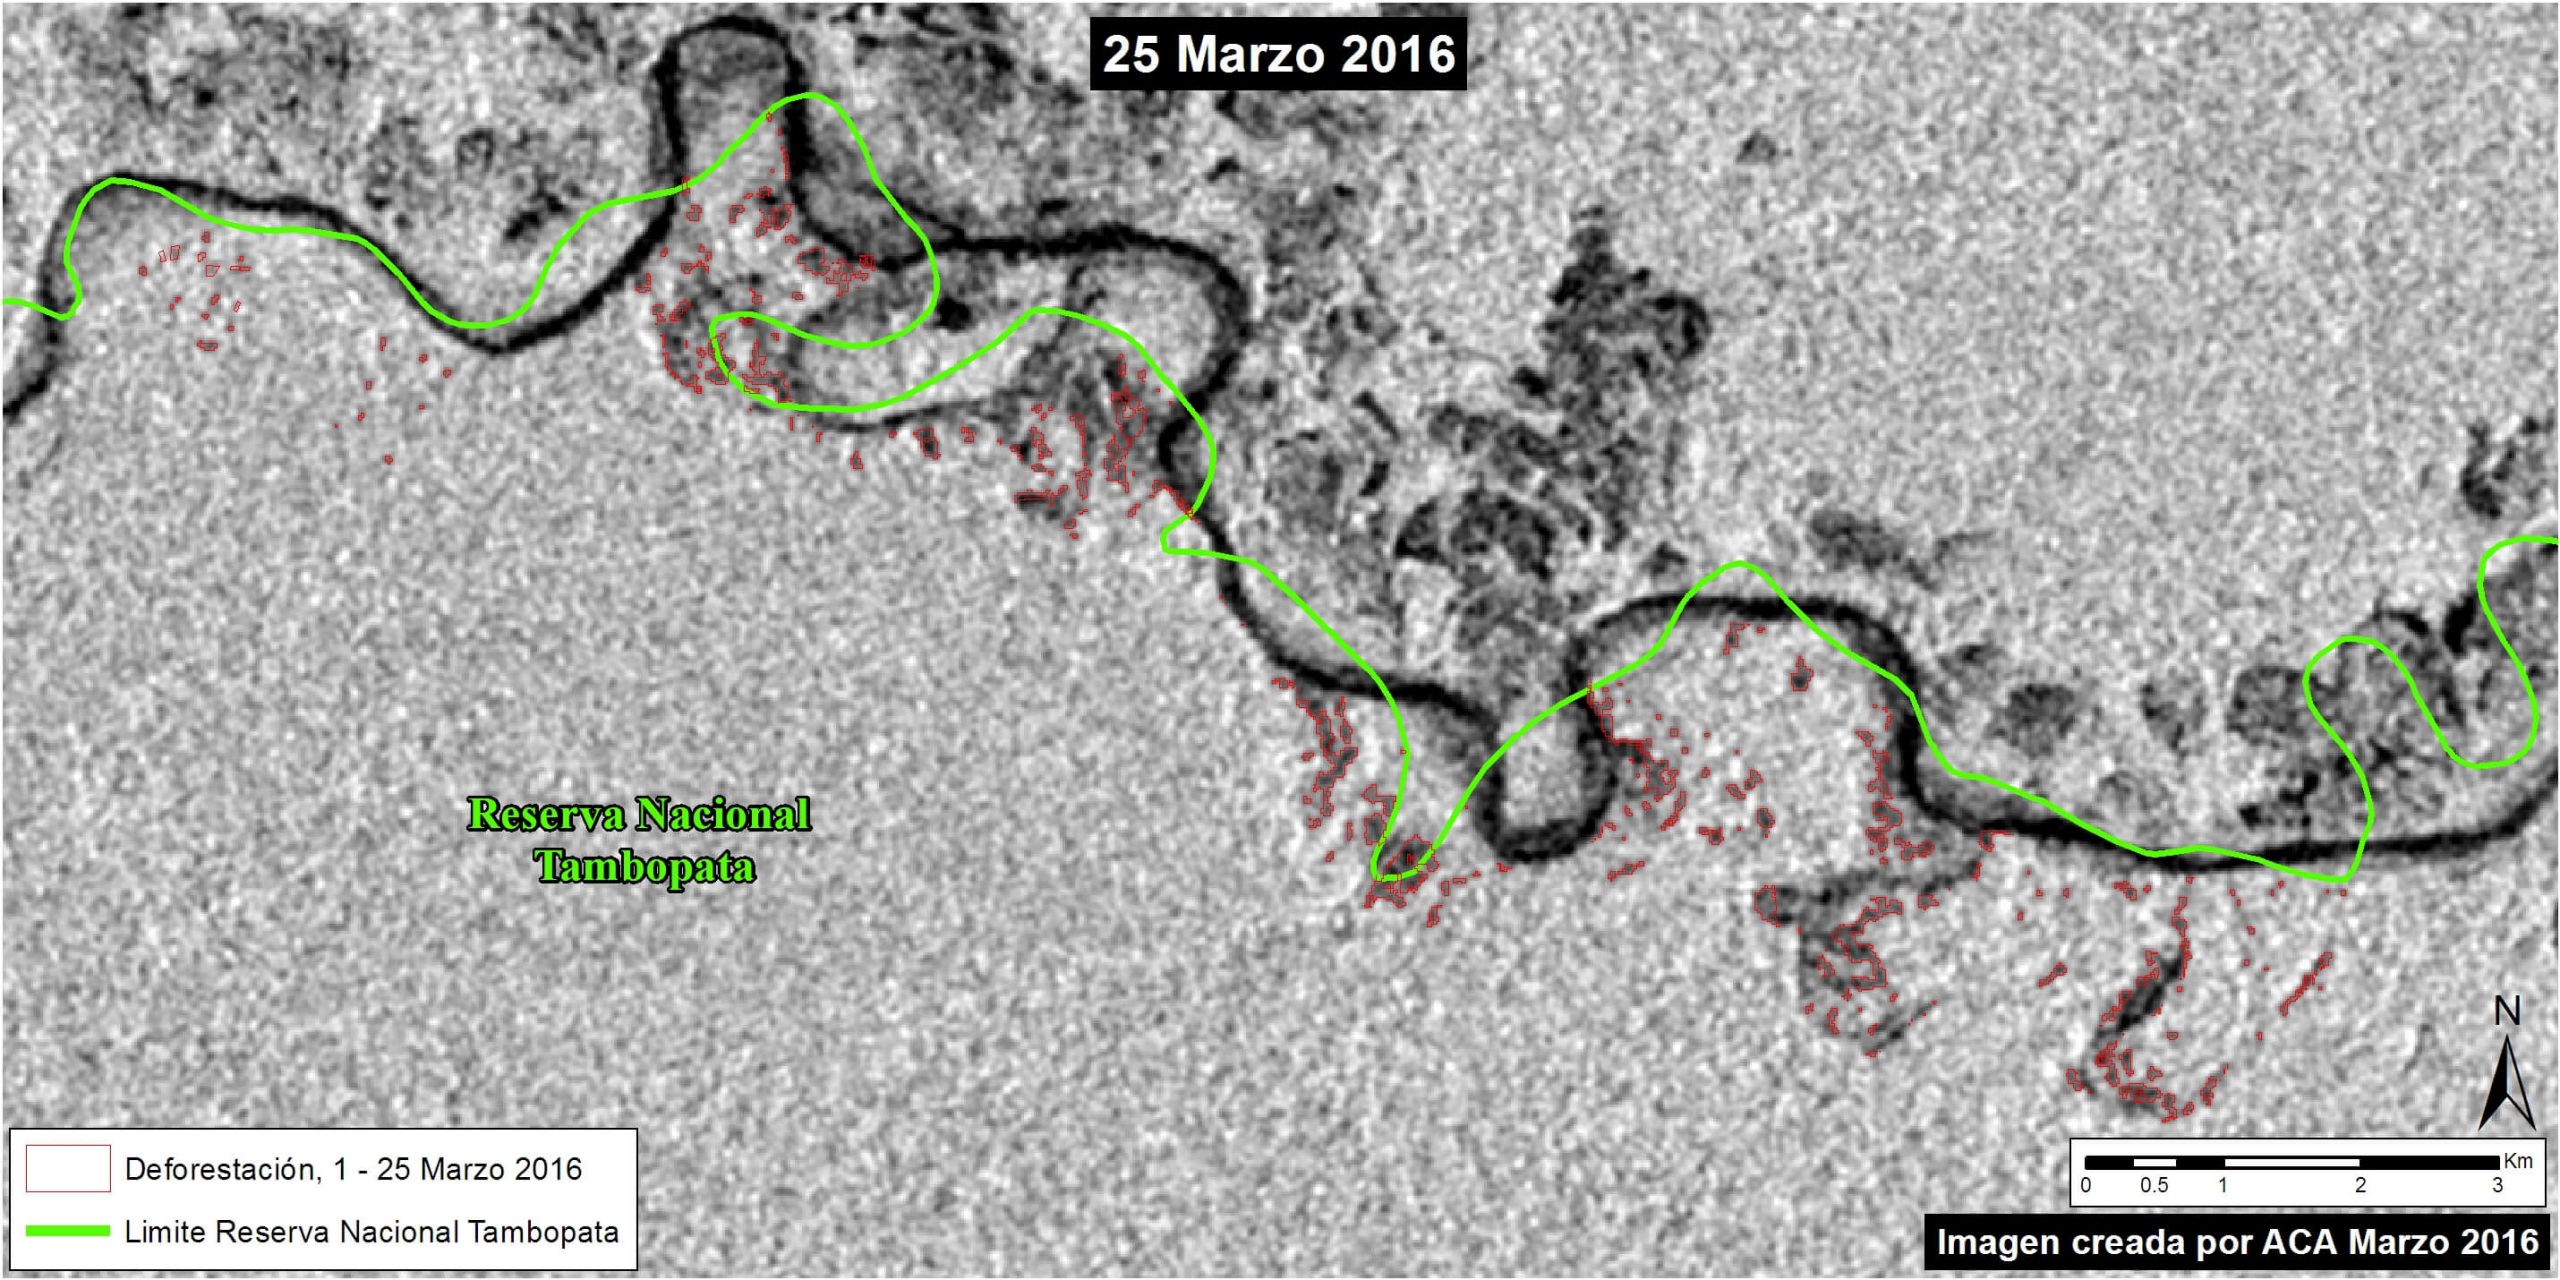
Image 30f. Data: Sentinel-1, SERNANP
Finer M, Novoa S, Olexy T (2016) Invasion of Tambopata National Reserve Intensifies. MAAP: 30.
MAAP #31: Deforestation Continues Expansion in La Pampa (Buffer Zone Of Tambopata National Reserve)
Illegal gold mining deforestation continues to expand in La Pampa, an area located in the buffer zone of Tambopata National Reserve in the Madre de Dios region. Here, we present a series of high-resolution (0.5 m) images that clearly illustrate this expansion. Image 31a shows the large, expanding mass of deforestation in La Pampa (as of November 2015) in relation to the Tambopata National Reserve and its buffer zone. Insets A and B indicate the high-resolution zoom areas, where further below we show the rapid deforestation of 76 hectares (188 acres) between November 2015 and April 2016.
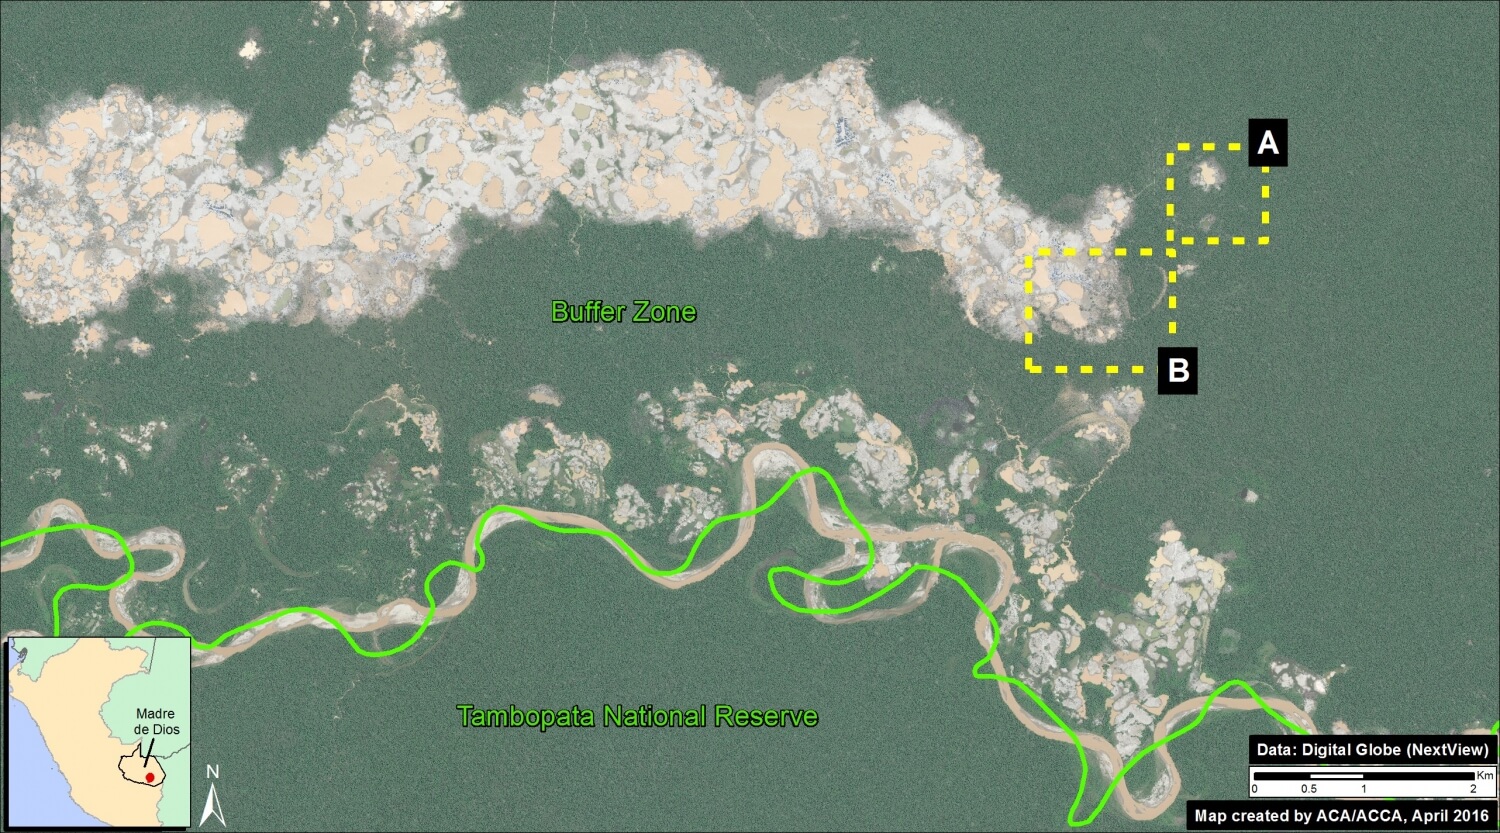
Image 31a. Data: WorldView-2 of Digital Globe (NextView).
Zoom A: Rapid Advance of Deforestation
Image 31b shows the expansion of deforestation (28 hectares) between November 2015 (left panel) and April 2016 (right panel) in the eastern section of La Pampa. The red dot indicates the exact same point in both images across time.
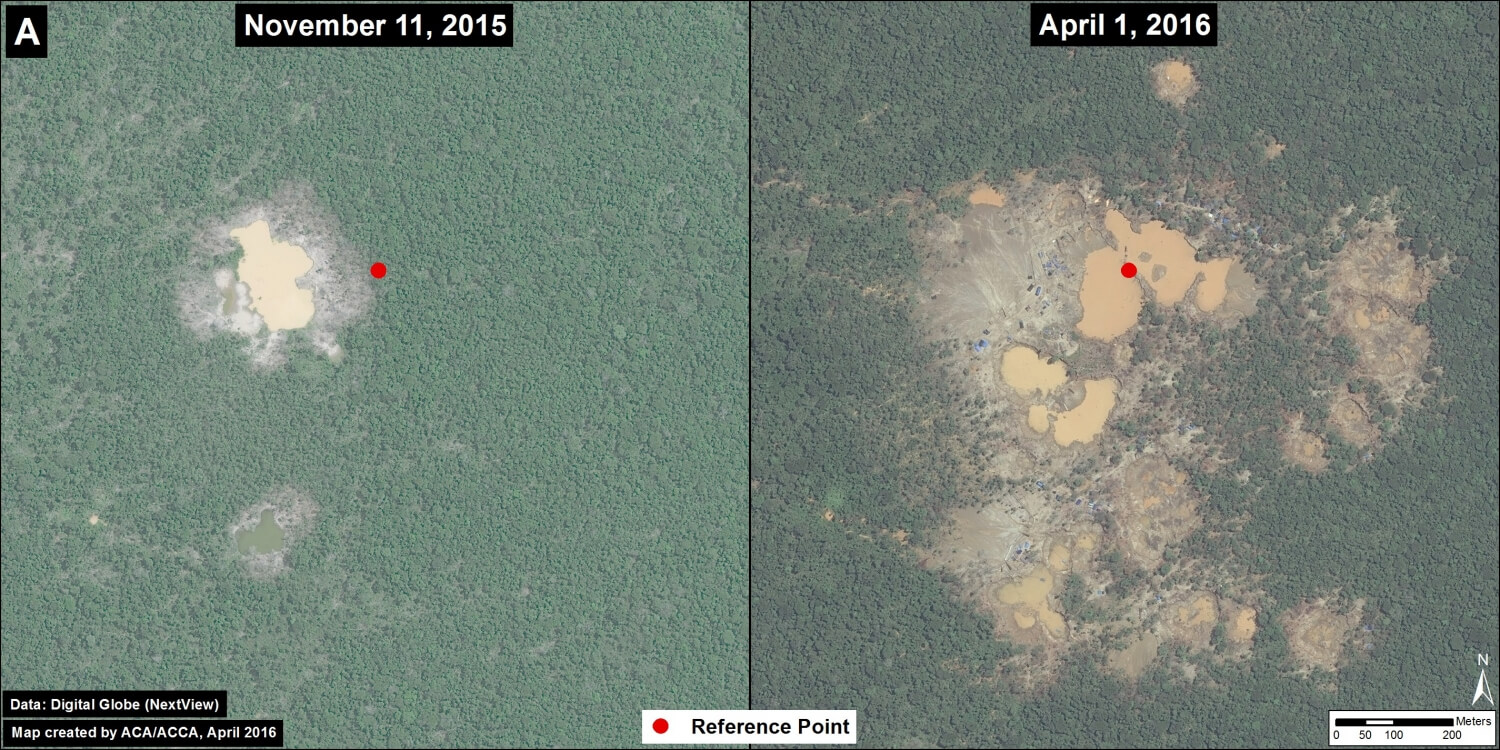
Image 31b. Data: WorldView-2 of Digital Globe (NextView).
Zoom B: Formation of a Large Camp
Image 31c shows the formation of a large mining camp between November 2015 (left panel) and April 2016 (right panel) in the eastern section La Pampa. The red dot indicates the exact same point in both images across time. The image also shows the deforestation of 48 hectares around the camp.
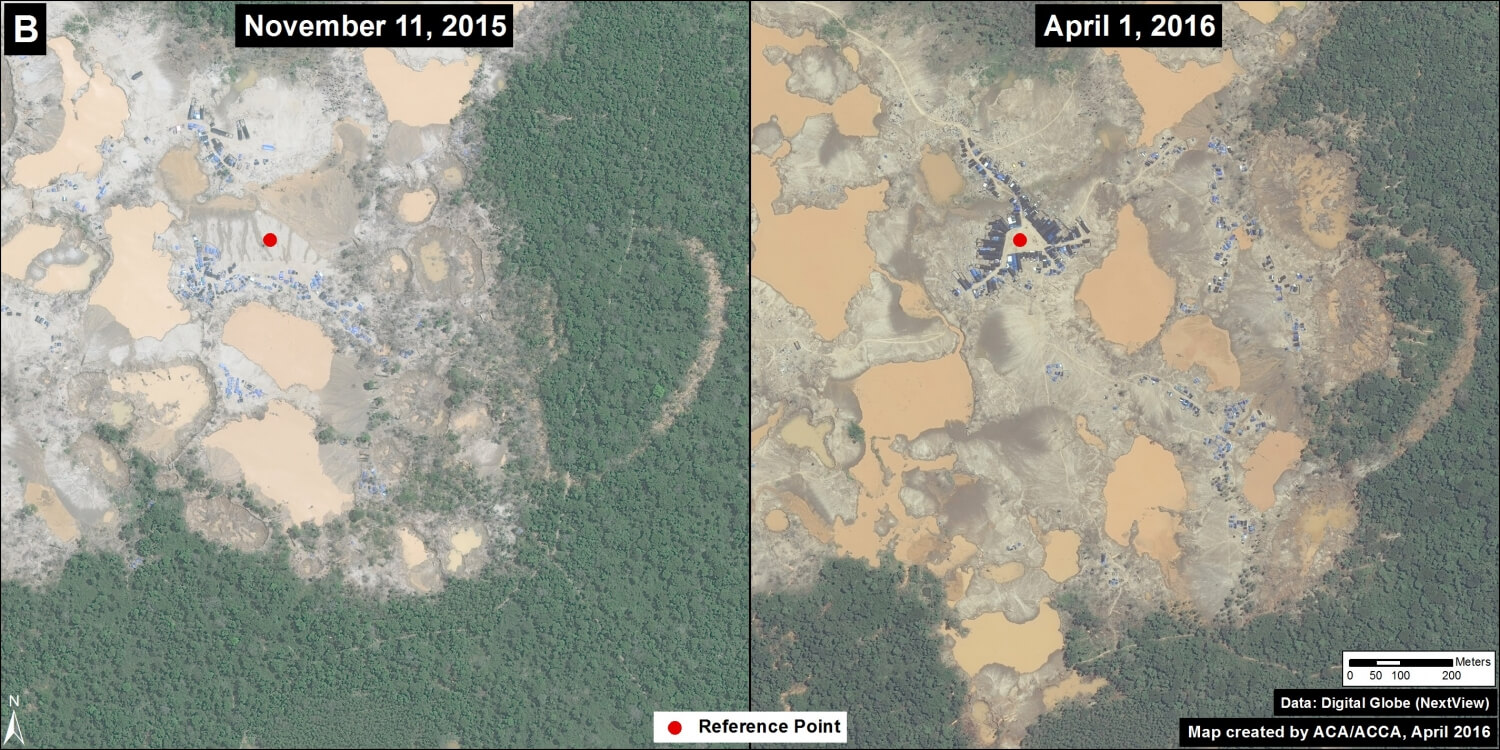
Image 31c. Data: WorldView-2 of Digital Globe (NextView).
Citation
Finer M, Olexy T (2016) Deforestation Continues Expansion in La Pampa (buffer zone of Tambopata National Reserve). MAAP: 31.
MAAP #29: Construction of New Road Between Manu National Park and Amarakaeri Communal Reserve (Madre De Dios)
Here in MAAP #29, we describe the Nuevo Eden-Boca Manu-Boca Colorado road project in the southern Peruvian Amazon (Madre de Dios region). The objective of this article is to show the current state of construction and quantify the direct and indirect deforestation caused thus far by the road. This is a controversial road project because it cuts through the buffer zones of two important protected areas, the Amarakaeri Communal Reserve and Manu National Park*.
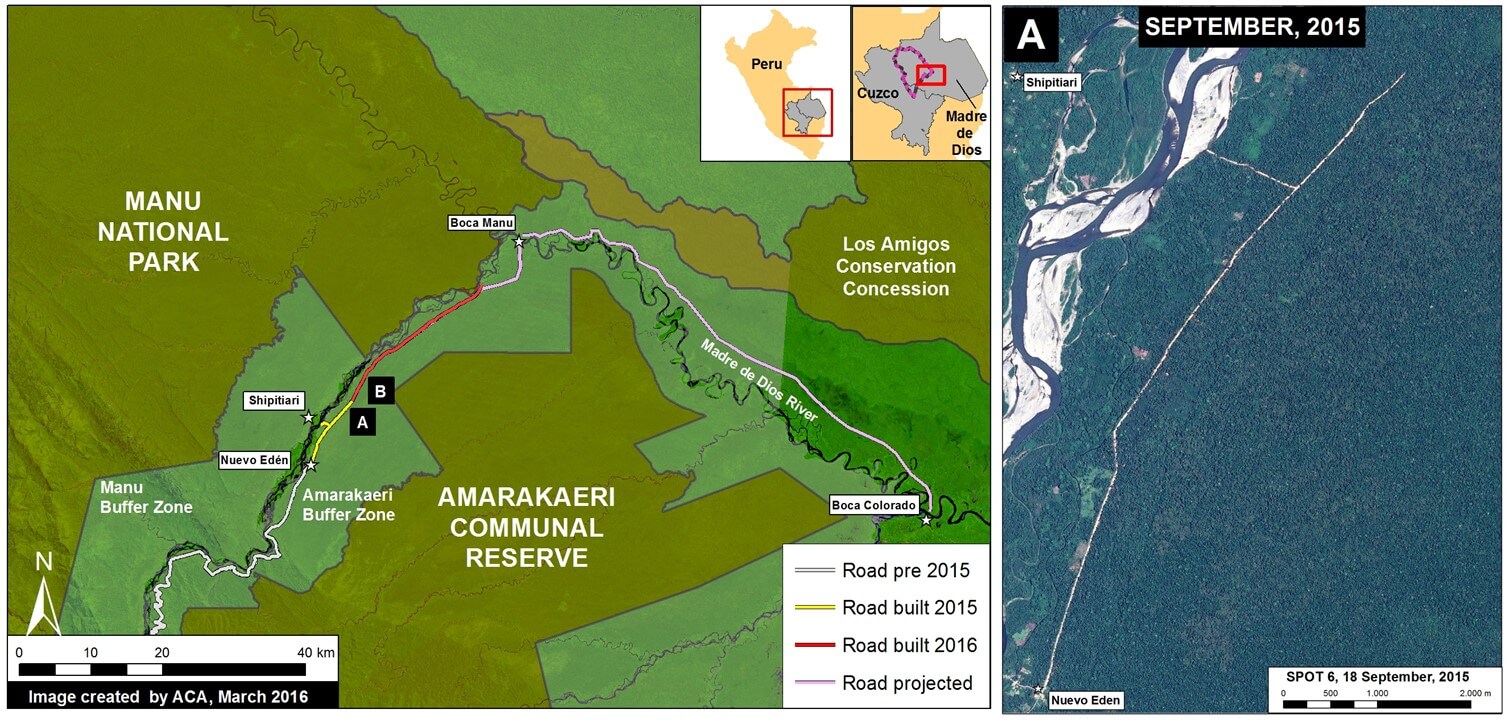
Image 29a. Data: SERNANP, USGS, MINAGRI, IBC, CLASlite, PNCB/MINAM, Hansen/UMD/Google/USGS/NASA, SPOT
Image 29a shows the general context of the area between Amarakaeri and Manu where the road is being constructed. The yellow line indicates the section of road built in 2015 (11.6 km) between the towns of New Eden and Shipetiari (see right panel for high-resolution image of this construction). The red line indicates the new section under construction thus far in 2016 (21.8 km). Thus, in total, we have documented the construction of 33.4 km of road within the Amarakaeri Communal Reserve buffer zone. Finally, the pink line indicates the future road section planned to Boca Manu and then to Boca Colorado.
Road Construction in 2015
Image 29b shows a series of satellite images (Landsat) that illustrate the rapid road construction during 2015. The first two panels show the construction of 11.6 km between February (left panel) and October (central panel) 2015. The yellow arrows in the central panel indicate the direct deforestation (20 hectares) associated with construction of the route. The yellow circles in the right panel indicate the indirect (secondary) deforestation associated with the road (12 hectares). Thus, in total, we have documented the deforestation of 32 hectares (or 79 acres) associated with the road as of mid-March 2016.
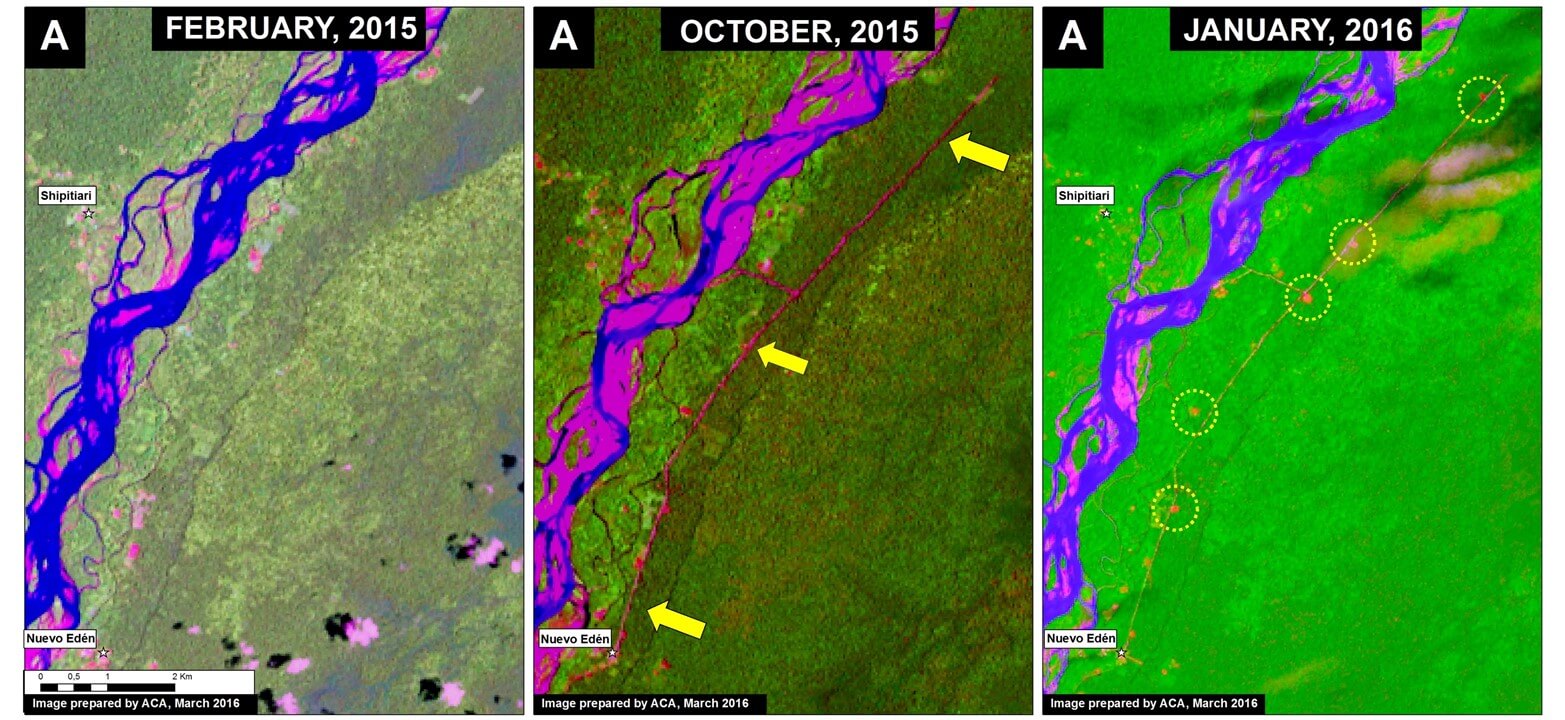
Image 29b. Data: NASA/USGS.
New Road Construction in 2016
Image 29c shows the continued road construction (2.9 km) between January and mid-March 2016 (see orange arrows in the left panel). Moreover, using high-resolution imagery provided by Planet Labs, the right panel shows a new path (see red arrows) that is likely the leading edge of the current road construction. This path now extends an additional 19 km in the direction of Boca Manu (see Image 29d).
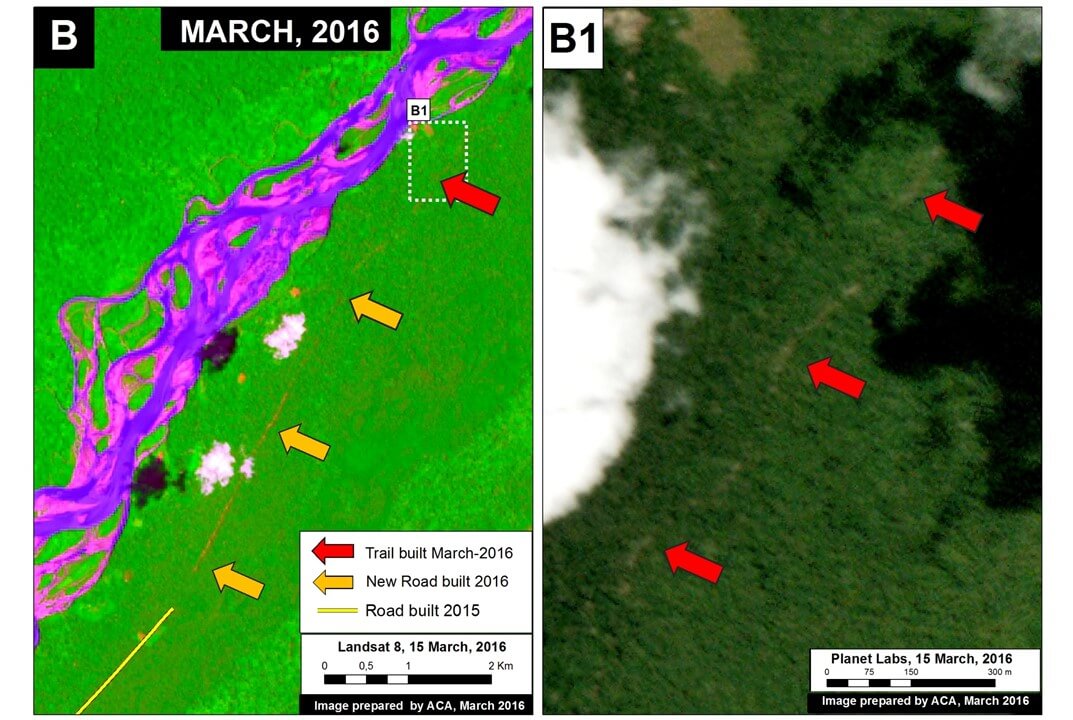
Image 29c. Data: NASA/USGS, Planet Labs
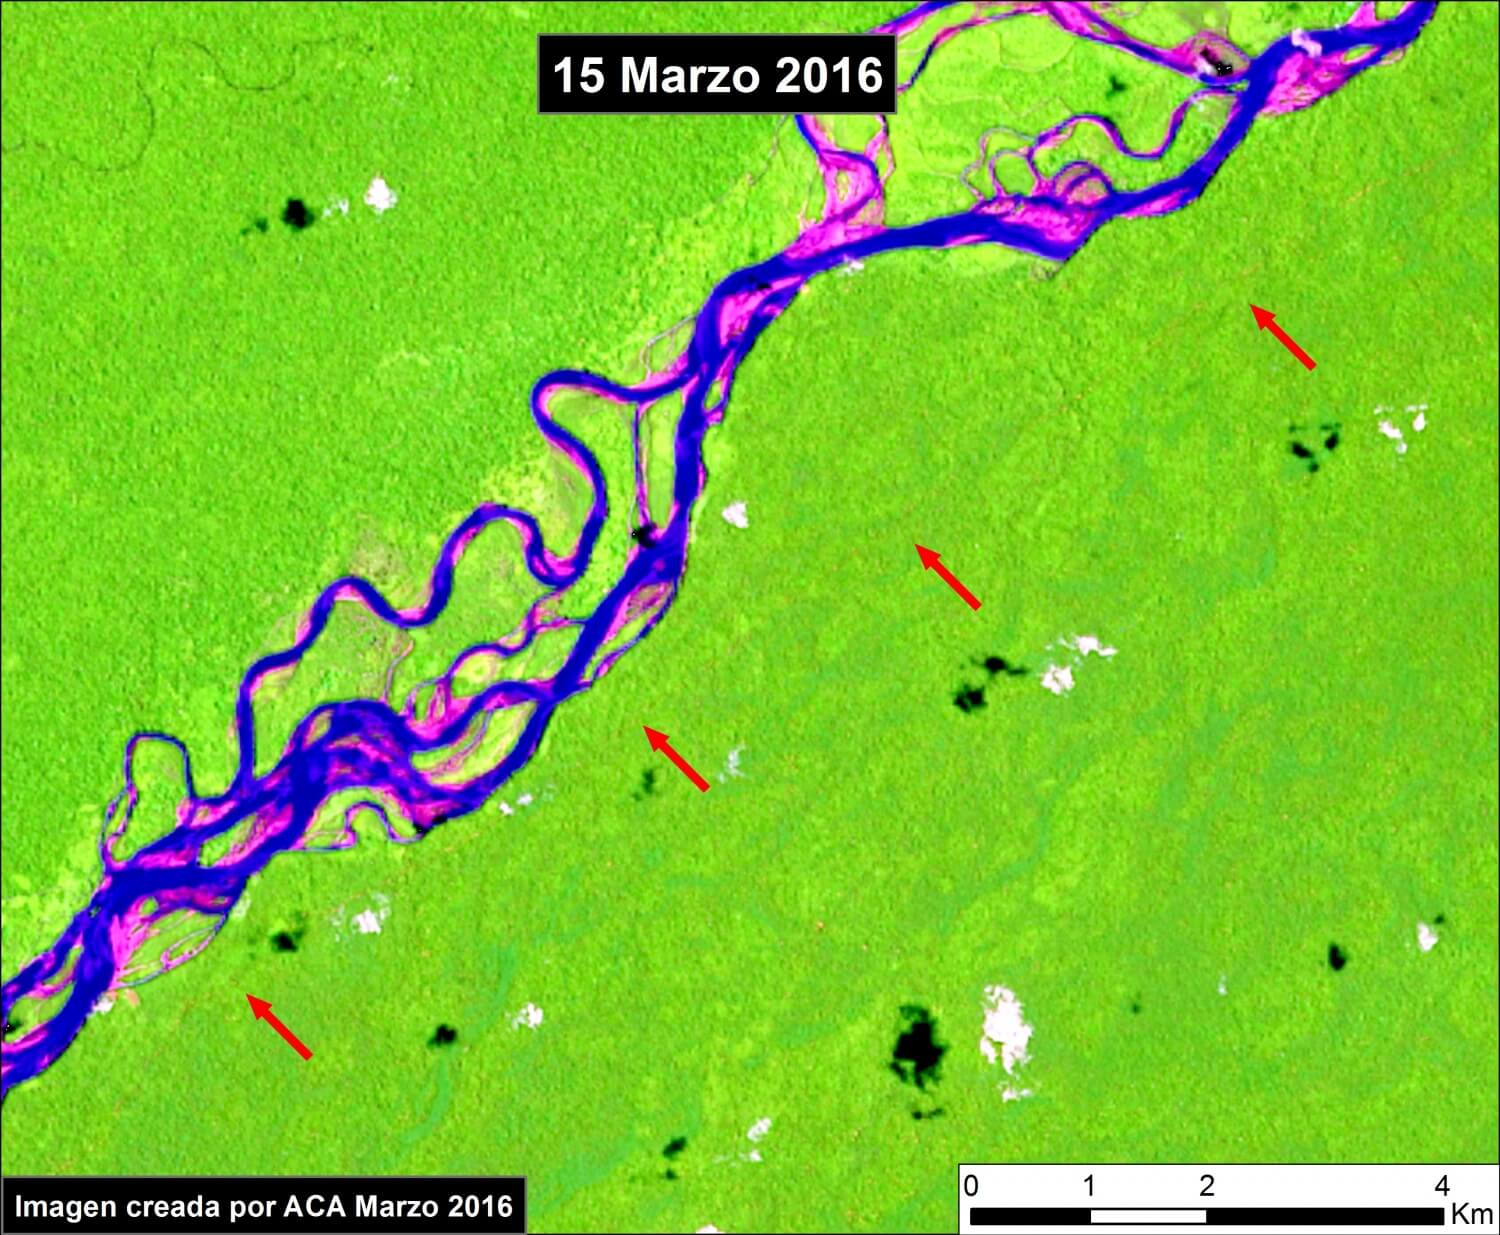
Image 29d. Data: NASA/USGS
References
*MINAM (2016) MINAM está en contra de predictamen que permitiría la construcción de la carretera en zona de amortiguamiento del Manu y de Amarakaeri. http://www.minam.gob.pe/perucrecimiento/2016/02/29/minam-esta-en-contra-de-predictamen-que-permitiria-la-construccion-de-la-carretera-en-zona-de-amortiguamiento-del-manu-y-de-amarakaeri/
MINAM (2015) MINAM y SERNANP manifiestan preocupación por aprobación de ley que declara de interés nacional carretera en zona de amortiguamiento del Manu y Amarakaeri. http://www.minam.gob.pe/notas-de-prensa/minam-y-sernanp-manifiestan-preocupacion-por-aprobacion-de-ley-que-declara-de-interes-nacional-carretera-en-zona-de-amortiguamiento-del-manu-y-amarakaeri/
Citation
Finer M, Novoa S, Olexy T (2016) Construction of a New Highway between Manu National Park and Amarakaeri Communal Reserve (Madre de Dios), 2016. MAAP: 29.
MAAP #28: New Deforestation Hotspot Along Interoceanic Highway in Southern Peruvian Amazon (Madre De Dios)
We have previously detailed the extensive illegal gold mining problem in the southern Peruvian Amazon (Madre de Dios region), but here in MAAP #28 we detail the emergence of another deforestation hotspot in the region. Image 28a shows the intensification of this hotspot, located along the newly paved Interoceanic highway around the town of Iberia (see Inset F), between 2012-14 (left panel) and 2015 (right panel). Note that the gold mining hotspot, indicated by Inset E, remained consistently high among the two time frames.
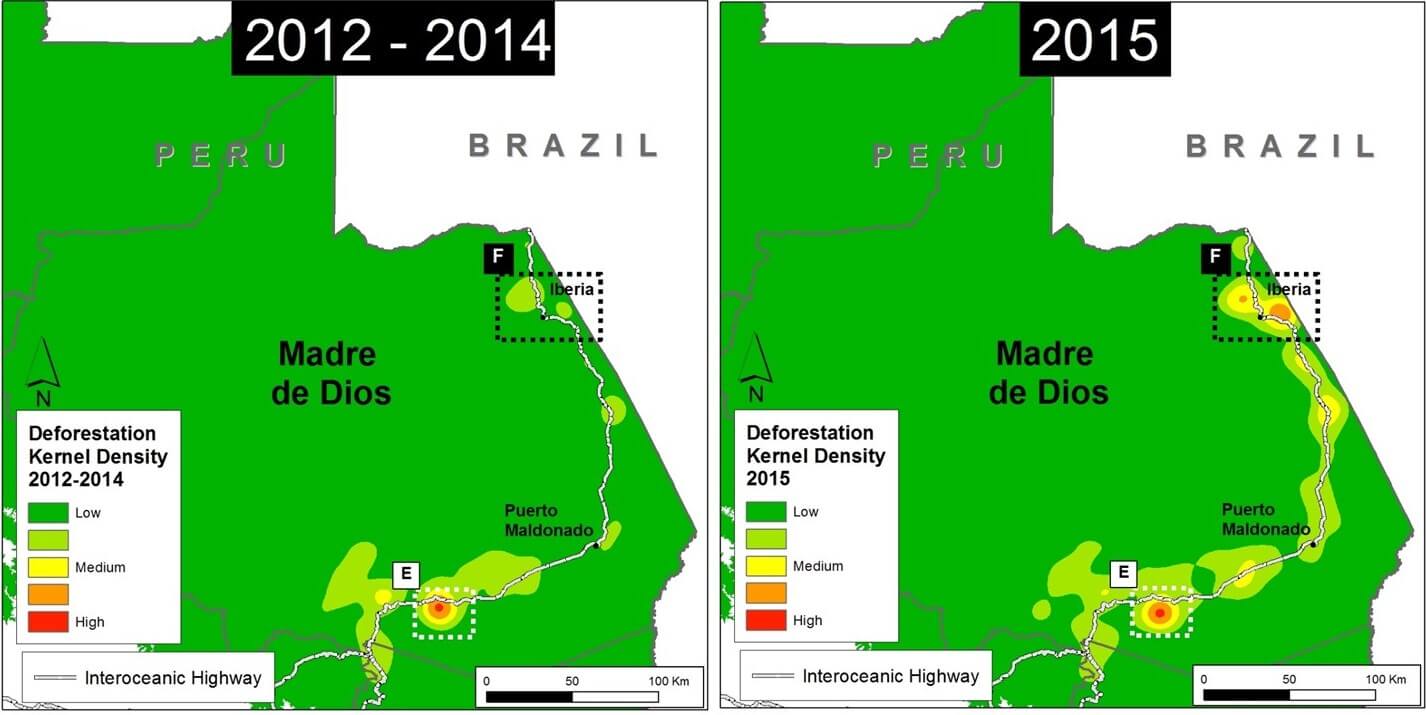
Image 28a. UMD/GLAD, PNCB/MINAM
2015 Deforestation Hotspot Base Map
This analysis builds off the previous MAAP #26, where we presented an initial map of “Deforestation hotspots in the Peruvian Amazon in 2015,” based on an analysis of data from the new GLAD* alerts.
Image 28b shows an updated version of the 2015 Peruvian Amazon deforestation hotspots map. Inset F shows the new hotspot featured in this article (see details below).
Note about the Hotspots: Insets A and B indicate two hotspots in the Ucayali region – see MAAP #26 for more detail. Insets C and D indicate two hotspots in Huánuco that we are currently analyzing. Inset E indicates the illegal gold mining zone known as La Pampa, described in various MAAP articles (for example, see MAAP #12). Inset F shows the area of interest in this article.
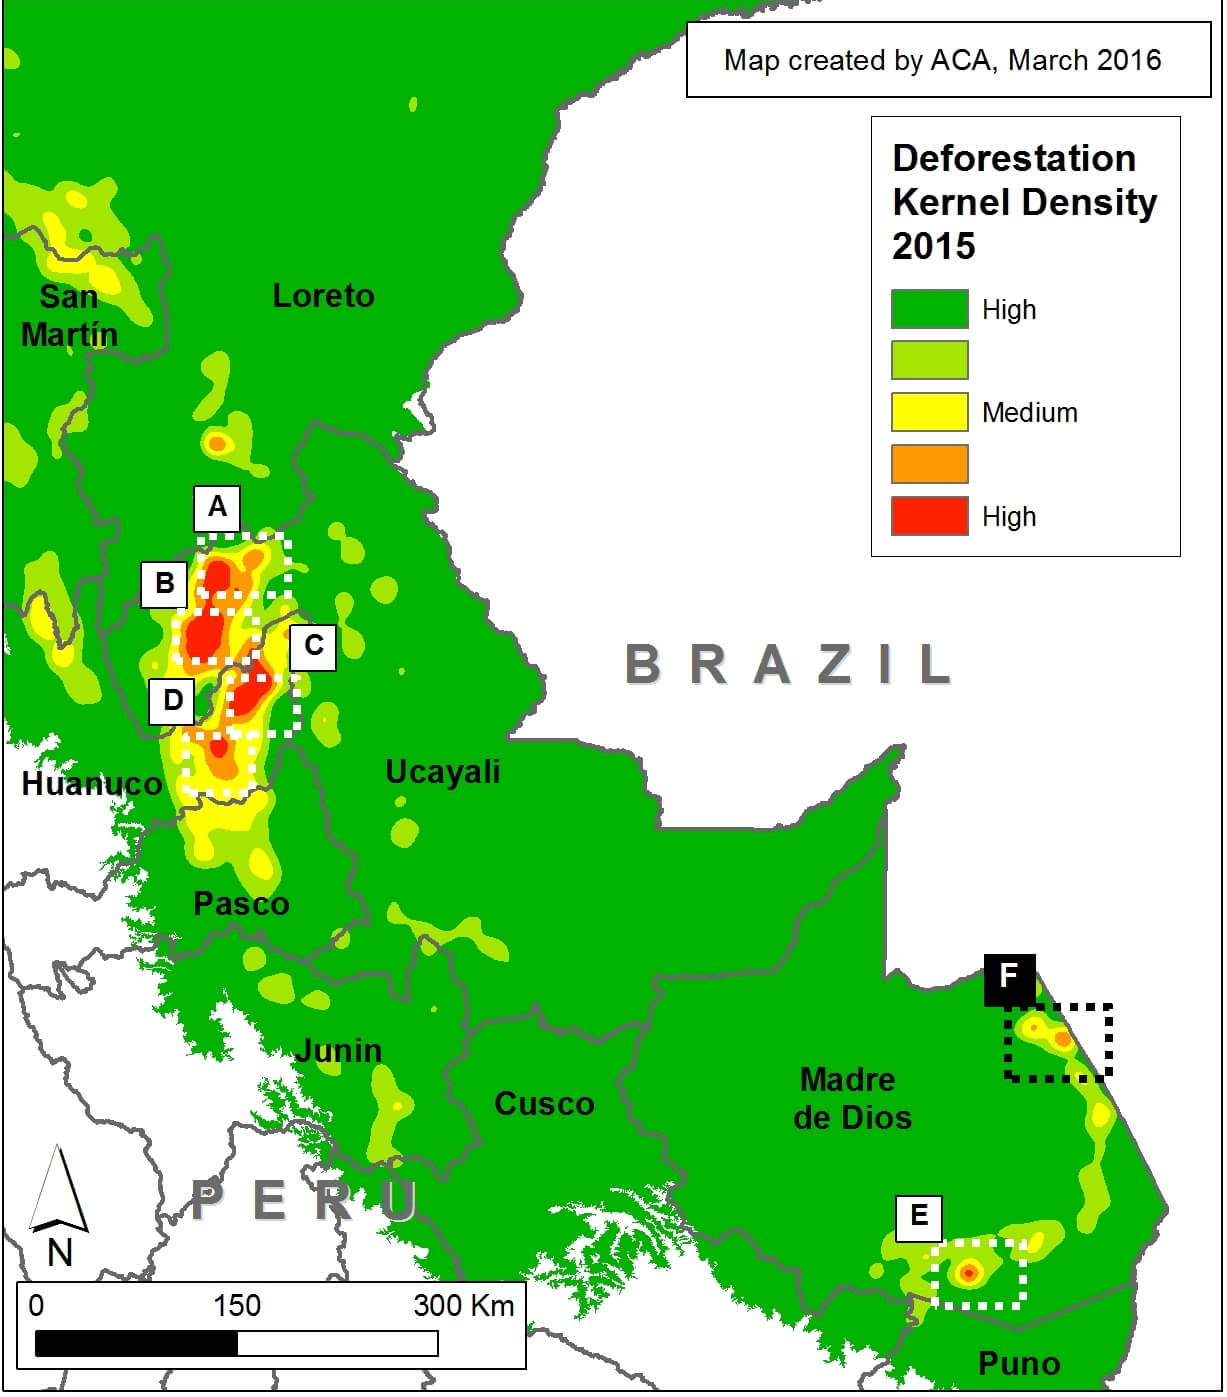
Image 28b. UMD/GLAD
New Deforestation Front
Image 28c shows detailed information about the deforestation surrounding the town of Iberia in northeast Madre de Dios (see Inset F in Image 28a for context).
Note the extensive deforestation in both 2014 and 2015 along both sides of the Interoceanic highway (1,830 hectares, or 4,522 acres).
Also note that much of the deforestation is an agglomeration of small-scale patches and occurs within forestry concessions (timber and rubber harvesting).
Insets F1 and F2 show the zooms described in greater detail below.
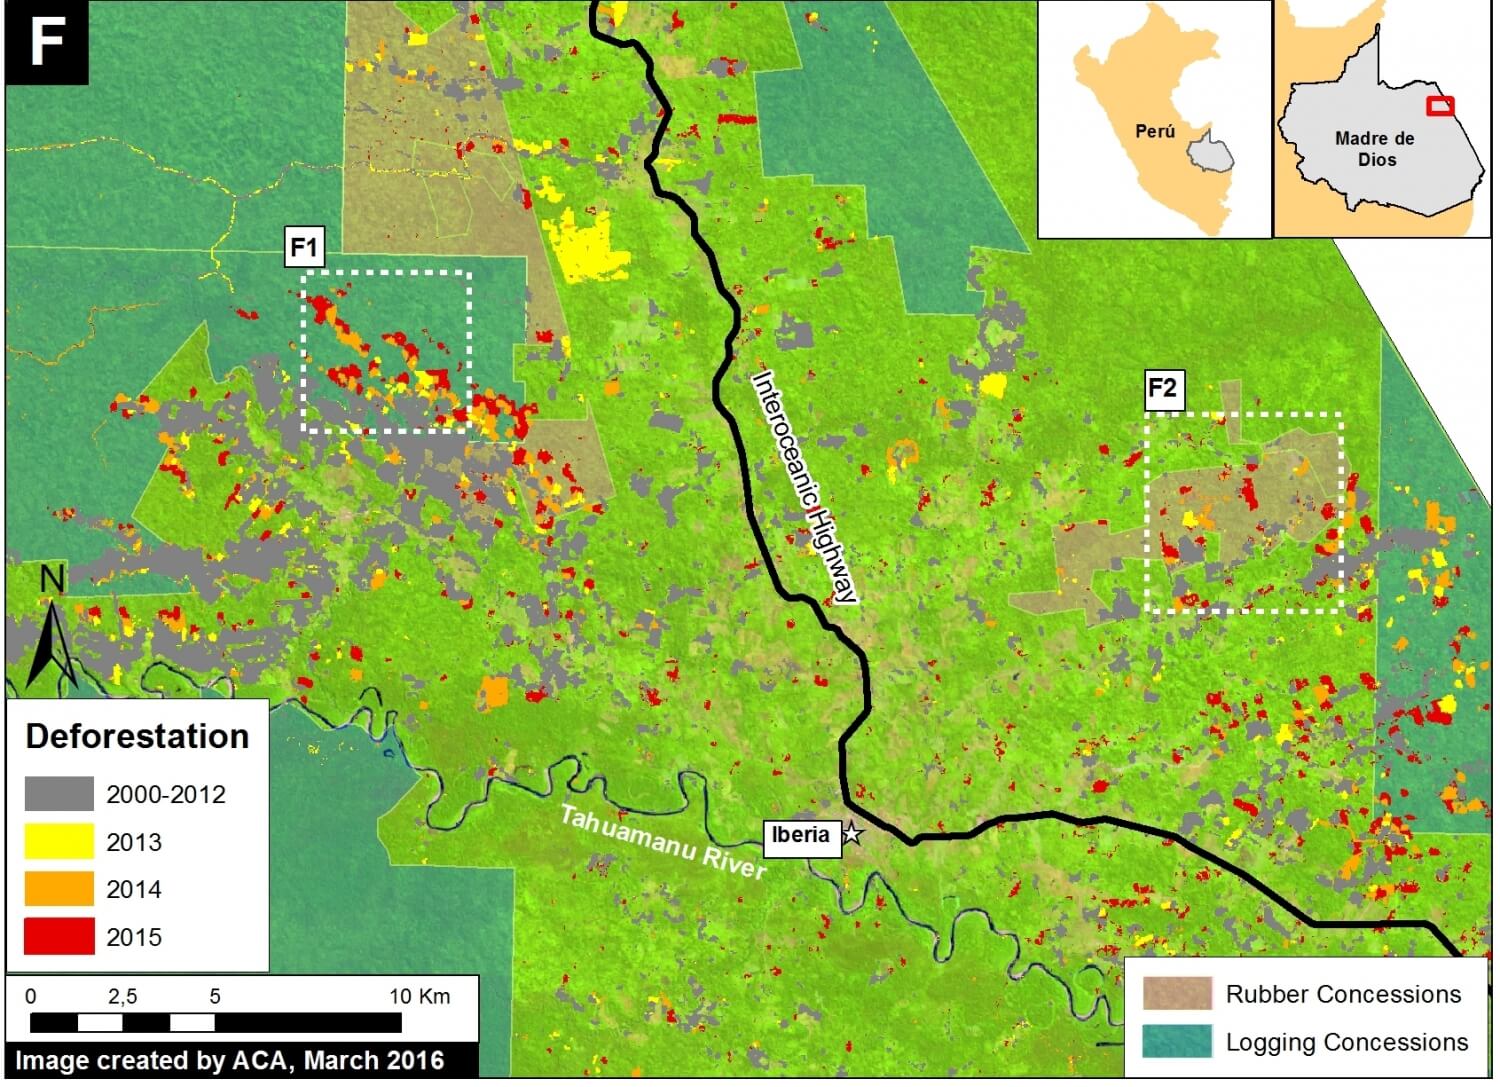
Image 28c. PNCB/MINAM, Hansen/UMD/Google/USGS/NASA, UMD/GLAD, MTC, MINAGRI
Zoom F1
Image 28d compares two satellite images of the area indicated in Inset F1 (see Image 28c for context) between September 2013 (left panel) and January 2016 (right panel). Note the large increase in newly deforested areas for what appears to be small-scale agricultural inside a timber concession.
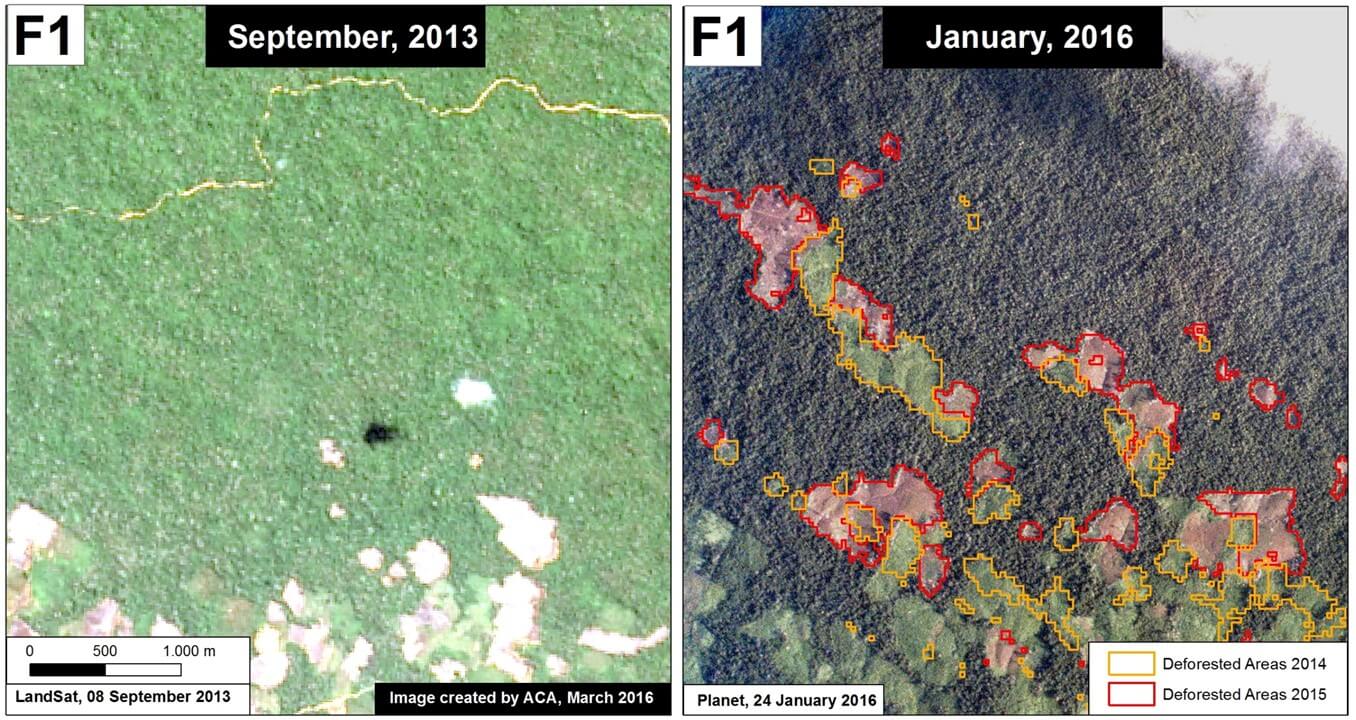
Image 28d. Data: NASA/USGS, Planet Labs, PNCB/MINAM, UMD/GLAD
Zoom F2
Image 28e compares satellite images of the area indicated in Inset F2 (see Image 28c for context) between September 2013 (left panel) and December 2015 (right panel). Note the large increase in newly deforested areas for what appears to be small-scale agricultural within a rubber concession.
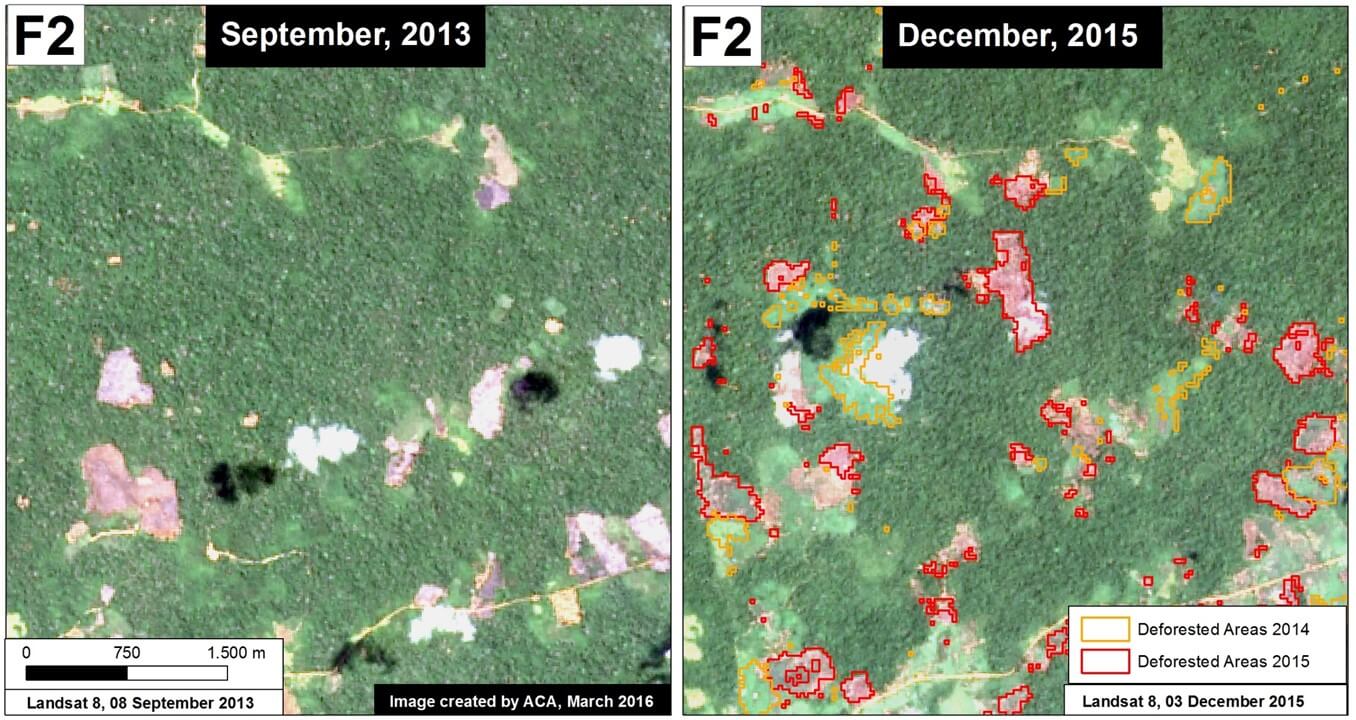
Image 28e. Data: NASA/USGS.
References
* Produced by the University of Maryland, Google, and WRI’s Global Forest Watch. http://www.globalforestwatch.org/map/5/-9.31/-75.01/PER/grayscale/umd_as_it_happens
*Hansen, M.C., A. Krylov, A. Tyukavina, P.V. Potapov, S. Turubanova, B. Zutta, S. Ifo, B. Margono, F. Stolle, and R. Moore. Humid tropical forest disturbance alerts using Landsat data. Environ. Res. Lett. 11: 034008.
Citation
Finer M & Novoa S (2016) New Deforestation Hotspot in Madre de Dios, 2016. MAAP: 28.
MAAP #27: United Cacao Continues Deforestation of Primary Forest In Tamshiyacu (Loreto, Peru)
Deforestation continues to increase in the land owned and operated by United Cacao near the town of Tamshiyacu in the northern Peruvian Amazon. Since 2013, we have documented the deforestation of 2,380 hectares (5,880 acres) related to this project, the vast majority at the expense of primary forest*. Of this total, 250 hectares were clear-cut after the Peruvian Ministry of Agriculture ordered the “paralyzation” of the company’s agricultural activities in December 2014**. Here in MAAP #27, we present evidence that indicates the deforestation related to this project will continue to expand in the coming months.
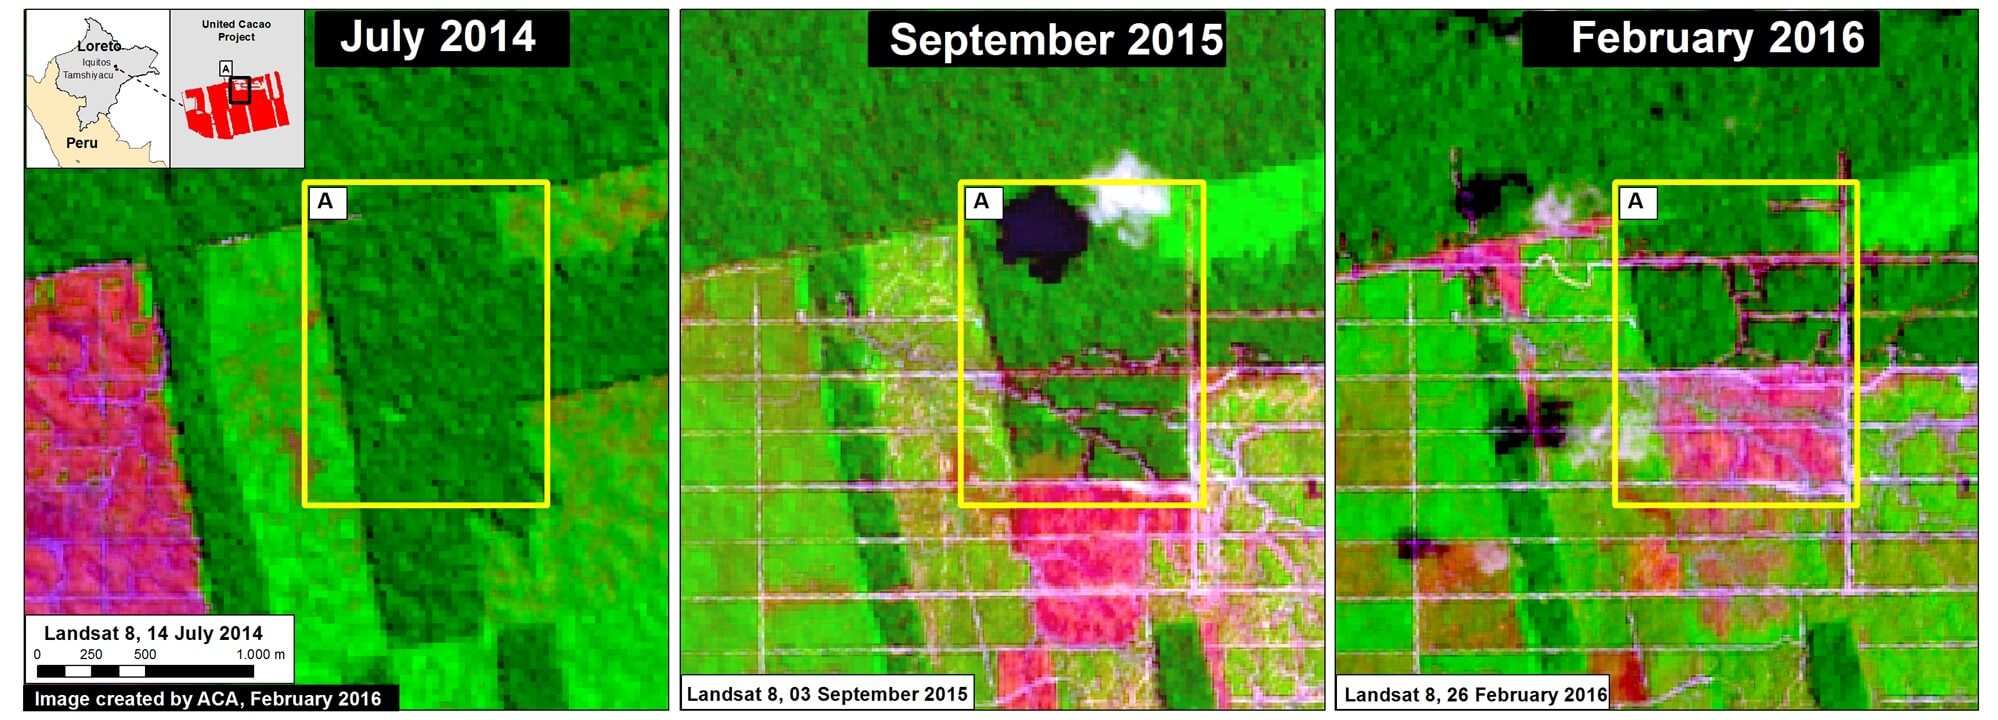
Image 27a. Data: USGS.
Image 27a shows a series of satellite images (Landsat) that shows the advance of deforestation in in the northern part of the United Cacao project. The left panel shows this area contained a remnant of primary forest (see dark green color in Inset A) in July 2014. The central panel shows that, by September 2015, a new access road network was constructed in the southern part of this area (see pink color, which indicates recently deforested areas). Finally, the right panel shows that in February 2016 (the most recent image), the southern part of that same area is now deforested, while a new access road network has been constructed to the north. Thus, if this pattern continues (access roads followed by large-scale deforestation), we predict that deforestation will soon occur in this northern area.
High-Resolution View
Image 27b shows, in high-resolution, the deforestation of primary forest between June (left panel) and November (right panel) of 2015 in the northern part of the United Cacao project described above (see red box in both images). The image also shows the area of primary forest that is now threatened with additional deforestation (see yellow box in both images).
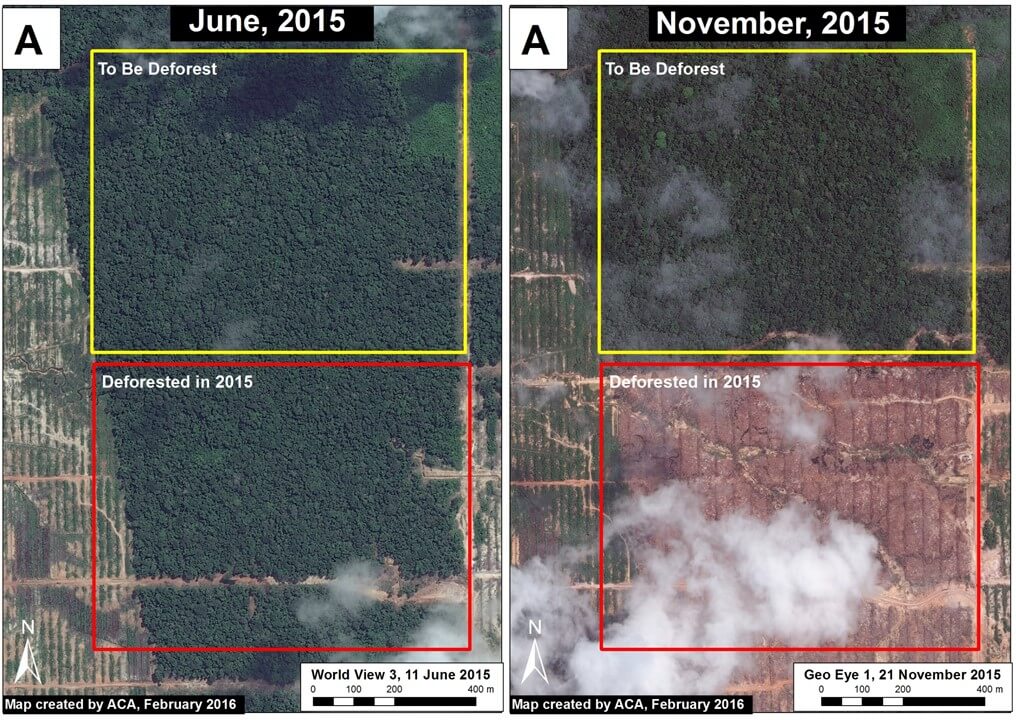
Image 27b. Data: WorldView-3 from Digital Globe (NextView).
Deforestation Trend
The graph to the right shows the trend of accumulated deforestation in the United Cacao project area between 2012 and February 2016. The company began operations in early 2013, the same year as the large increase in deforestation. Also note that deforestation increased in 2015 despite the Ministry of Agriculture’s “paralyzation” order in late 2014.
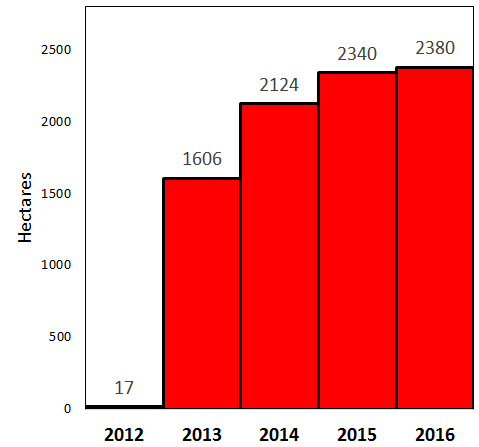
Data: PNCB/MINAM, Hansen/UMD/Google/USGS/NASA, Hansen et al 2016 (ERL)***
GLAD weekly alerts
It is worth emphasizing how quickly and precisely the new GLAD weekly alert system picked up the new access road construction in 2016 (see Image 27c).
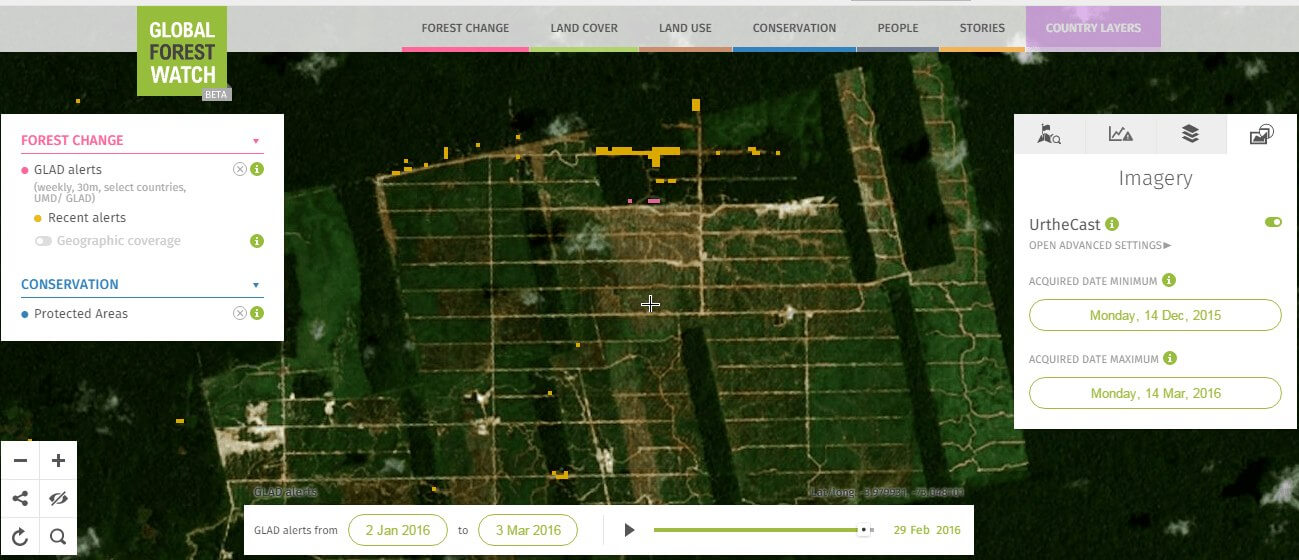
Image 27c. Data: UMD/GLAD, GFW, UrtheCast
Notes
*According to the Supreme Decree (No. 018-2015-MINAGRI) approving the Regulations for Forest Management under the framework of the new 2011 Forestry Act (No. 29763), the official definition of primary forest in Peru is: “Forest with original vegetation characterized by an abundance of mature trees with species of superior or dominant canopy, which has evolved naturally.” Using methods of remote sensing, our interpretation of that definition are areas that from the earliest available image (in this case, from 1985) are characterized by dense closed-canopy coverage and experienced no major clearing events. See MAAP #9 and MAAP #2 for more details.
** Resolución de Dirección General N° 462-2014-MINAGRI-DVDIAR-DGAAA. A recent press release from the organization Environmental Investigation Agency reports that the order is still in effect (http://eia-global.org/blog/united-cacao-linked-companies-ordered-to-stop-operations-by-peruvian-author).
***Hansen, M.C., A. Krylov, A. Tyukavina, P.V. Potapov, S. Turubanova, B. Zutta, S. Ifo, B. Margono, F. Stolle, and R. Moore (2016) Humid tropical forest disturbance alerts using Landsat data. Environ. Res. Lett. 11: 034008. Accessed through Global Forest Watch: www.globalforestwatch.org
Citation
Finer M, Novoa S (2016) United Cacao Continues Deforestation of Primary Forest in Tamshiyacu (Loreto, Peru). MAAP: #27.
MAAP #26: Deforestation Hotspots in the Peruvian Amazon, 2015
Thanks to the newly launched GLAD alerts (developed by the University of Maryland and Google1, and presented by Global Forest Watch), we now have weekly access to high-resolution forest loss data across Peru. Here in MAAP #26, we analyze the first batch of this data to better understand deforestation patterns in the Peruvian Amazon in 2015. In the coming weeks and months, we will use this map as a base for investigating major hotspots of forest loss in the country.
According to the GLAD alert data, total estimated forest loss in Peru in 2015 was 158,658 hectares (392,050 acres). If confirmed, that represents the second highest total on record, behind only 2014 (177,500 hectares).
To better understand where the GLAD alert data was concentrated in 2015, we conducted kernel density estimation, a type of analysis that calculates the magnitude per unit area of a particular phenomenon (in this case, forest loss). Image 26a shows the kernel density map for forest loss in the Peruvian Amazon in 2015. It reveals that recent deforestation was concentrated in a number of hotspots in the departments of Huánuco, Madre de Dios, and Ucayali.
Note that in MAAP #25, we conducted this same type of analysis for 2012 – 2014 forest loss data. Thus, with this latest analysis we can see how deforestation trends shifted in 2015.
Insets A and B highlight an area in central Peru (department of Ucayali) where deforestation intensified in 2015. See below for high-resolution images showing the deforestation in these areas. In the coming weeks and months, we will be publishing additional articles highlighting other key 2015 deforestation hotspots.

Image 26a. Kernel density map for forest loss in the Peruvian Amazon in 2015. Data: Hansen et al 2016 (ERL).
Inset A
Image 26b shows detailed deforestation information for the area indicated in Inset A (from Image 26a). Note the extensive 2015 deforestation just to the west of two large-scale oil palm plantations (201 hectares, see pink areas).
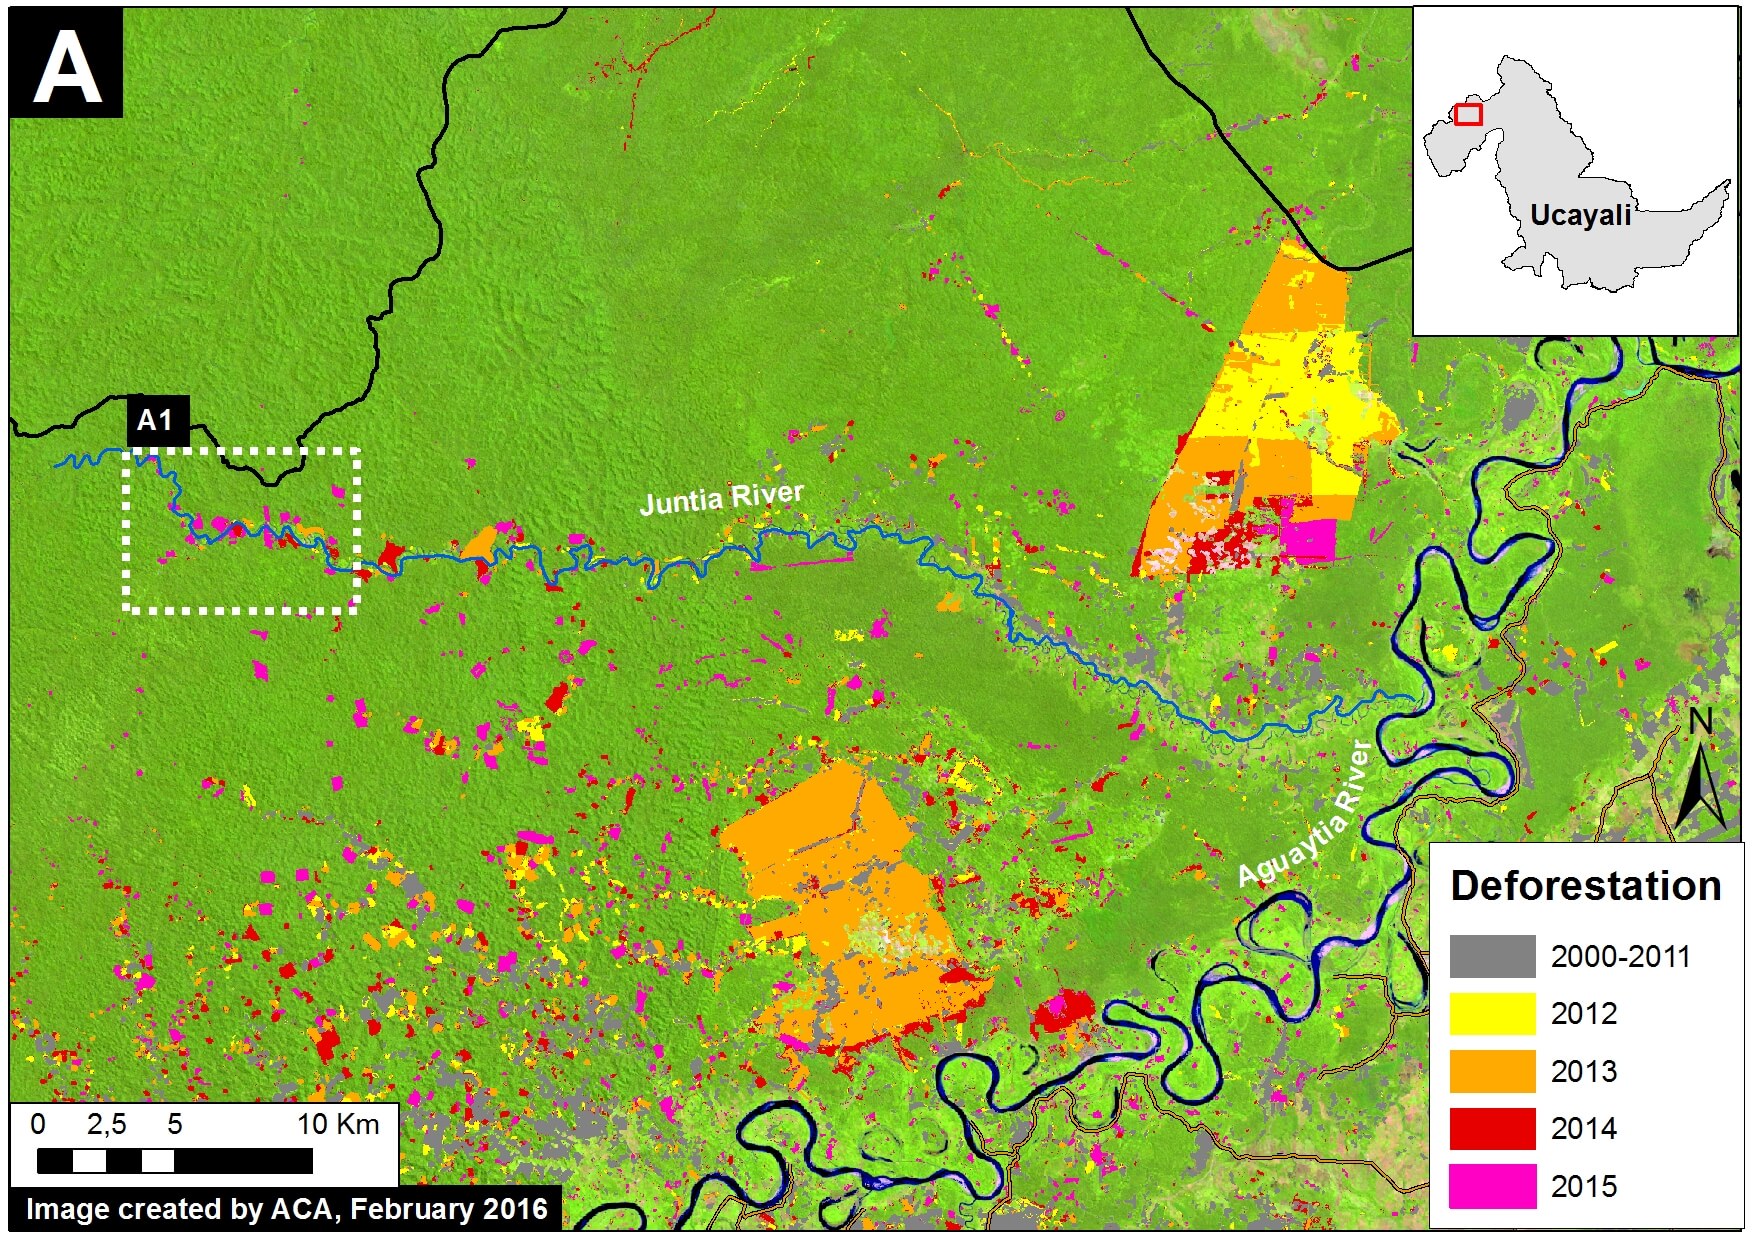
Image 26b. 2000-15 deforestation for area in Inset A. Data: Hansen et al 2016 (ERL), PNCB/MINAM, Hansen/UMD/Google/USGS/NASA, USGS (Landsat 8)
Further below, Image 26c shows a high-resolution satellite image of the area in Inset A1 before (left panel) and after (right panel) the recent deforestation events.

Image 26c. High-resolution view of area in Inset A1 before (left panel) and after (right panel) recent deforestation events. Data: WorldView-2 de Digital Globe (NextView).
Inset B
Image 26d shows detailed deforestation information for the area indicated in Inset B (from Image 26a). Note the extensive 2015 deforestation along the Aguaytia River (164 hectares, see pink areas). Recent deforestation (2012-14) appears to be associated with agricultural and logging activities.
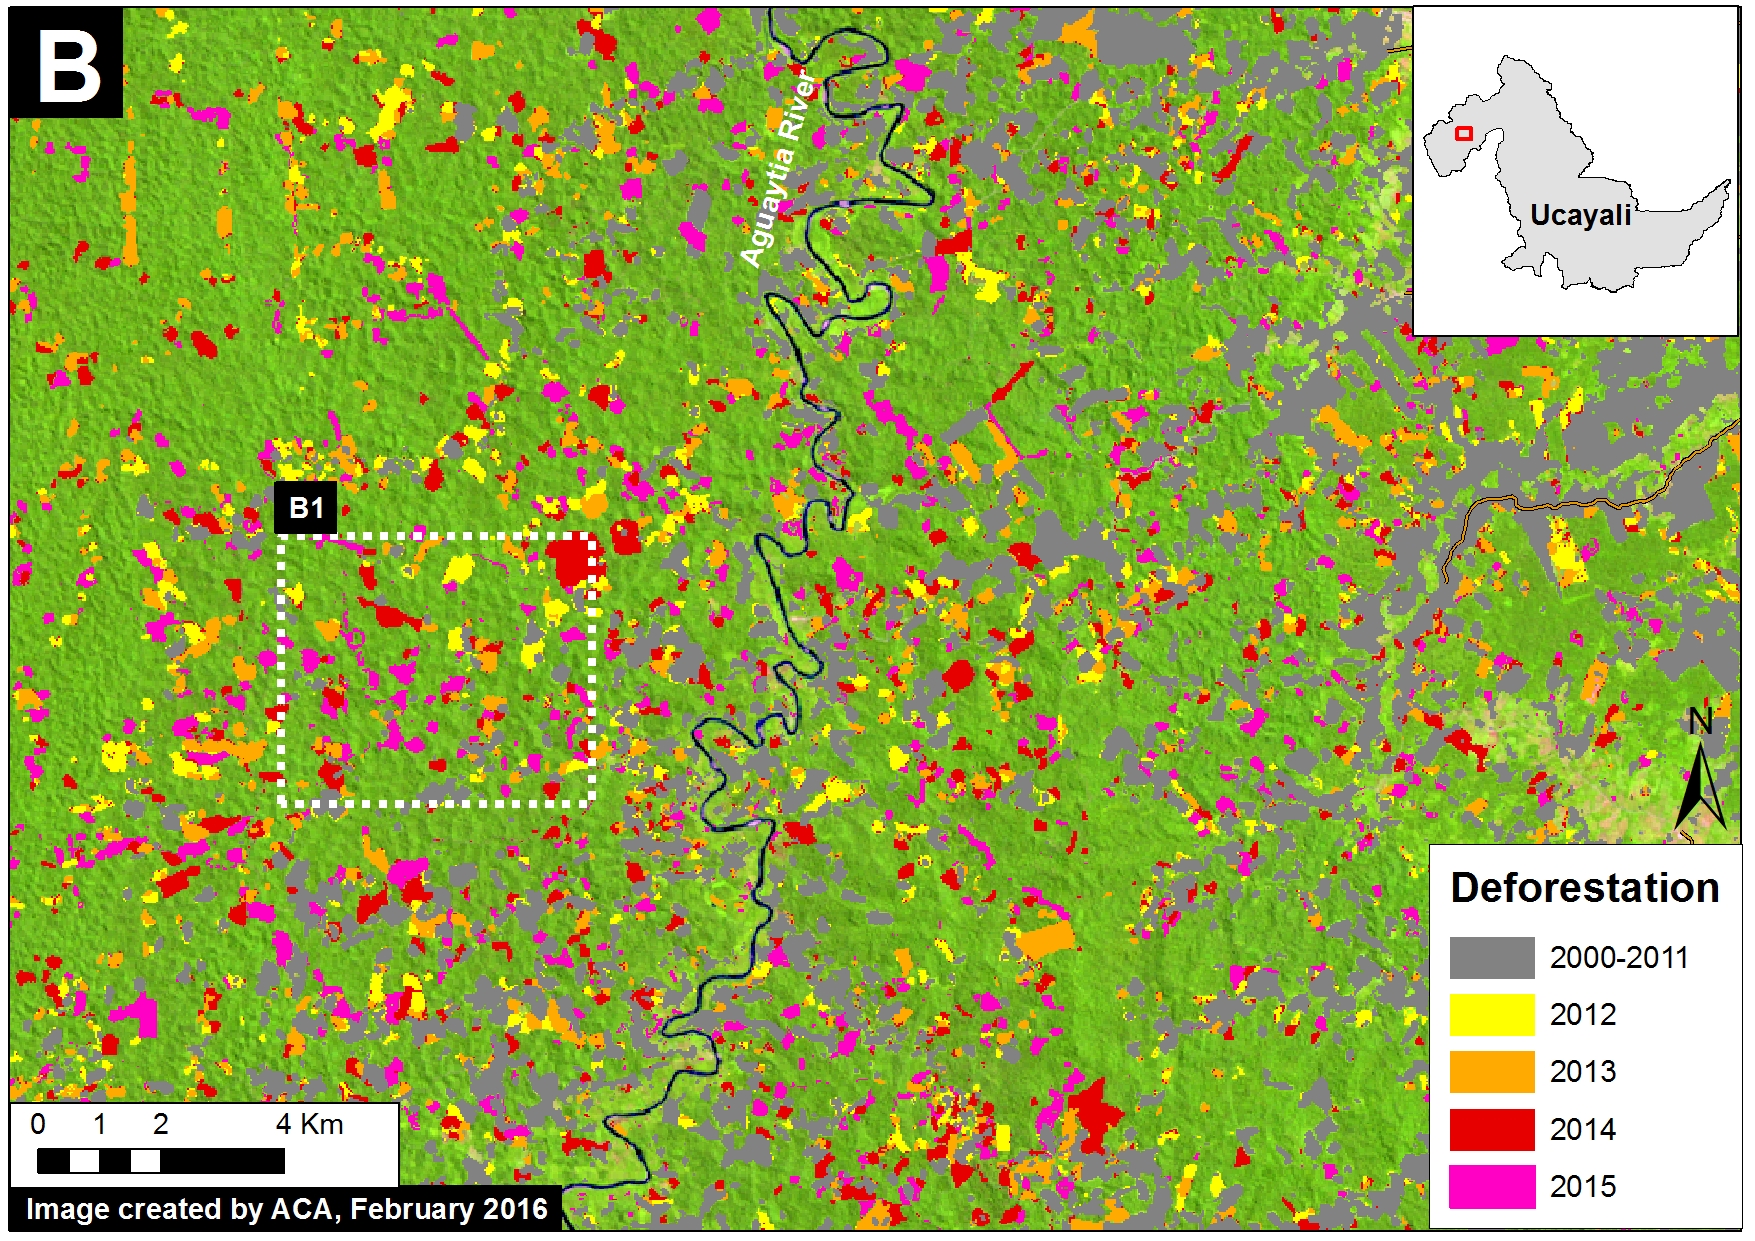
Image 26d. 2000-15 deforestation for area in Inset B from Image Xa. Data: Hansen et al 2016 (ERL), PNCB/MINAM, Hansen/UMD/Google/USGS/NASA, USGS (Landsat 8)
Further below, Image 26e shows a high-resolution satellite image of the area in Inset B1 before (left panel) and after (right panel) the recent deforestation events.
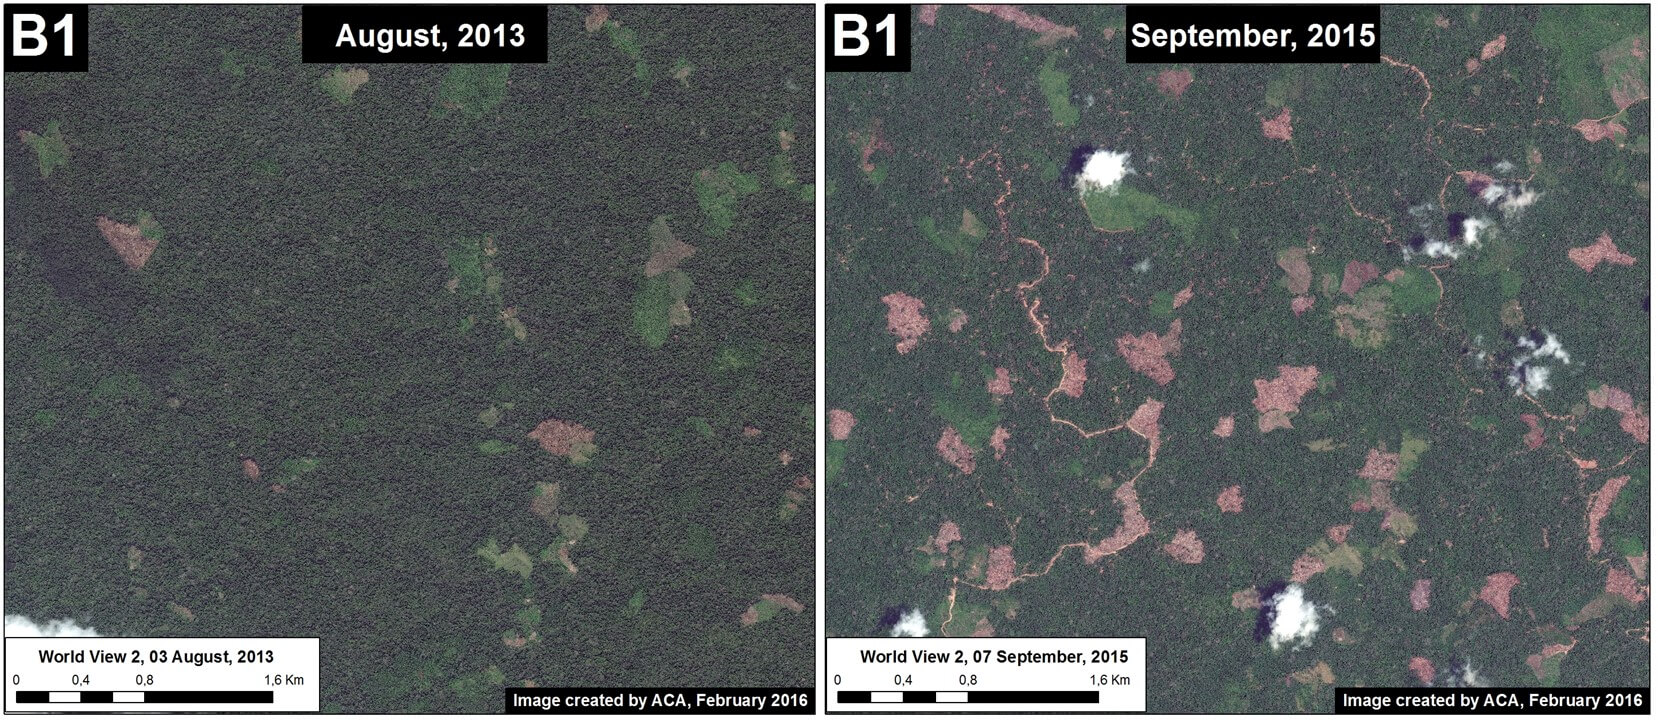
Image 26e. High-resolution view of area in Inset B1 before (left panel) and after (right panel) recent deforestation events. Data: WorldView-2 de Digital Globe (NextView).
Methodology
We conducted this analysis using the Kernel Density tool from Spatial Analyst Tool Box of ArcGis 10.1 software. Our goal was to emphasize local concentrations of deforestation in the raw data while still representing overarching patterns of deforestation between 2012 and 2014. We accomplished this using the following parameters:
Search Radius: 15000 layer units (meters)
Kernel Density Function: Quartic kernel function
Cell Size in the map: 200 x 200 meters (4 hectares)
Everything else was left to the default setting.
Reference
1 Hansen, M.C., A. Krylov, A. Tyukavina, P.V. Potapov, S. Turubanova, B. Zutta, S. Ifo, B. Margono, F. Stolle, and R. Moore. Humid tropical forest disturbance alerts using Landsat data. Environmental Research Letters, in press. Accessed through Global Forest Watch on March 2, 2016. www.globalforestwatch.org
Citation
Finer M, Novoa S, Snelgrove C (2015) 2015 Deforestation Hotspots in the Peruvian Amazon. MAAP: 26.
Deforestation Hotspots in The Peruvian Amazon, 2015
Thanks to the newly launched GLAD alerts (developed by the University of Maryland and Google1, and presented by Global Forest Watch), we now have weekly access to high-resolution forest loss data across Peru. Here in MAAP #26, we analyze the first batch of this data to better understand deforestation patterns in the Peruvian Amazon in 2015. In the coming weeks and months, we will use this map as a base for investigating major hotspots of forest loss in the country.
MAAP #25: Deforestation Hotspots in the Peruvian Amazon, 2012-2014
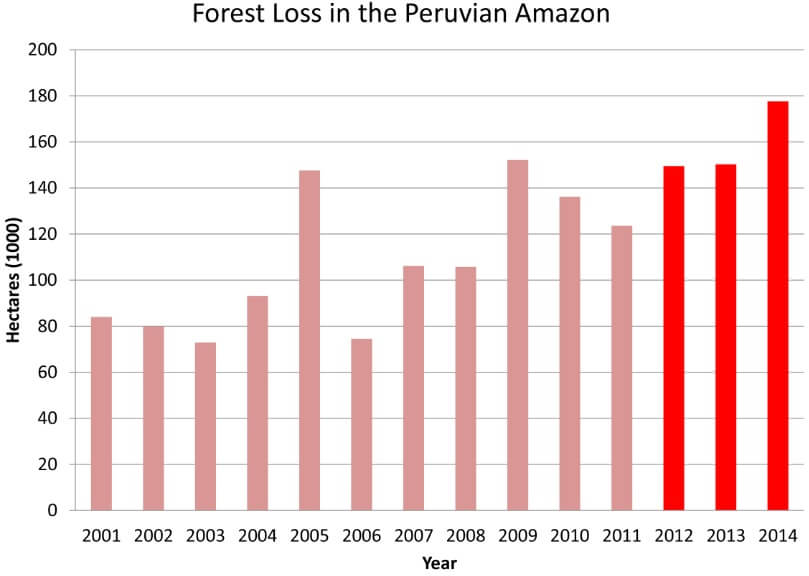
Deforestation continues to increase in the Peruvian Amazon. According to the latest information from the Peruvian Environment Ministry1, 2014 had the highest annual forest loss on record since 2000 (177,500 hectares, or 438,600 acres per year). 2013 and 2012 had the third and fourth highest annual forest loss totals, respectively (behind only 2009).
Source: PNCB/MINAM
To better understand where this deforestation is concentrated, we conducted kernel density estimation. This type of analysis calculates the magnitude per unit area of a particular phenomenon (in this case, forest loss).
Image 25a shows the kernel density map for forest loss in the Peruvian Amazon between 2012 and 2014 and reveals that recent deforestation is concentrated in a number of “hotspots” in the departments of Loreto, San Martin, Ucyali, Huanuco, and Madre de Dios.
Insets A-D highlight four areas with high densities of forest loss described in previous MAAP articles. We are currently studying the other high density deforestation areas not included in the insets.
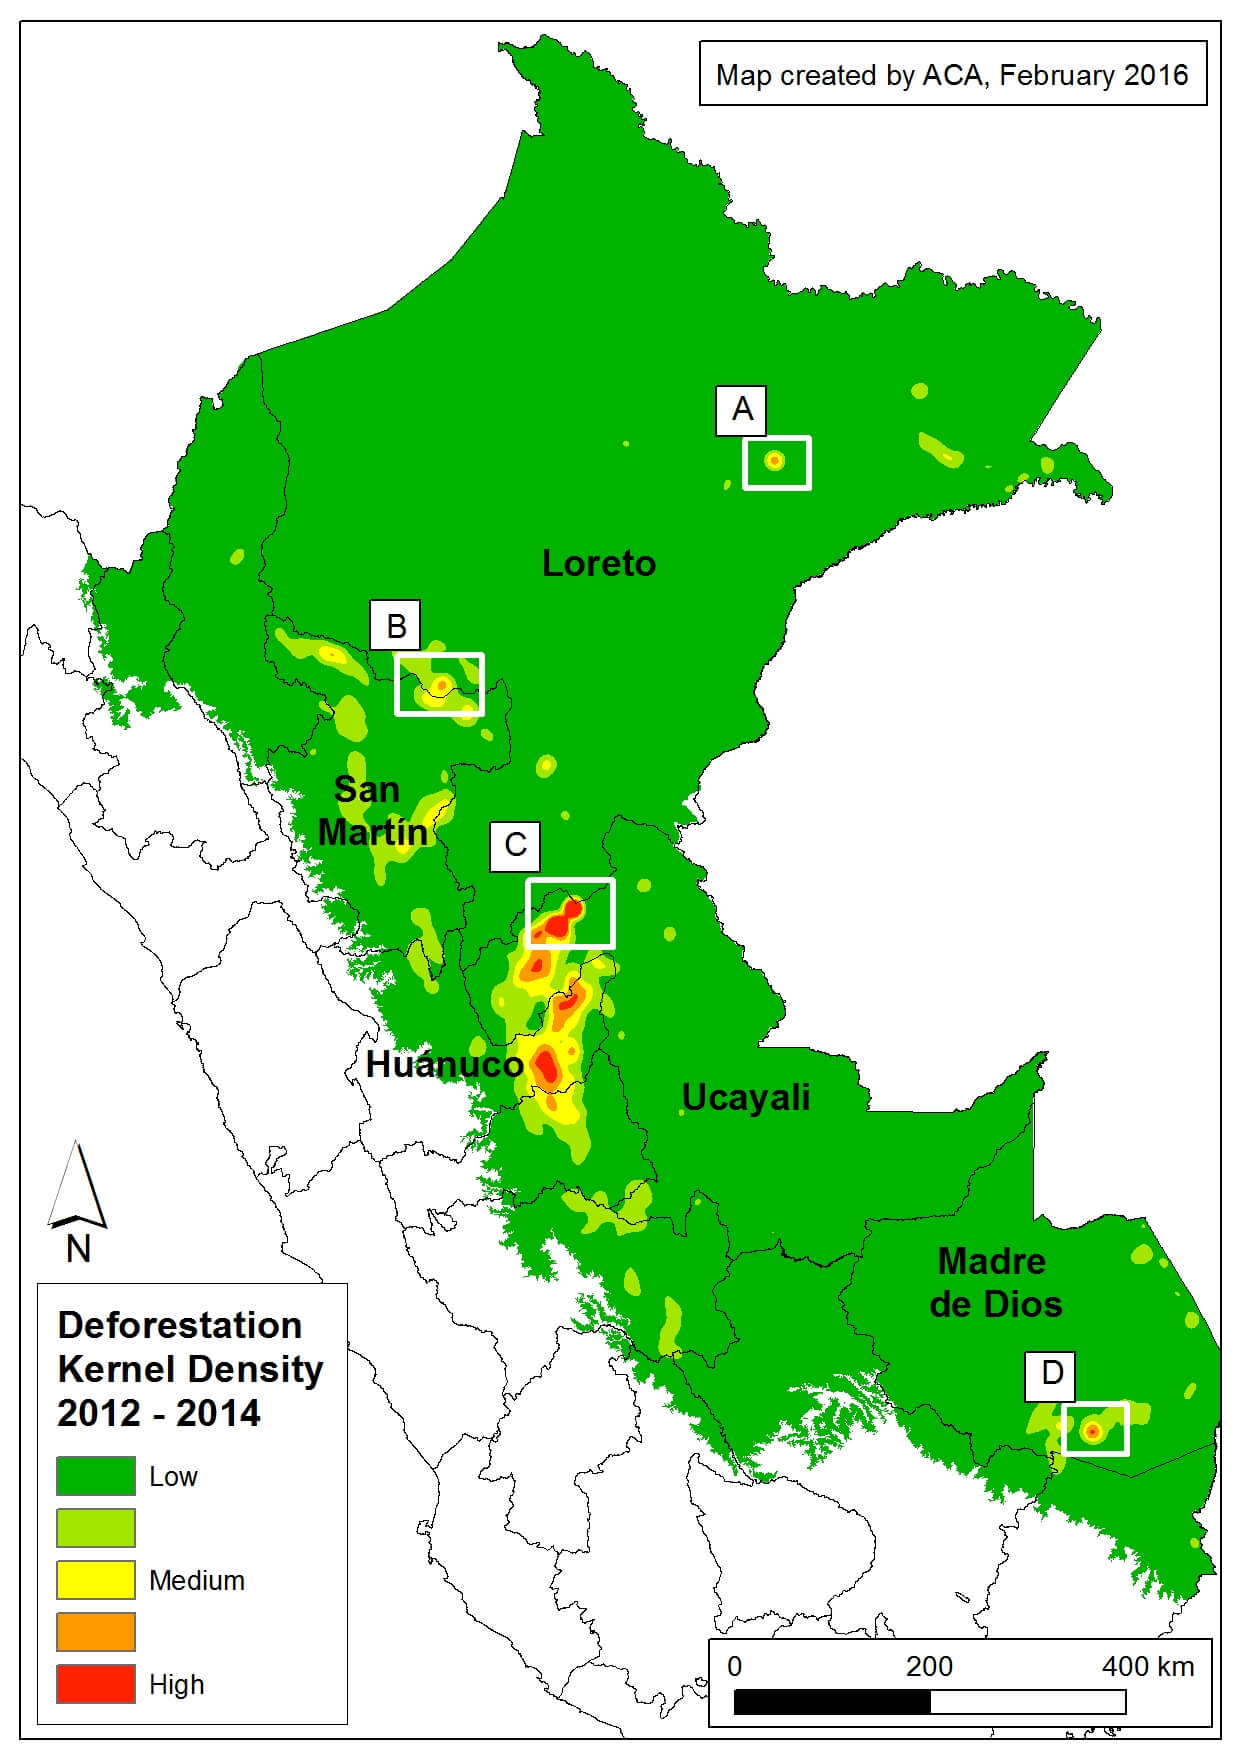
Image 25a. Kernel density map for forest loss in the Peruvian Amazon between 2012 and 2014. Data: PNCB/MINAM, Hansen/UMD/Google/USGS/NASA.
Inset A: Cacao in Loreto
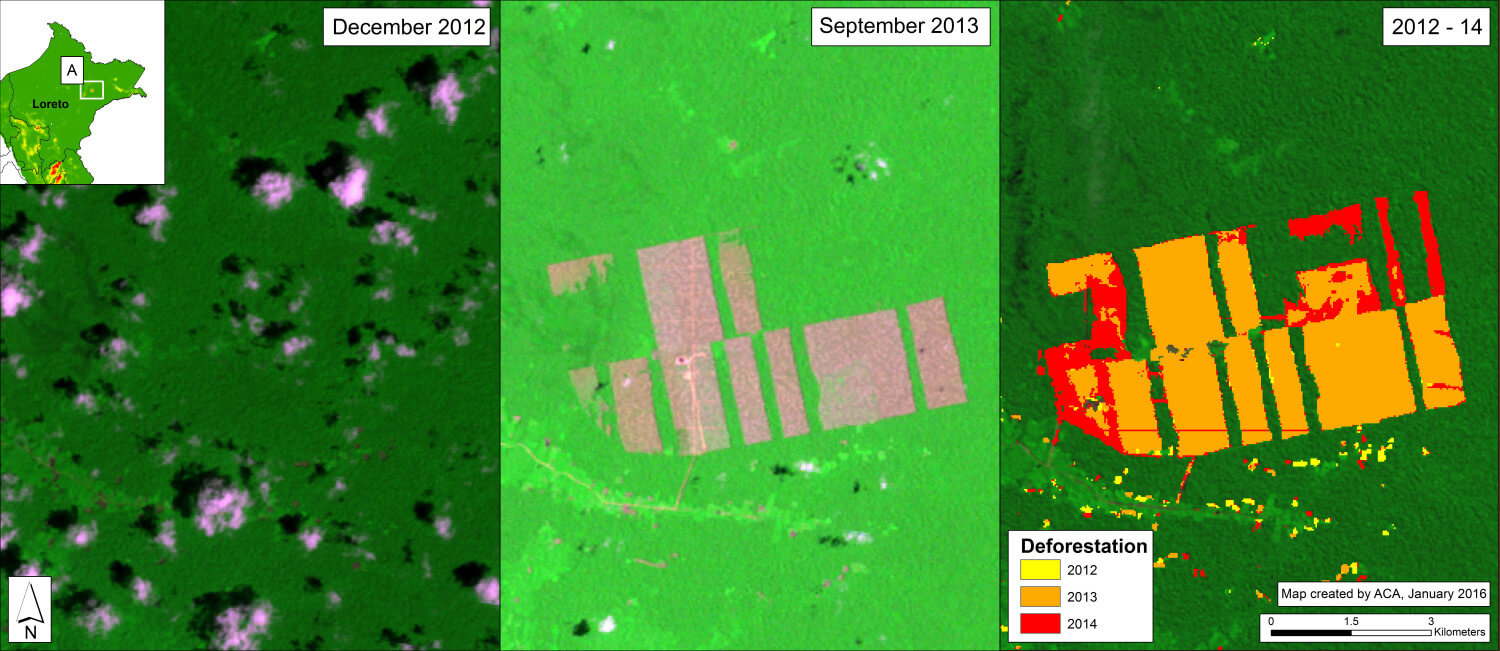
Image 25b. Deforestation for cacao in northern Peru between December 2012 (left panel) and September 2013 (center panel) and cumulative 2012-14 (right panel). Data: USGS, PNCB/MINAM, Hansen/UMD/Google/USGS/NASA
Inset A (from Image 25a) indicates the deforestation of over 2,000 hectares (4,940 acres) on property owned by the company United Cacao (through its wholly owned Peruvian subsidiary, Cacao del Peru Norte) near the town of Tamshiyacu in the department of Loreto. MAAP #9 demonstrated that much of this deforestation took place at the expense of primary forest. Image 25b highlights this area, showing the forest loss between December 2012 (left panel) and September 2013 (center panel; the pinkish areas indicate recently cleared forests). The right panel shows the cumulative deforestation between 2012 and 2014. See MAAP #9 and MAAP #2 for more details.
Inset B: Oil Palm in Loreto/San Martin
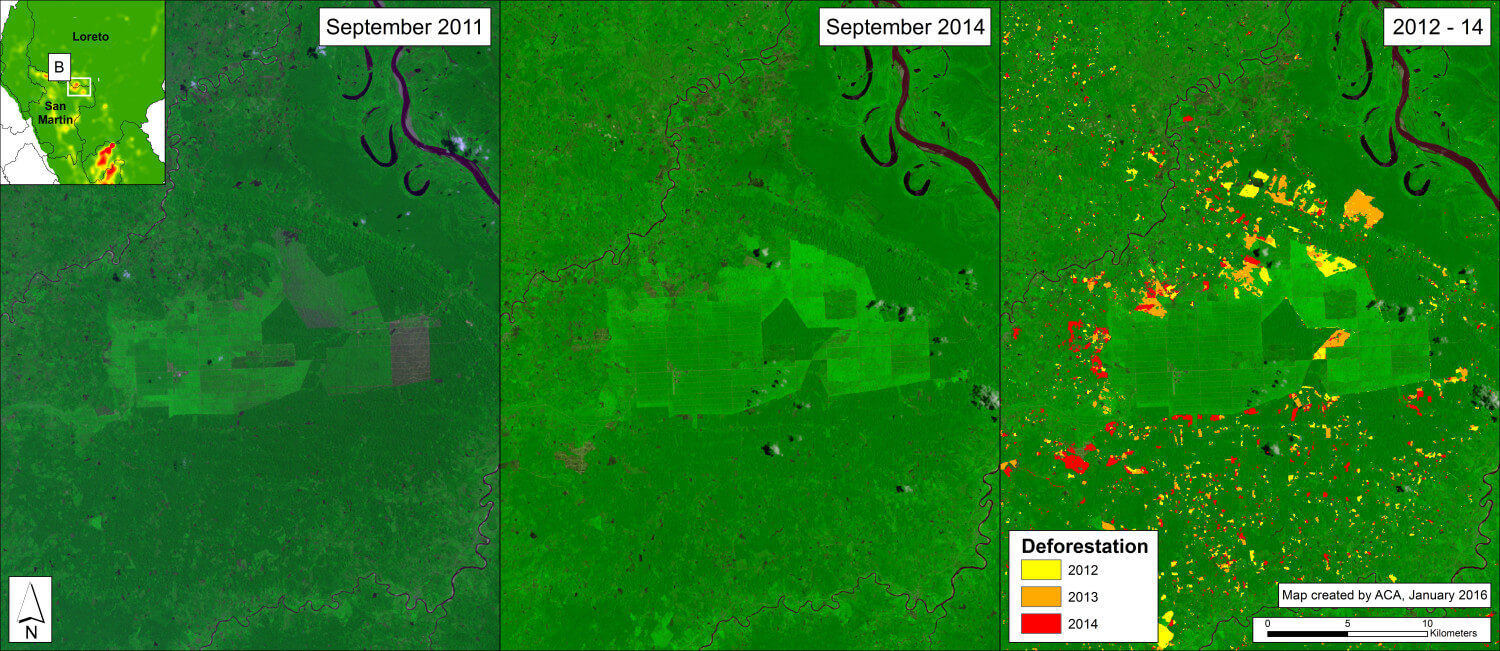
Image 25c. Deforestation for oil palm in northern Peru between September 2011 (left panel) and September 2014 (center panel) and cumulative 2012-14 (right panel). Data: USGS, PNCB/MINAM, Hansen/UMD/Google/USGS/NASA
Inset B (from Image 25a) indicates expanding deforestation within and around two large-scale oil palm plantations along the Loreto-San Martin border. Image 25c highlights this area, showing the forest loss between Setpember 2011 (left panel) and September 2014 (center panel). The right panel shows the cumulative deforestation between 2012 and 2014 (6,363 hectares, or 15,700 acres). See MAAP #16 for more details.
Inset C: Oil Palm in Ucayali
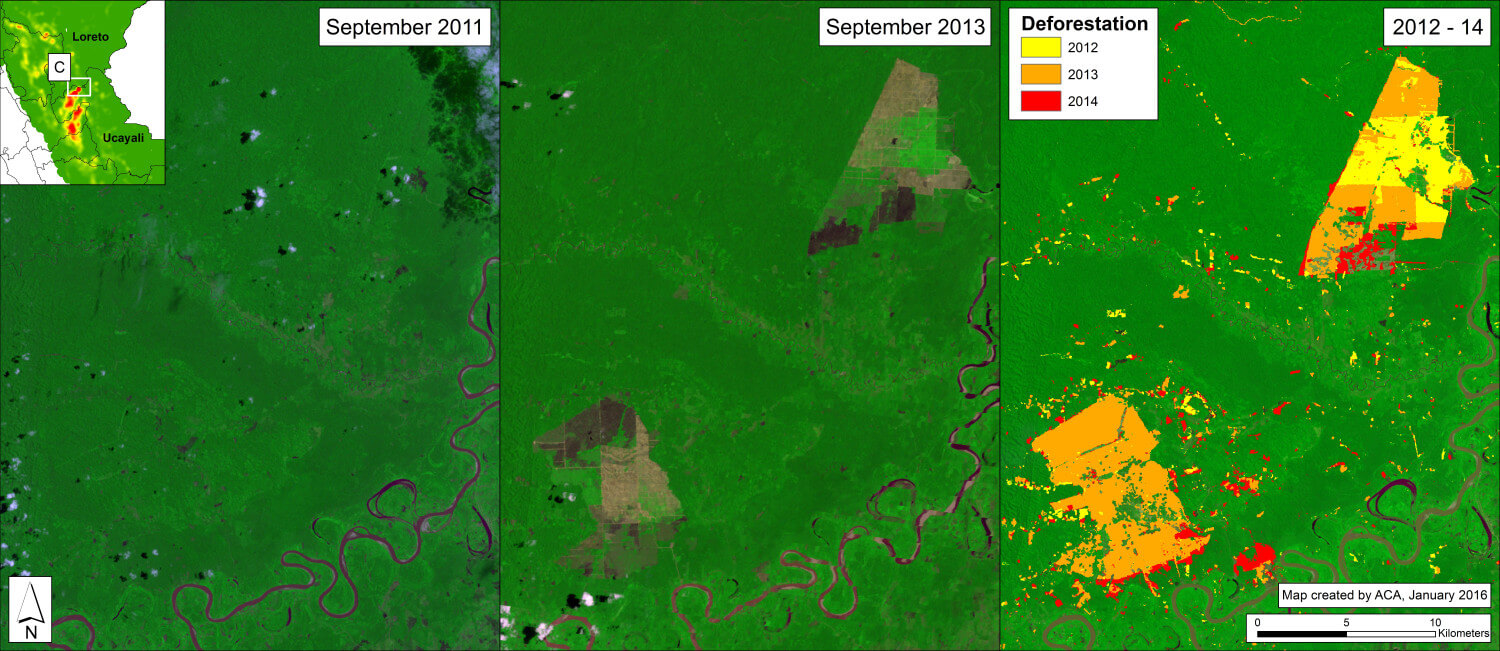
Image 25d. Deforestation for oil palm in central Peru between September 2011 (left panel) and September 2013 (center panel) and cumulative 2012-14 (right panel). Data: USGS, PNCB/MINAM, Hansen/UMD/Google/USGS/NASA
Inset C (from Image 25a) indicates the deforestation of 9,400 hectares (23,200 acres) of primary forest for two large-scale oil palm plantations in the department of Ucayali. Image 25d highlights this area, showing the forest loss between September 2011 (left panel) and September 2013 (center panel; the pinkish-black areas indicate recently cleared forests). The right panel shows the cumulative deforestation between 2012 and 2014. See MAAP #4 for more details.
Inset D: Gold Mining in Madre de Dios
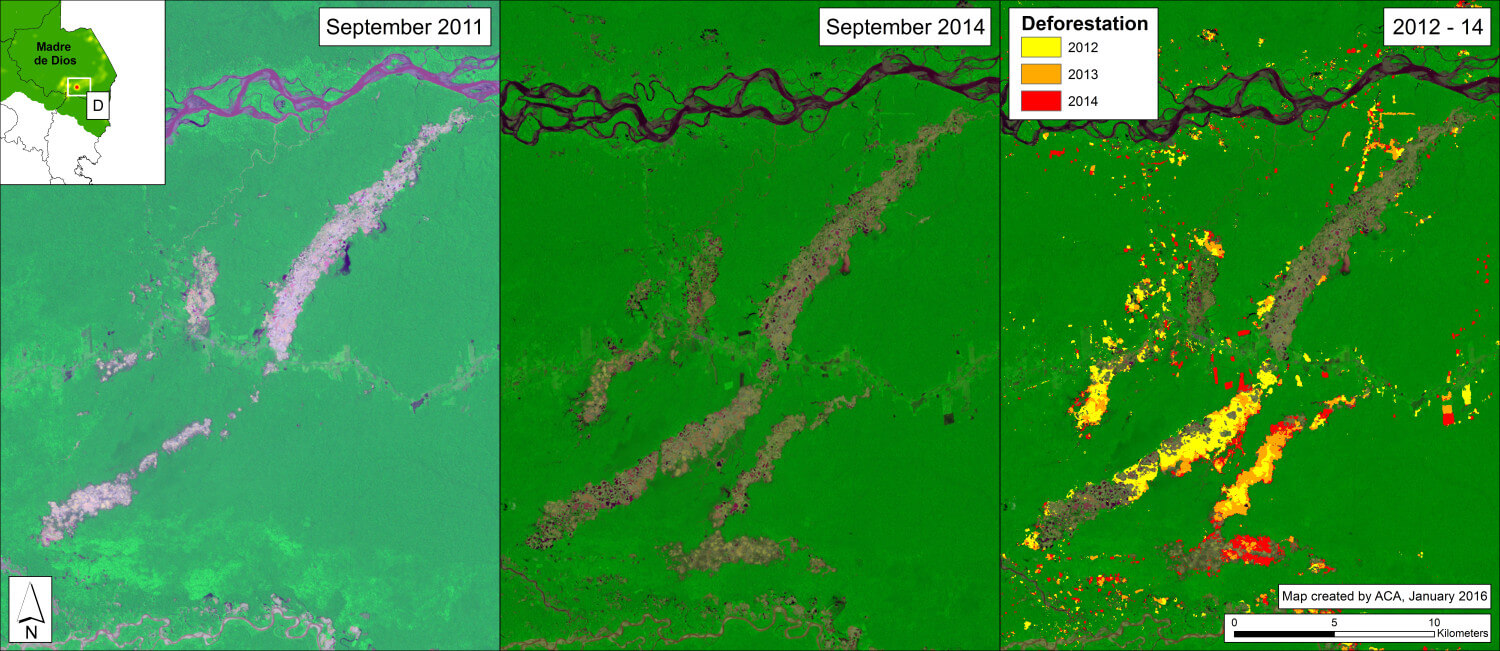
Image 25e. Deforestation for gold mining in southern Peru between September 2011 (left panel) and September 2014 (center panel) and cumulative 2012-14 (right panel). Data: USGS, PNCB/MINAM, Hansen/UMD/Google/USGS/NASA
Inset D (from Image 25a) indicates the extensive illegal gold mining deforestation in the buffer zone of Tambopata National Reserve in the department of Madre de Dios. Image 25e highlights this area, showing the forest loss between September 2011 (left panel) and September 2014 (center panel; the lighter areas indicate recently cleared forests). The right panel shows the cumulative deforestation between 2012 and 2014 (4,738 hectares, or 11,700 acres). See MAAP #1 for more details.
It is important to emphasize that in this case, extensive deforestation continued in 2015. See MAAP #12 and MAAP #24 for more details.
Methodology
We conducted this analysis using the Kernel Density tool from Spatial Analyst Tool Box of ArcGis 10.1 software. Our goal was to emphasize local concentrations of deforestation in the raw data while still representing overarching patterns of deforestation between 2012 and 2014. We accomplished this using the following parameters:
Search Radius: 15000 layer units (meters)
Kernel Density Function: Quadratic
Cell Size in the map: 200 x 200 meters (4 hectares)
Everything else was left to the default setting.
References
1MINAGRI-SERFOR/MINAM-PNCB (2015) Compartiendo una visión para la prevención, control y sanción de la deforestación y tala ilegal.
Citation
Finer M, Snelgrove C, Novoa S (2015) Deforestation Hotspots in the Peruvian Amazon, 2012-2014. MAAP: 25.
Deforestation Hotspots in The Peruvian Amazon, 2012-2014
Deforestation continues to increase in the Peruvian Amazon. According to the latest information from the Peruvian Environment Ministry1, 2014 had the highest annual forest loss on record since 2000 (177,500 hectares, or 438,600 acres per year). 2013 and 2012 had the third and fourth highest annual forest loss totals, respectively (behind only 2009).
 Loading...