As a reader of our newsletter, we assume you care about the Amazon region, the conservation work we do there, and/or have already visited our lodges. If so, we could really use your help!
Uncategorized
MAAP #59: Power Of “Small Satellites” From Planet
The company Planet is pioneering the use of high-resolution “small satellites” (Image 59a). They are a fraction of the size and cost of traditional satellites, making it possible to produce and launch many as a large fleet. Indeed, Planet now operates 149 small satellites, known as Doves, the largest fleet in history. The Doves capture color imagery at 3-5 meter resolution, and will line up (like a string of pearls) to cover everywhere on Earth’s land area every day.
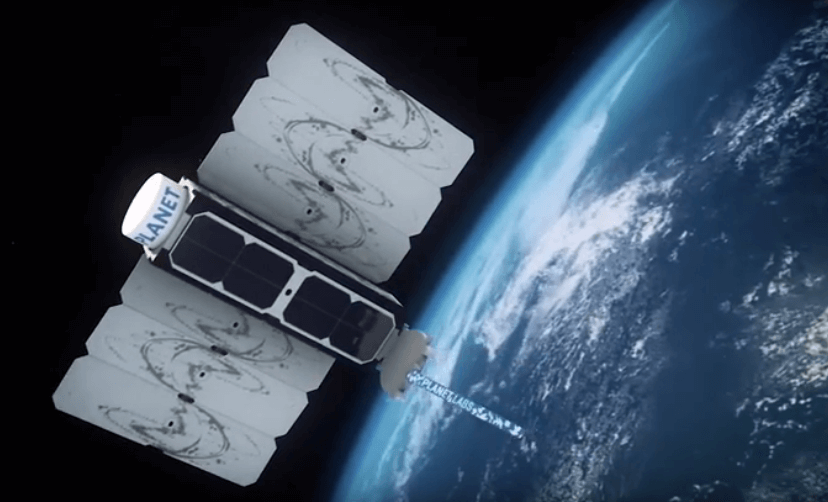
Image 59a. Source: Planet
Over the past year, MAAP* has demonstrated the power of Planet imagery to monitor deforestation and degradation in near real-time in the Amazon. A consistent flow of new, high-resolution imagery is needed for this type of work, making Planet’s fleet model ideal. Below, we provide a recap of key MAAP findings based on Planet imagery, for a diverse set of cases including gold mining, agriculture deforestation, logging roads, wildfire, blowdowns, landslides, and floods.**
*MAAP has been fortunate to have access to Planet imagery via the Ambassador program.
**Note: In the images below, the red dot (•) indicates the same location across time between panels.
Station Profile: Wayqecha Cloud Forest Birding Lodge
Just 3.5 hours northeast of Cusco—via a spectacular drive through the snow-capped Andes—Wayqecha Cloud Forest Biological Station and Birding Lodge is one of the world’s best sites to explore the lush cloud forest ecosystem bordering Manu National Park. Situated where the eastern slopes of the Andes meet the Amazon lowlands, the cloud forest absorbs moisture from passing clouds and is often blanketed in mist and fog. The constant supply of moisture allows […]
MAAP #58: Link Between Peru’s Flooding and Warm Coastal Waters
In previous articles MAAP #56 and MAAP #57, we presented a series of striking satellite images of the recent deadly floods in northern Peru. Satellites provide additional types of data critical to better understanding events such as extreme flooding. Here, we present two more types of satellite data related to the flooding: ocean water temperature and precipitation.
The Women in Science of ACA share what inspires them to fight for the environment
Using a scientific approach to conservation is at the core of how we achieve our mission of protecting the Amazon. Our biological stations serve as research hubs for scientists from all over the world to study the rainforest, and we count on the leadership of three incredible women to support hundreds of studies every year. Check out some testimonials from these inspirational powerhouses changing the face of conservation in the Peruvian Amazon.
 For me, research and science are means of innovation, creativity, and communication; they are tools to help us discover the unknown with the hope for a better future. As a woman scientist, I would like to see more of us working and leading projects towards a more equitable, just and sustainable world, breaking down all gender-based stereotypes. I truly believe that we have the capability, strength and power to enrich and deepen the knowledge of nature, opening new opportunities for innovation and original solutions to the most difficult challenges on Earth.
– Carla Mere, biologist at ACA’s Los Amigos Research Station.
 Since I was a kid, I had the opportunity to live and be in touch with natural environments, which make my empathy and interest for animals and plants grow. I think I was lucky to receive a good education and motivation at home as well as at school, because I never thought I couldn’t be a scientist. Though it is not an easy path, especially in a developing country, I believe that here where we need science the most. Many times girls don’t even think about becoming scientists, but it is a worthy path that is needed so much right now to protect the only planet we have.
– Cecilia Barriga, biologist at Villa Carmen Research Station
 I have had the privilege of contributing to the creation and management of natural reserves, wildlife rescue operations, environmental education programs, and research on forest and wildlife ecology in the Tropics. Science allows me to fulfill my personal desire to contribute to nature conservation for the enjoyment of future generations. Now one of my main goals is to inspire young scientists and provide them with opportunities to follow their passion, to experience science first hand, and to fall in love with this profession, like I did.
– Sandra Almeyda, biologist at Wayqecha Research Station.
MAAP: Hydrocarbon-Related Deforestation in The Peruvian Amazon
Block 57 – Repsol
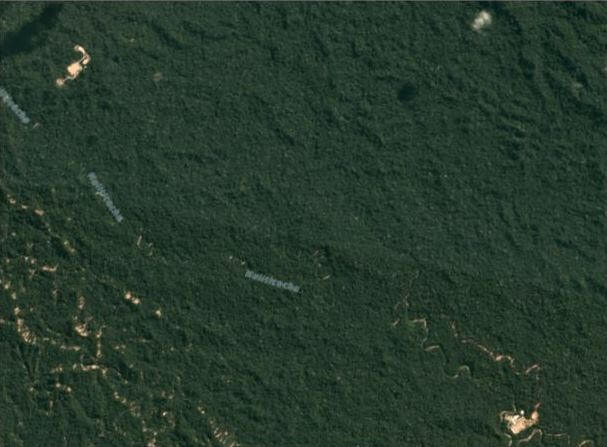
June 2017. Image: Planet
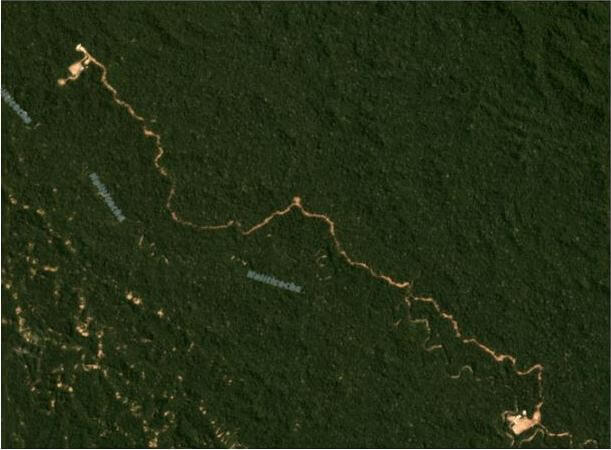
September 2017. Image: Planet
Block 67
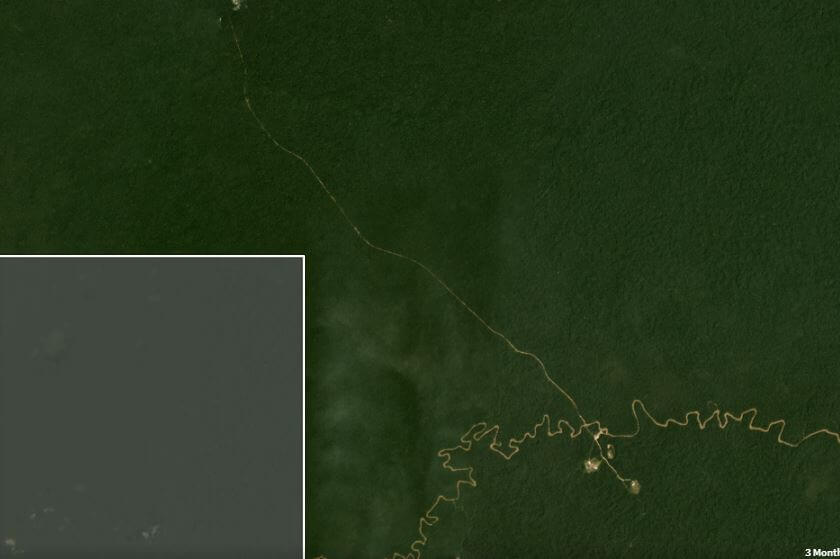
Lote67, February 2018. Image: Planet
MAAP #57: High Resolution Satellite Images of The Flooding In Peru
In the previous MAAP #56, we showed a series of satellite images of the deadly floods that recently hit northern Peru.
In this report, we show a series of new, very high resolution satellite images (50 cm) of the flooding. They show, in striking detail, some of the local impacts, including to croplands and the Pan-American Highway.
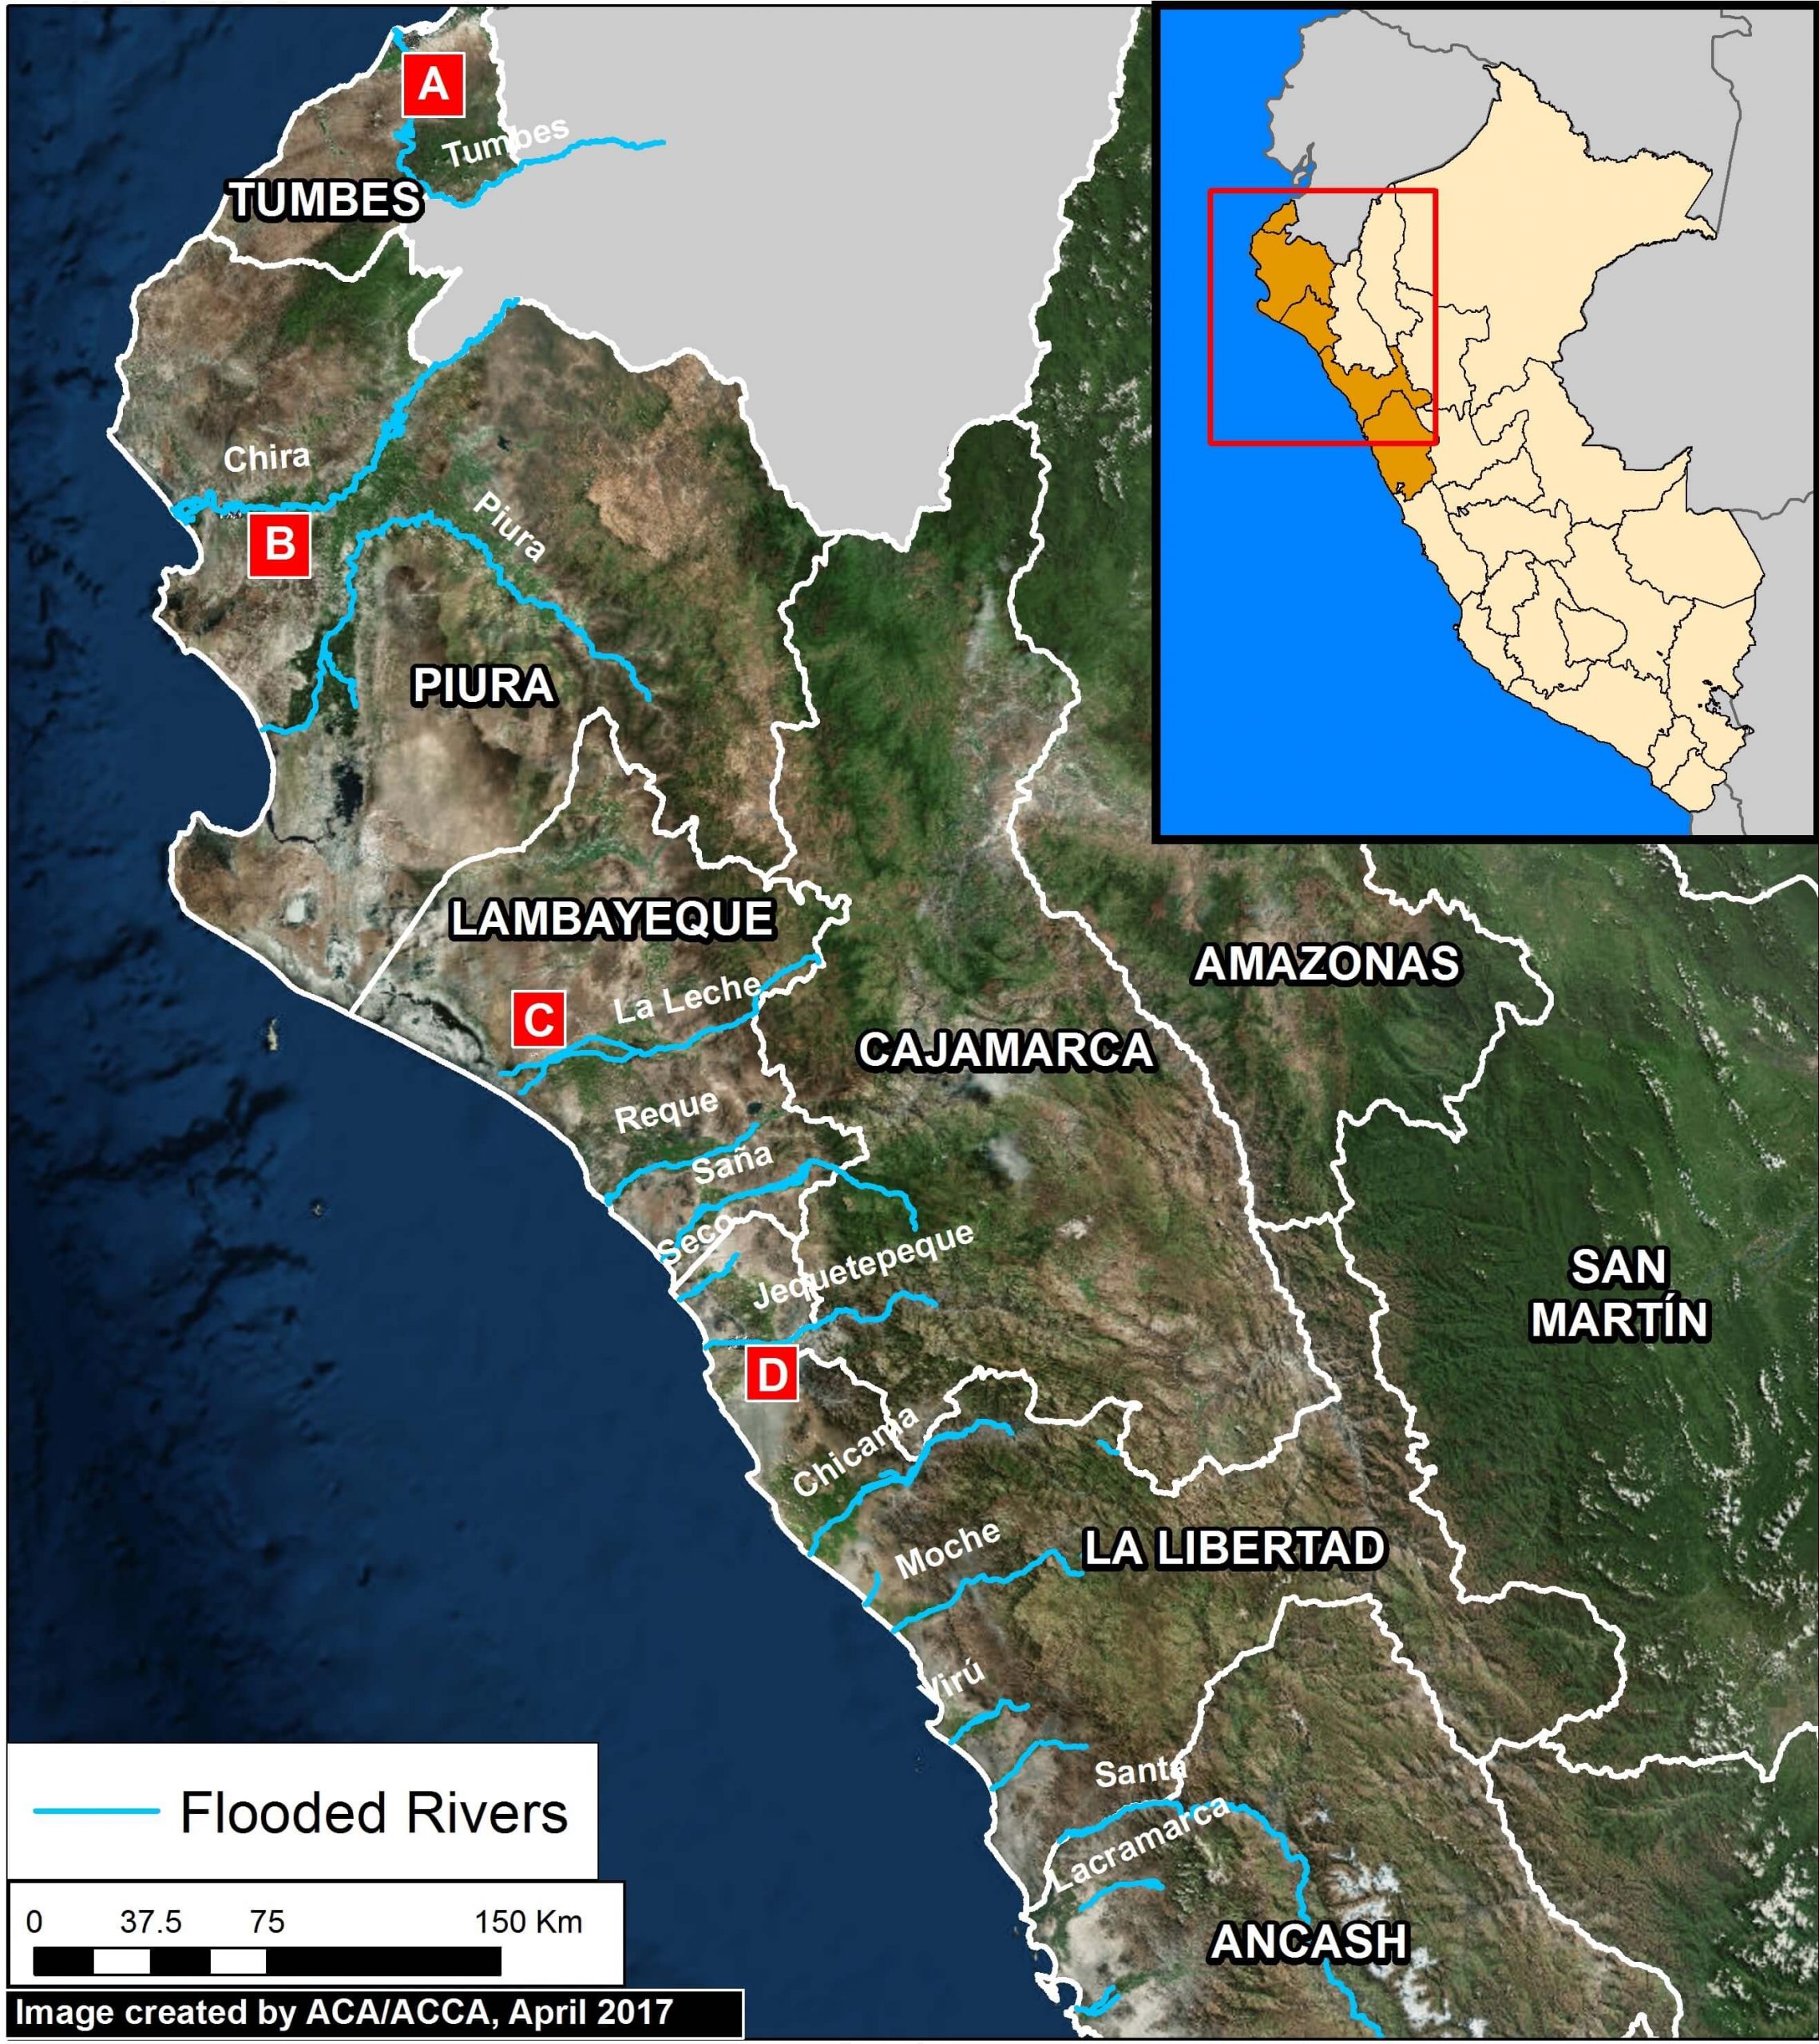
Image 57. Data: ESRI, INEI, MINAM. Click to enlarge.
Image 57 shows the 13 rivers that recently overflowed in northern Peru.
Below, we show images of the flooding around four of the rivers, labelled A-D.
MAAP #56: Major Flooding in Northern Peru From Coastal El Niño
Intense rainfall is causing severe and deadly flooding along the northern coast of Peru.
The cause is likely “coastal El Niño,” a phenomenon produced by abnormal ocean warming along the equatorial coast of the Pacific Ocean.
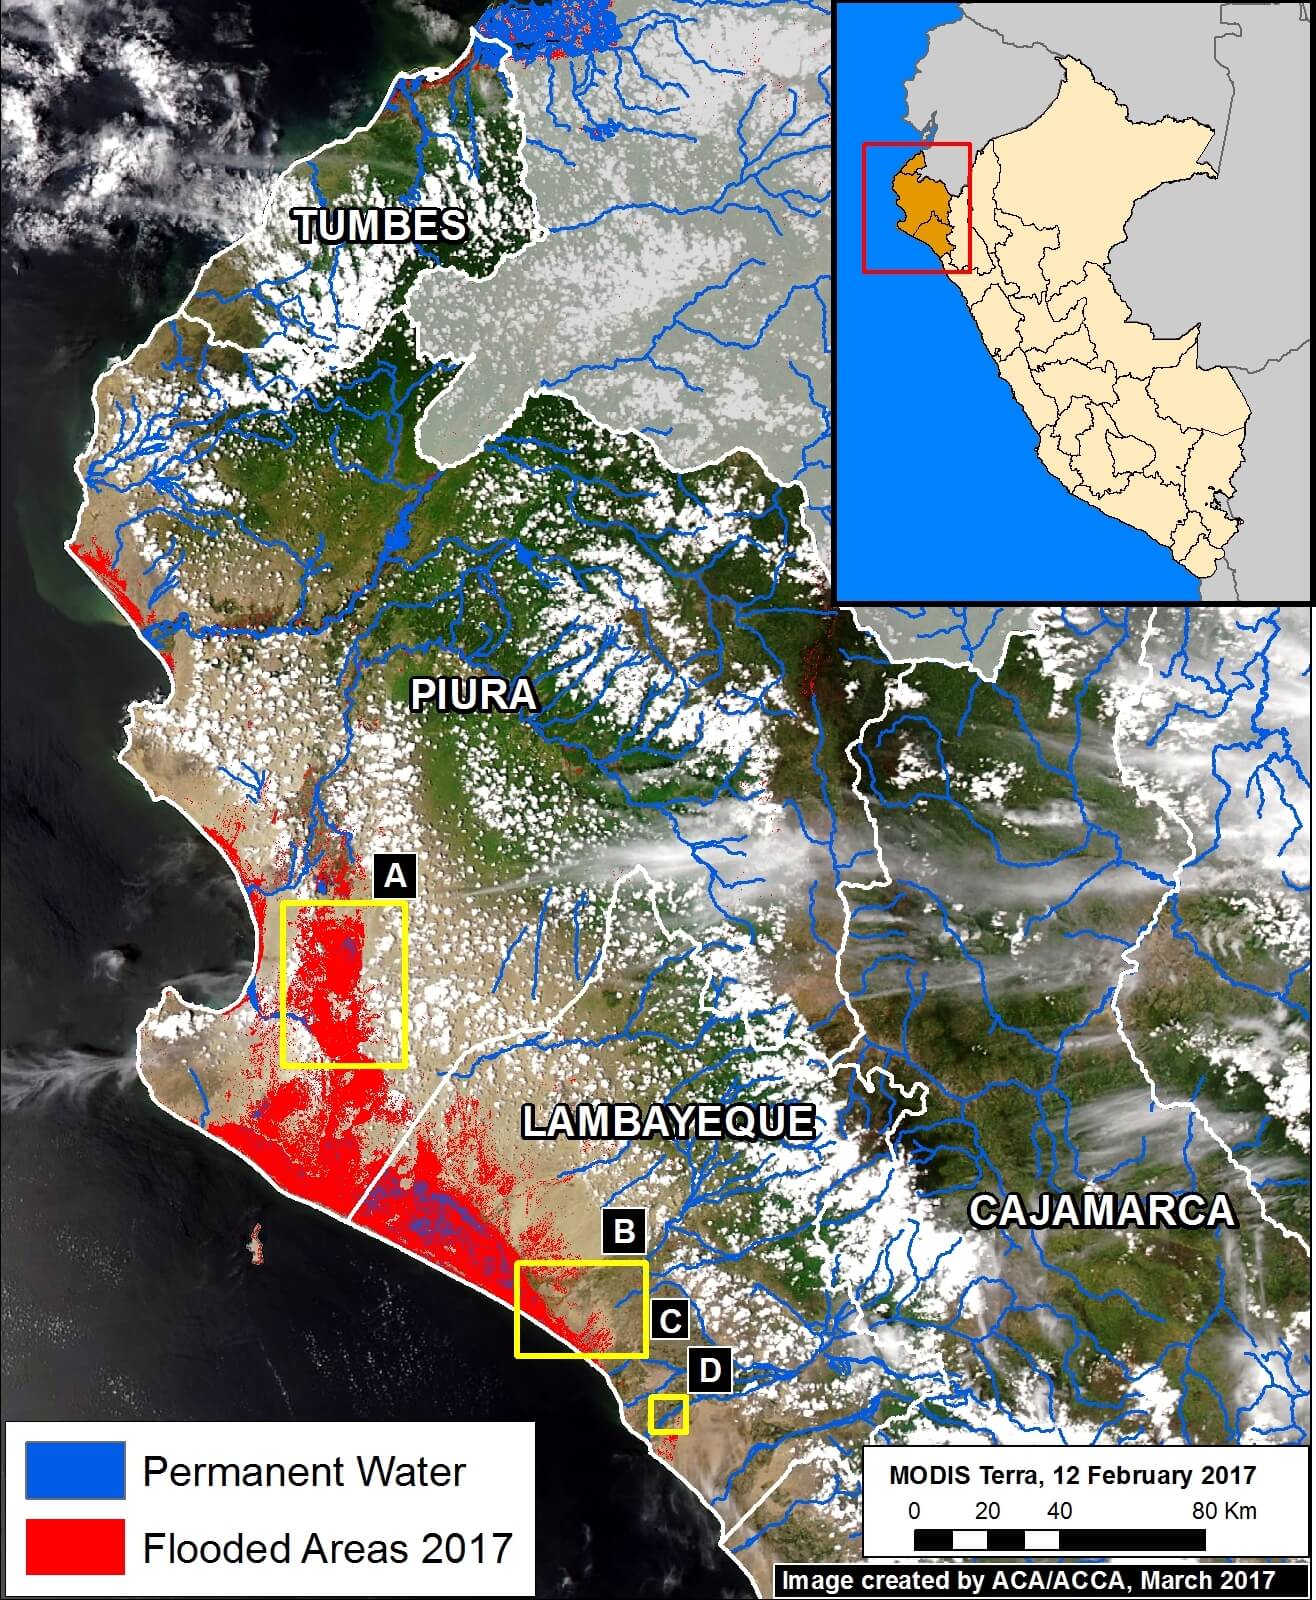
Image 56a. Datos: NASA, ESA, JRC/Google
Image 56a shows a preliminary estimate of the flooded areas along the northern coast (in red). We created this estimation via an analysis of radar images (Sentinel-1) that identified areas saturated with water.
Below, we show satellite images of the areas indicated by Insets A-D, which represent examples of flooding events.
Note that the red points indicate the same spots between panels.
MAAP #55: New 2017 “Hurricane Winds” in Peruvian Amazon
In the previous MAAP #54, we described the phenomenon of natural forest loss due to “hurricane winds,” showing several examples from 2016 in the Peruvian Amazon. Strong winds from these localized storms can knock down hundreds of acres of forest at a time.
In January 2017, GLAD tree loss alerts indicated two new hurricane wind events in the southern Peruvian Amazon (Madre de Dios region). Below, we show high-resolution images of these cases. The first is a large hurricane wind event that knocked down 780 acres (Image 55a). The second is an event of 185 acres that took place within a forestry concession (Image 55b).
Image 55a: Data: Planet
Image 55b: Data: Planet
New conservation area established: Over 11,000 acres of forest protected

An area equivalent to over 8,000 football fields in the heart of the Amazon rainforest is now protected. After years of work supporting the Association of Young Conservationists of Alto Pilcomayo (AJCAP), ACA has helped declare the area of Alto Pilcomayo in the Peruvian Amazon as a protected conservation area.
What makes this new conservation area unique is that it is not owned by a single individual, but rather by the AJPAC association, an organization devoted to conserving the area. Alto Pilcomayo is now a territory where anyone in the AJPAC association can carry out conservation, research, and educational projects in the area as long as the purpose of those projects is to protect the biological diversity in the rainforest.
Alto Pilcomayo is located to the east of the city of Cusco, where the Andes mountains meet the Amazon rainforest. Many endemic species, such as woolly monkeys, Spectacled bears, and many species of amphibians, live in the forest. In addition, a wide variety of orchids bloom here. This area is also a crucial water source to 5,000 people living in the nearby valley of Kosñipata.
 Loading...