The Amazon Birder’s Bulletin is a bi-monthly newsletter about nature and birding at Amazon Conservation’s three birding lodges in Peru. Each of our birding lodges are open to the public, and they host thousands of birders, researchers, and students alike every year. Staying in our lodges is an opportunity to spot hundreds of species of amazing birds, and to get up close and personal with the crucial work we do to protect the world’s most diverse landscapes, train the next generation of Amazonian conservationists, and partner with communities to support livelihoods that sustain biodiversity.
Author: dcadmin
MAAP #49: New Frontiers of Gold Mining in The Peruvian Amazon
In a series of articles, we have previously detailed the progress of gold mining deforestation in the southern Peruvian Amazon (mainly in the Madre de Dios region).
In the current report, we show the new gold mining frontiers in northern and central Peru (Image 49a): two cases in the region of Amazonas and a case in the buffer zone of El Sira Communal Reserve, in the Huanuco region.
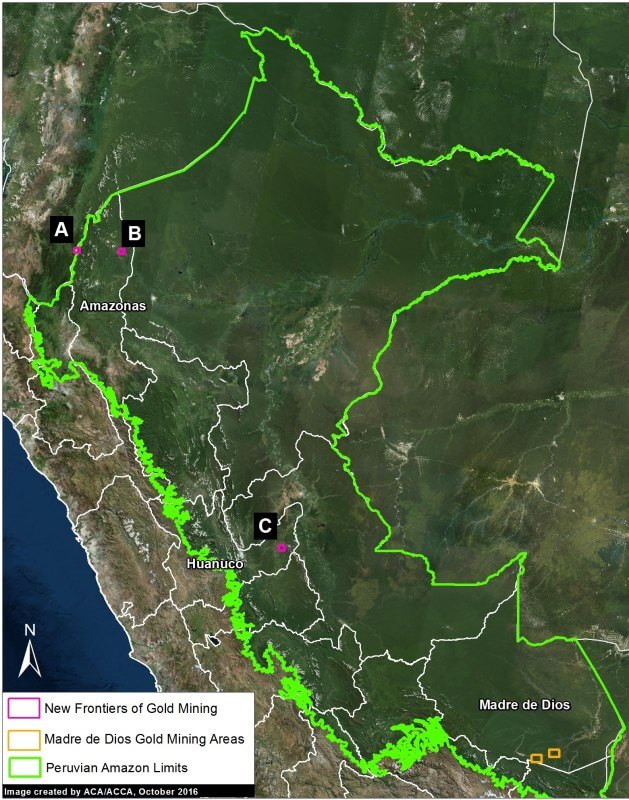
Imagen 49a. Peru’s gold mining frontiers.
Deforestation in these cases is still in its early stages, so there is still time to avoid larger-scale damage, as in the case of Madre de Dios.
Bolivia: Large-Scale Sugarcane Deforestation
New sugarcane plantations have caused the deforestation of more than 6,175 acres (2,500 hectares) in the department of La Paz.
https://news.mongabay.com/2016/10/exclusive-rainforest-rapidly-cleared-for-sugarcane-in-bolivia/
MAAP #48: Oil Palm Deforestation in The Central Peruvian Amazon
In MAAP #26, we presented a 2015 Deforestation Hotspots map for the Peruvian Amazon, which showed that the highest concentration of deforestation is located in the central Amazon region.
Here, we zoom in on one of these hotspots, located in the northern Huanuco region along its border with San Martin (see Inset E of Image 48a).*
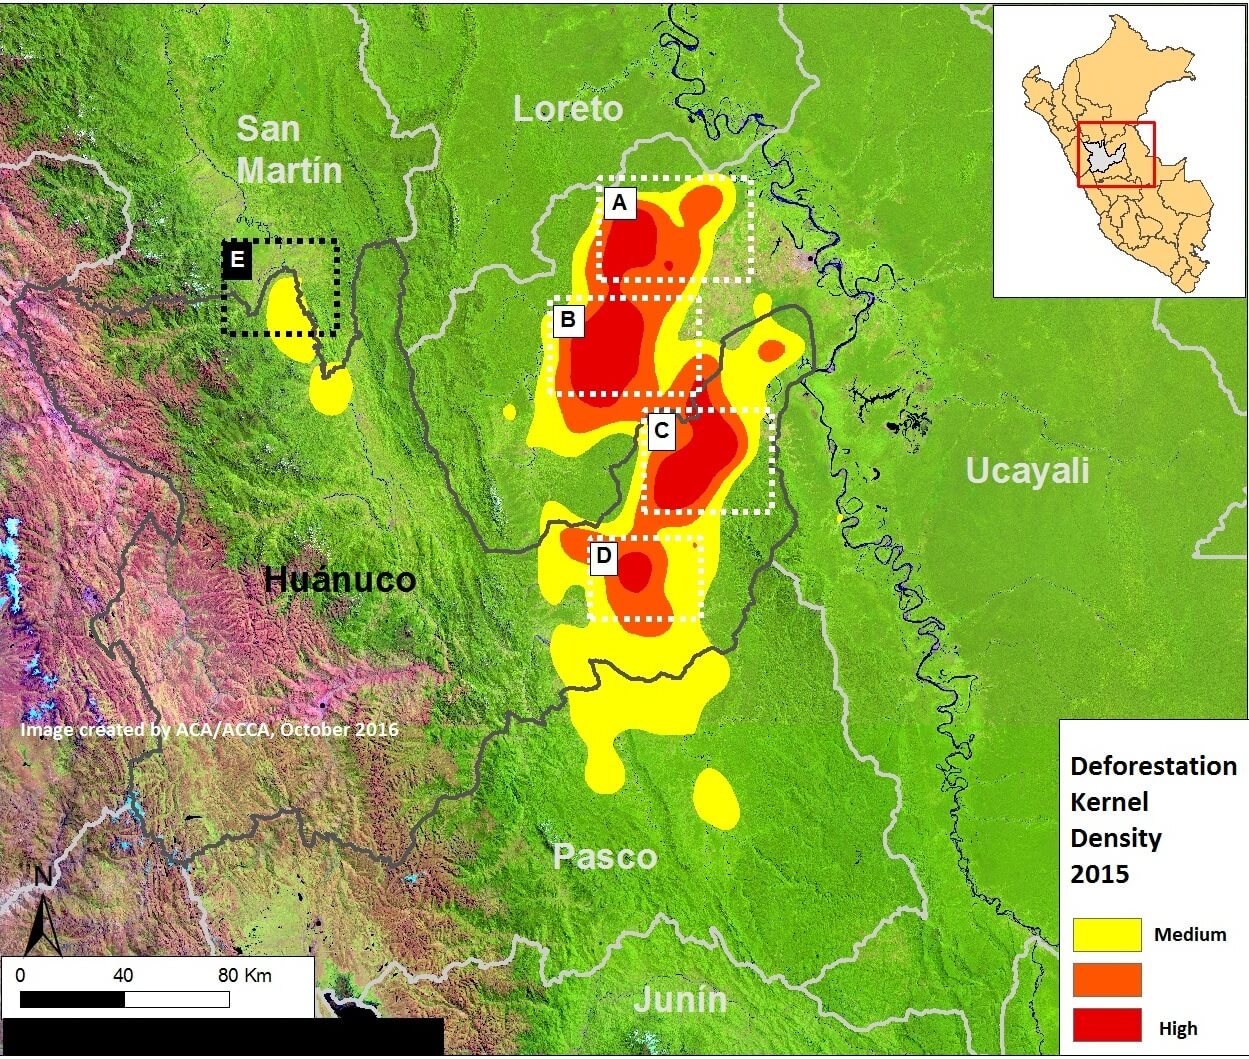
Image 48a. Data: UMD/GLAD
We found that the main deforestation driver in this hotspot was the establishment of small- and medium-scale oil palm plantations.**
*Note that we analyzed the hotspots in Insets A-D in MAAP #26 and MAAP #37.
** We defined small-scale as less than 5 hectares, medium-scale as 5-50 hectares, and large-scale as greater than 50 hectares
MAAP #47: Fires Degrade Southern Peruvian Amazon (Madre De Dios)
The Peruvian Amazon is experiencing an intense 2016 fire season due to one of its driest periods in decades. In recent weeks, we have presented a series of articles showing the power of the new GLAD alerts in detecting deforestation in near real time. Here, we go a step further and also evaluate alerts to detect fires in near real time. These fire alerts are based on the moderate resolution (375 meters) VIIRS sensor that detects heat sources and highlights areas where the temperature is significantly above normal.
We compared, for the first time, these two types of alerts and found a correlation between fires and forest loss along a stretch of the Interoceanic Highway in the southern Peruvian Amazon (Madre de Dios region).
Image 47a shows the occurrence of fire alerts (left panel) in relation to deforestation alerts (right panel) during 2016 along the highway between the towns of Iberia and Iñapari. Insets A-E indicate the areas highlighted in the high-resolution zooms below, where approximately 600 hectares were affected by fires in 2016..
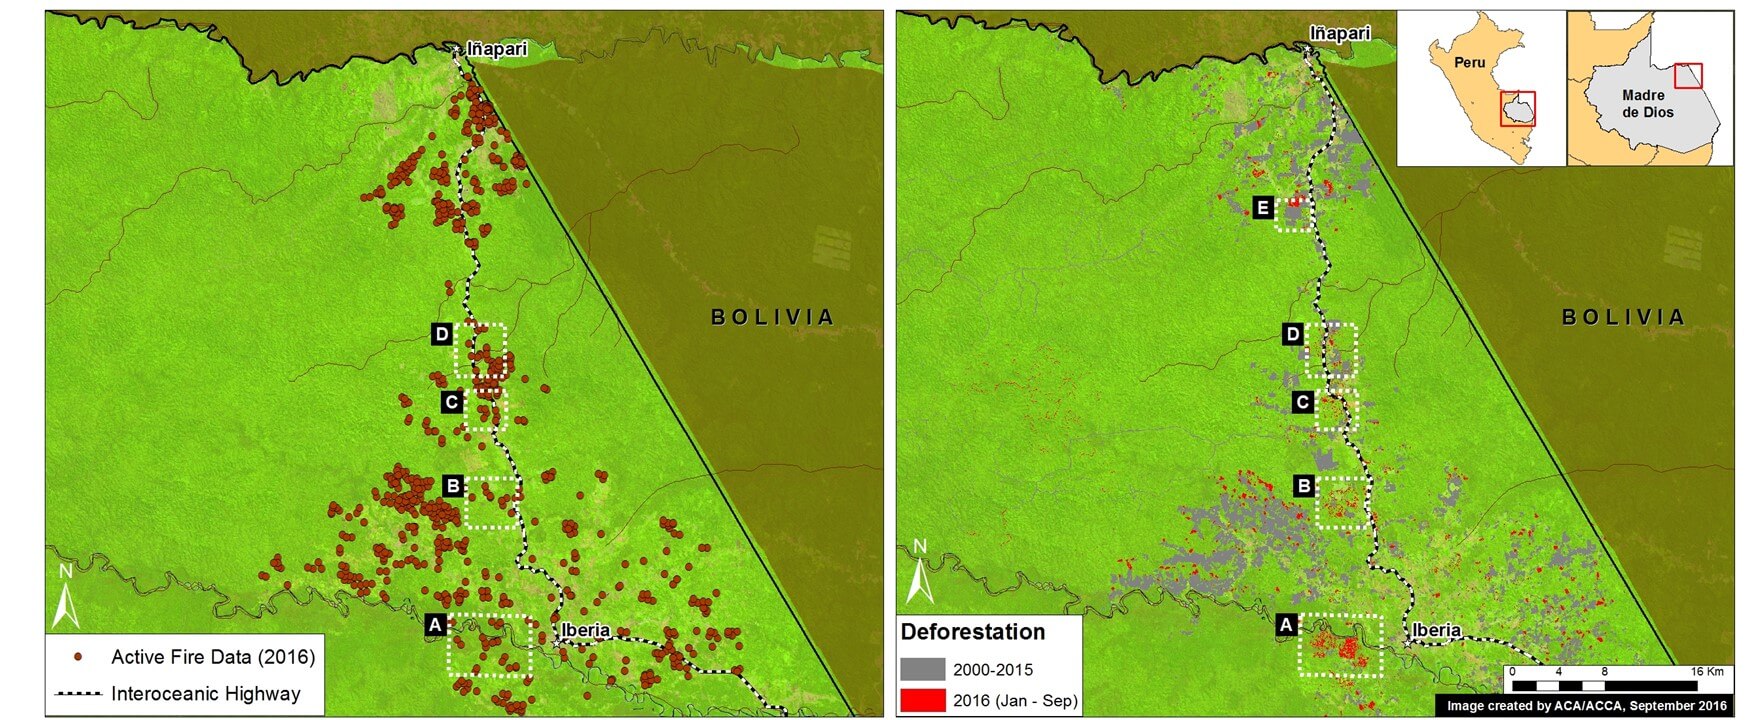
Image 47a. Data: UMD/GLAD, Hansen/UMD/Google/USGS/NASA, USGS/NASA, NASA/INPE
MAAP #46: Gold Mining Deforestation Within Tambopata National Reserve Exceeds 1100 Acres
In previous articles, we documented the illegal gold mining invasion of Tambopata National Reserve (Madre de Dios region in the southern Peruvian Amazon) in November 2015 and the subsequent deforestation of 350 hectares as of July 2016. Here, we report that the mining deforestation in the Reserve now exceeds 450 hectares (1,110 acres) as of September 2016. Image 46a illustrates the extent of the invasion, with red indicating the most recent deforestation fronts. Insets A-D indicate the location of the high-resolution zooms below.
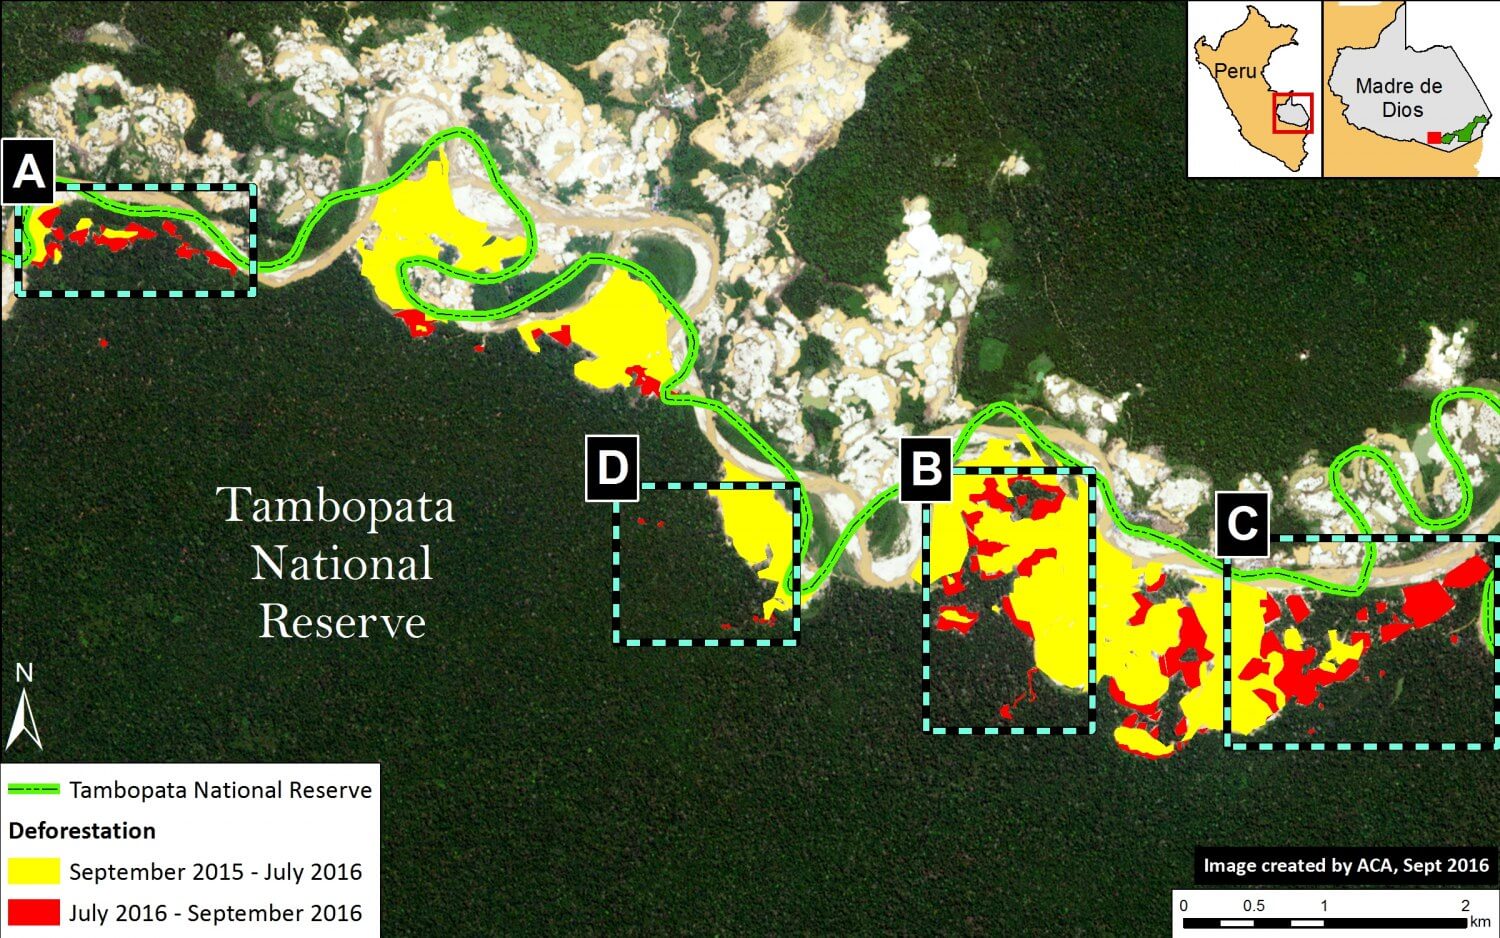
Image 46a. Data: Planet, SERNANP, MAAP
MAAP #45: Threats To El Sira Communal Reserve in Central Peruvian Amazon
El Sira Communal Reserve, located in the central Peruvian Amazon (regions of Pasco, Huánuco and Ucayali), aims to protect the biological diversity of the El Sira Mountain Range in benefit of the native communities of the area (Ashaninka, Yanesha, and Shipibo-Conibo indigenous groups).
This report presents an initial threat assessment for this large national protected area, which covers more than 615,000 hectares (1.5 million acres).
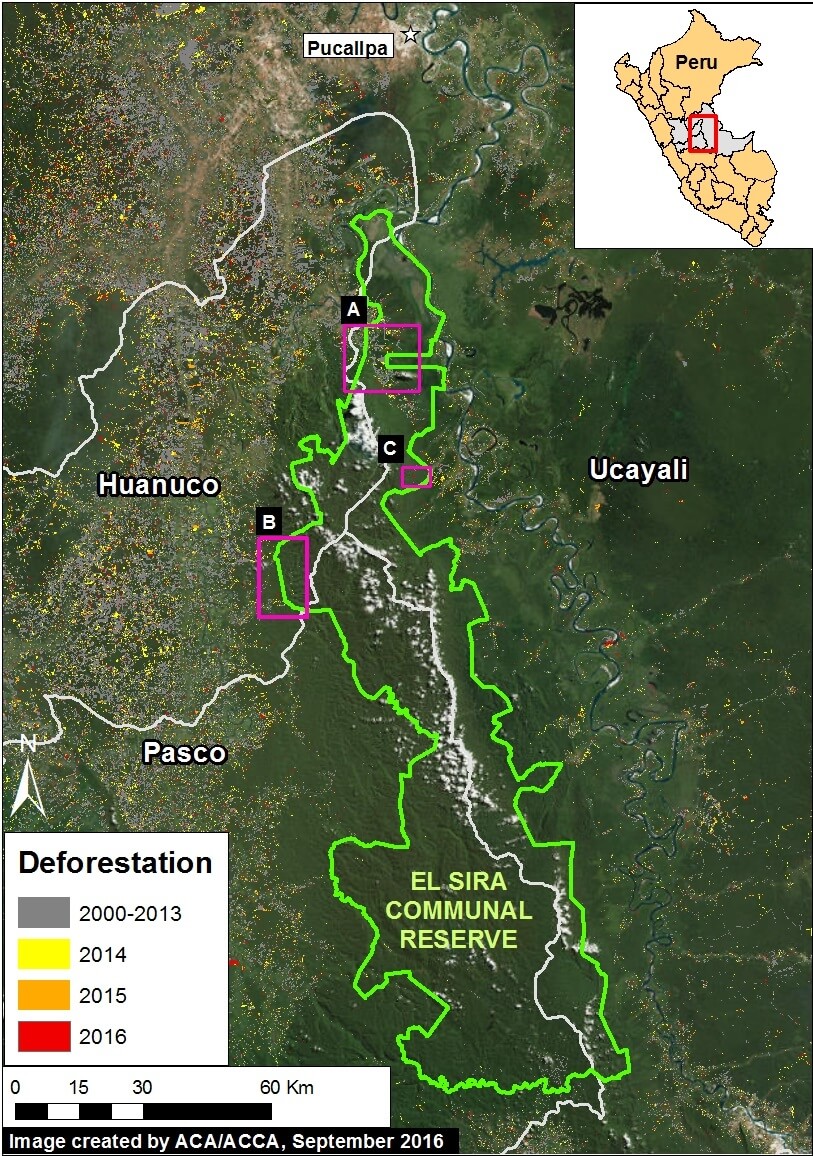
Image 45a. Data: ESRI, SERNANP
We identified 3 threatened sectors of the Reserve, as indicated in Image 45a (see Insets A-C).
We found that the principal drivers of deforestation in these three sectors are agriculture & cattle pasture (Insets A and C) and illegal gold mining (Inset B).
It is important to note that the deforestation for agriculture & cattle pasture continues to rapidly increase – 1,600 hectares (3,950 acres) since 2013 – while the deforestation for gold mining has been limited due to regular interventions by the Peruvian government.
Below, we show high-resolution satellite images of the recent deforestation in all three threatened sectors. Click each image to enlarge.
MAAP# 44: Potential Recuperation of Illegal Gold Mining Area in Amarakaeri Communal Reserve
In the previous MAAP #6, published in June 2015, we documented the deforestation of 11 hectares in the Amarakaeri Communal Reserve due to a recent illegal gold mining invasion. The Reserve, located in the Madre de Dios region of the southern Peruvian Amazon, is an important protected area that is co-managed by indigenous communities and Peru’s National Protected Areas Service (known as SERNANP). In the following weeks, the Peruvian government, led by SERNANP, cracked down on the illegal mining activities and effectively halted the deforestation within that part of the Reserve.
Here, we present high-resolution satellite images that show an initial vegetation regrowth in the invaded area. This finding may represent good news regarding the Amazon’s resilience to recover from destructive mining if it is stopped at an early stage. However, many questions and caveats remain regarding the nature of the regrowth and the long-term recovery potential of the degraded land, please see the Additional Information section below for more details.
Image 44a shows the base map of the area invaded by illegal gold mining in the southeast sector of Amarakaeri Communal Reserve. Insets A–D indicate the areas featured in the high-resolution zooms below.
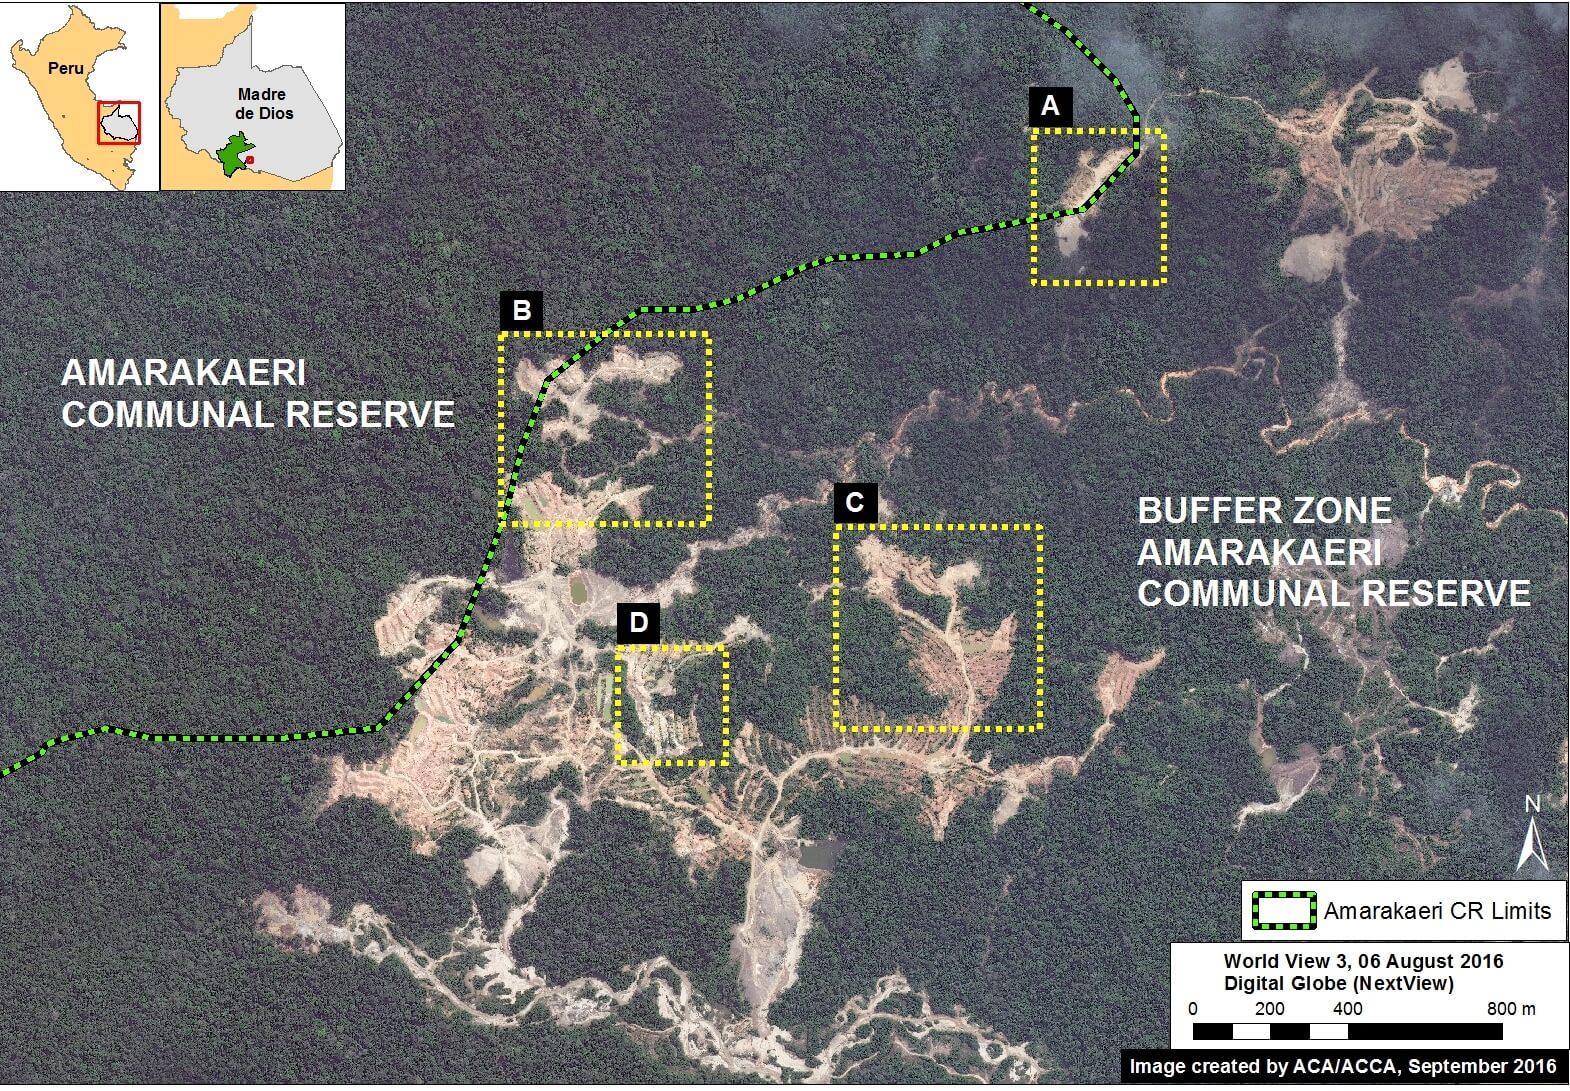
Image 44a. Data: Digital Globe (Nextview), SERNANP
MAAP #43: Early Warning Deforestation Alerts in The Peruvian Amazon, Part 2
In the previous MAAP #40, we emphasized the power of combining early warning forest loss GLAD alerts with analysis of high-resolution satellite imagery as part of a comprehensive near real-time deforestation monitoring system for the Peruvian Amazon.
In the current MAAP, we present 3 new examples of this system across different regions of Peru. Click on the images below to enlarge.
Example 1: Illegal Gold Mining in buffer zone of Bahuaja Sonene National Park (Madre de Dios)
Example 2: Logging Road in buffer zone of Cordillera Azul National Park (Ucayali/Loreto)
Example 3: Deforestation in Permanent Production Forest (Ucayali)
Example 1: Illegal Gold Mining in buffer zone of Bahuaja Sonene National Park (Madre de Dios)
In the previous MAAP #5, we discussed illegal gold mining deforestation along the upper Malinowski River, located in the buffer zone of the Bahuaja Sonene National Park. As seen in Image 43a, the upper Malinowski is just upstream of the areas invaded by illegal gold mining in Tambopata National Reserve and its buffer zone (see MAAP #39 and #31, respectively). In MAAP #5, we documented the deforestation of more than 850 hectares between 2013 and 2015 along the upper Malinowski. Here, we show that gold mining deforestation continues in 2016, with an additional loss of 238 hectares (806 acres). Insets A-C correspond to the areas featured in the high-resolution zooms below.
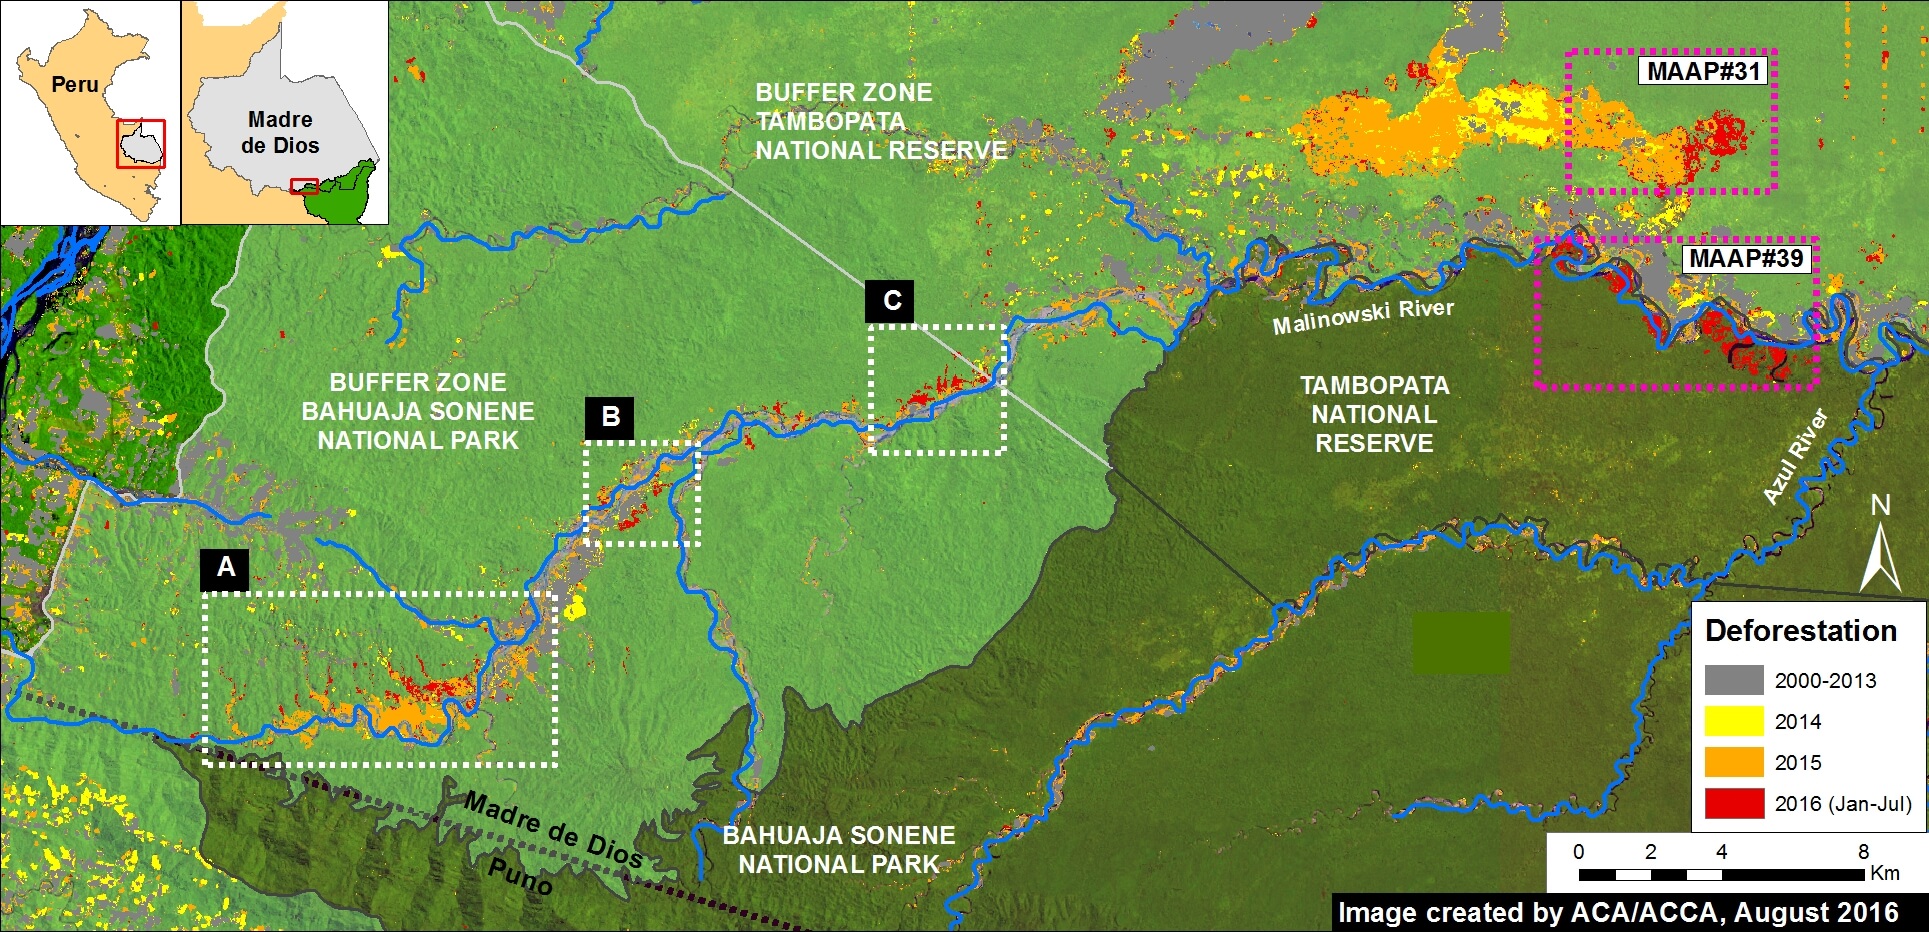
Image 43a. Data: UMD/GLAD, Hansen/UMD/Google/USGS/NASA, NASA/USGS, SERNANP
The following Images 43b-d show, in high-resolution, the rapid expansion of gold mining deforestation between August/September 2015 (left panel) and July/August 2016 (right panel). The yellow circles indicate the main areas of deforestation between the images.
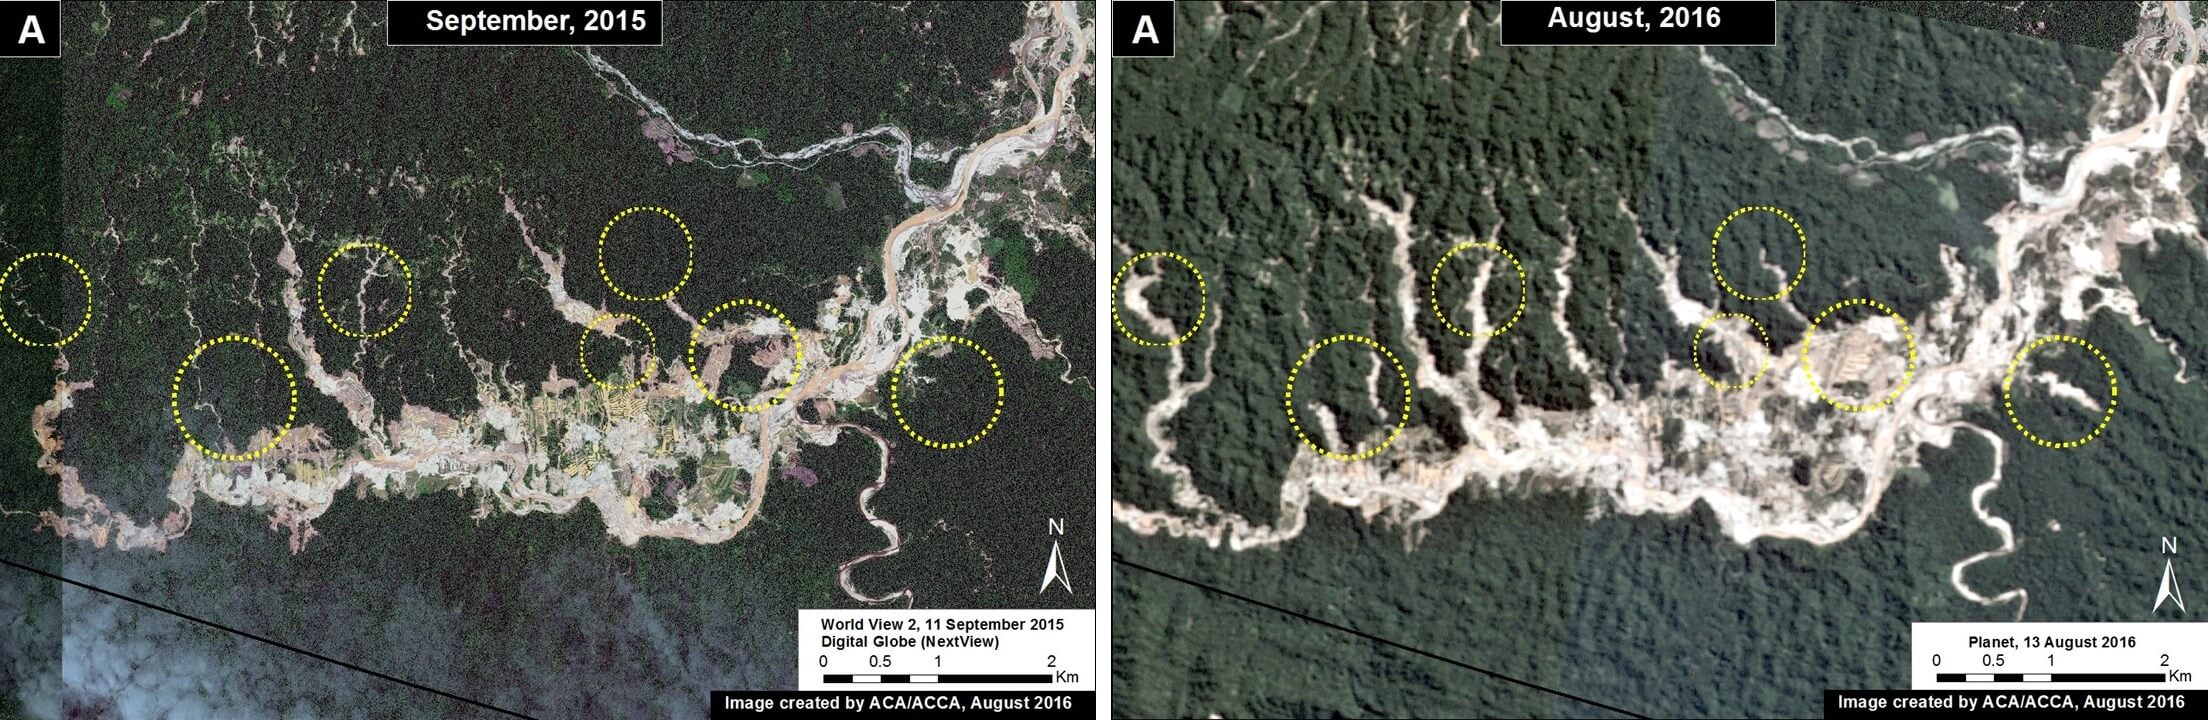
Image 43b. Data: Planet, Digital Globe (Nextview)
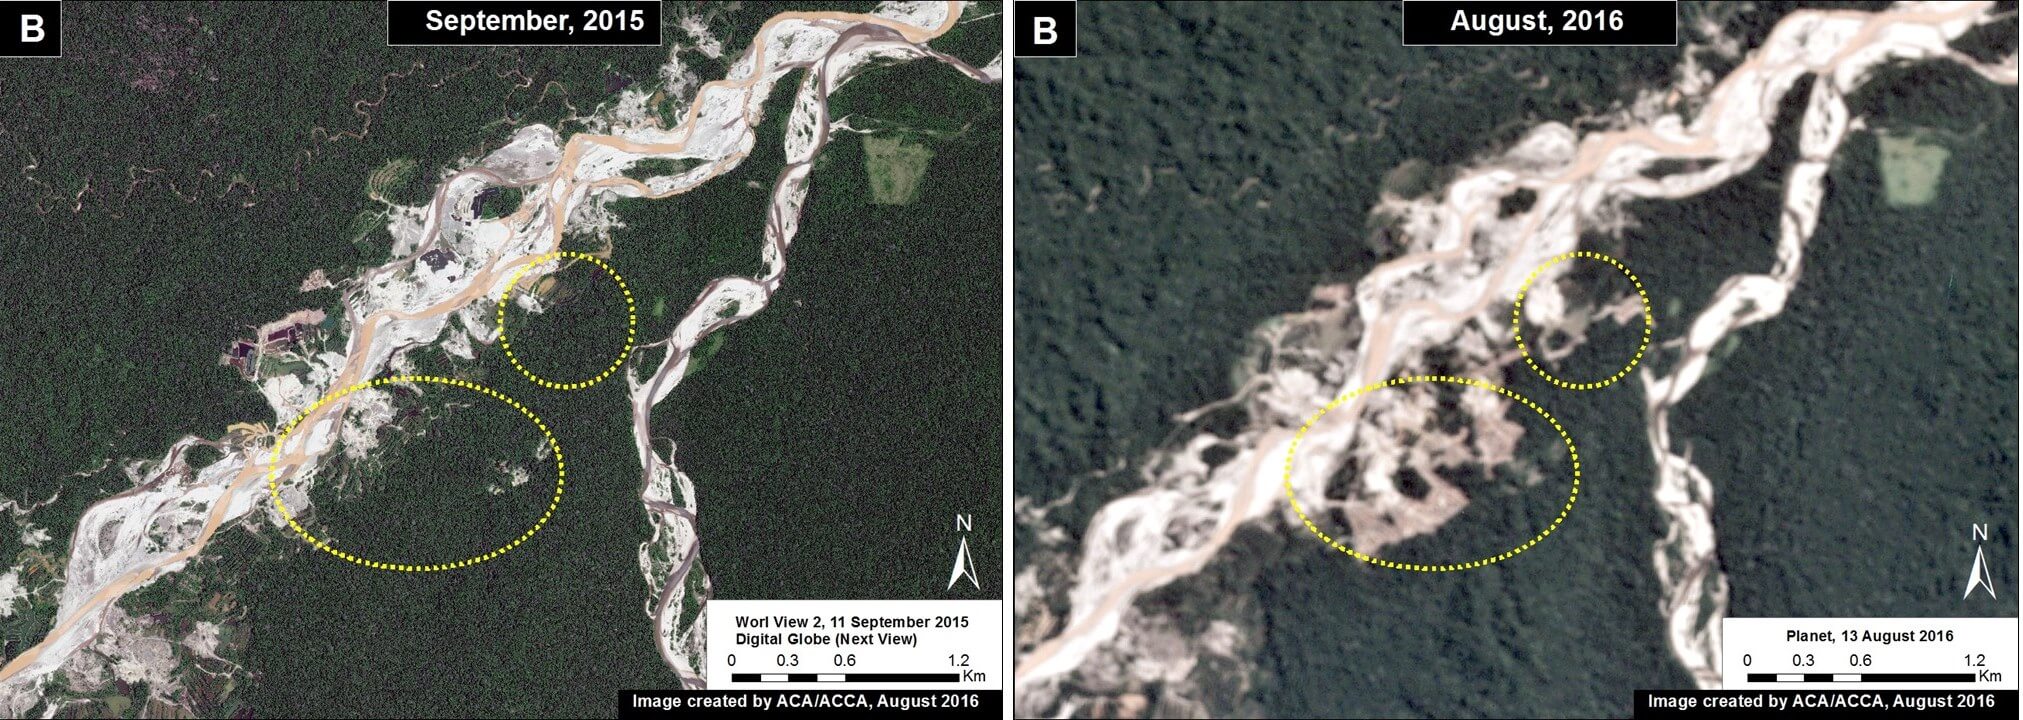
Image 43c. Data: Planet, Digital Globe (Nextview)
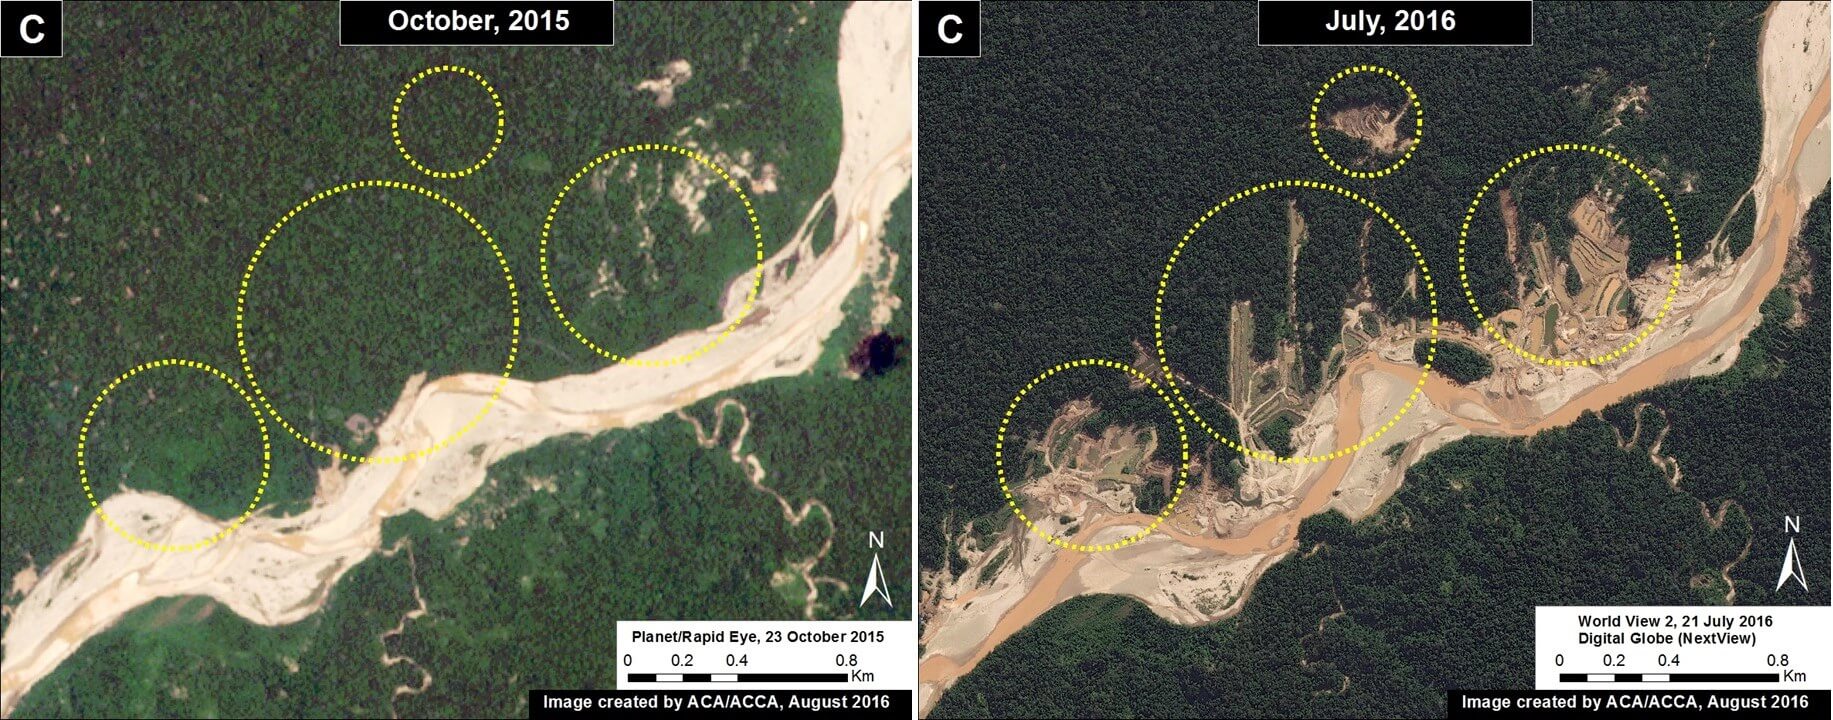
Image 43d. Data: Planet, Digital Globe (Nextview)
Example 2: Logging Road in buffer zone of Cordillera Azul National Park (Ucayali/Loreto)
In the previous MAAP #18, we discussed the proliferation of logging roads in the central Peruvian Amazon in 2015. Here, we show the expansion of two of these logging roads in 2016. (see Image 43e). Red indicates construction during 2016 (47 km). Insets A1-A3 correspond to the areas featured in the high-resolution zooms below. Note that the northern road (Inset A3) is within the buffer zone of Cordillera Azul National Park. Evidence suggests that this road is not legal because it extends out of the permited area (see MAAP #18 for more details).
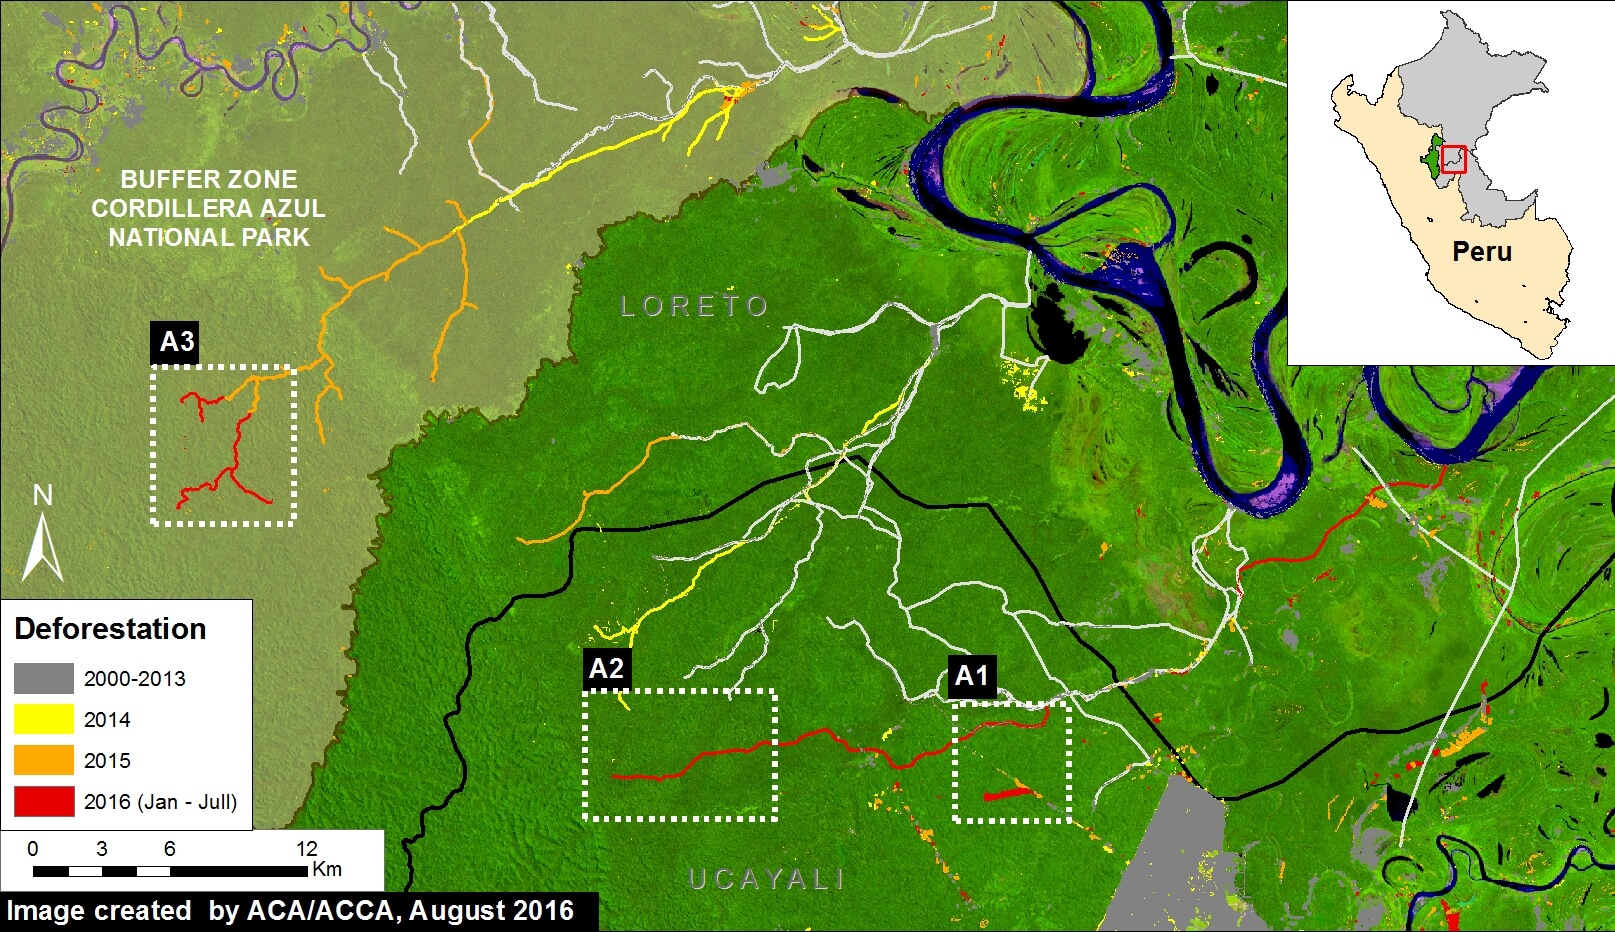
Image 43e. Data: UMD/GLAD, Hansen/UMD/Google/USGS/NASA, SERNANP
The following images show, in high-resolution, the rapid construction of these logging roads. Image 43f shows the construction of part of the southern road (Inset A1), and the deforestation for a nearby agricultural parcel, between April (left panel) and July (right panel) 2016. Image 43g shows the construction of 1.8 km in just three days along this same road (Inset A2) between July 21 (left panel) and July 24 (right panel) 2016.
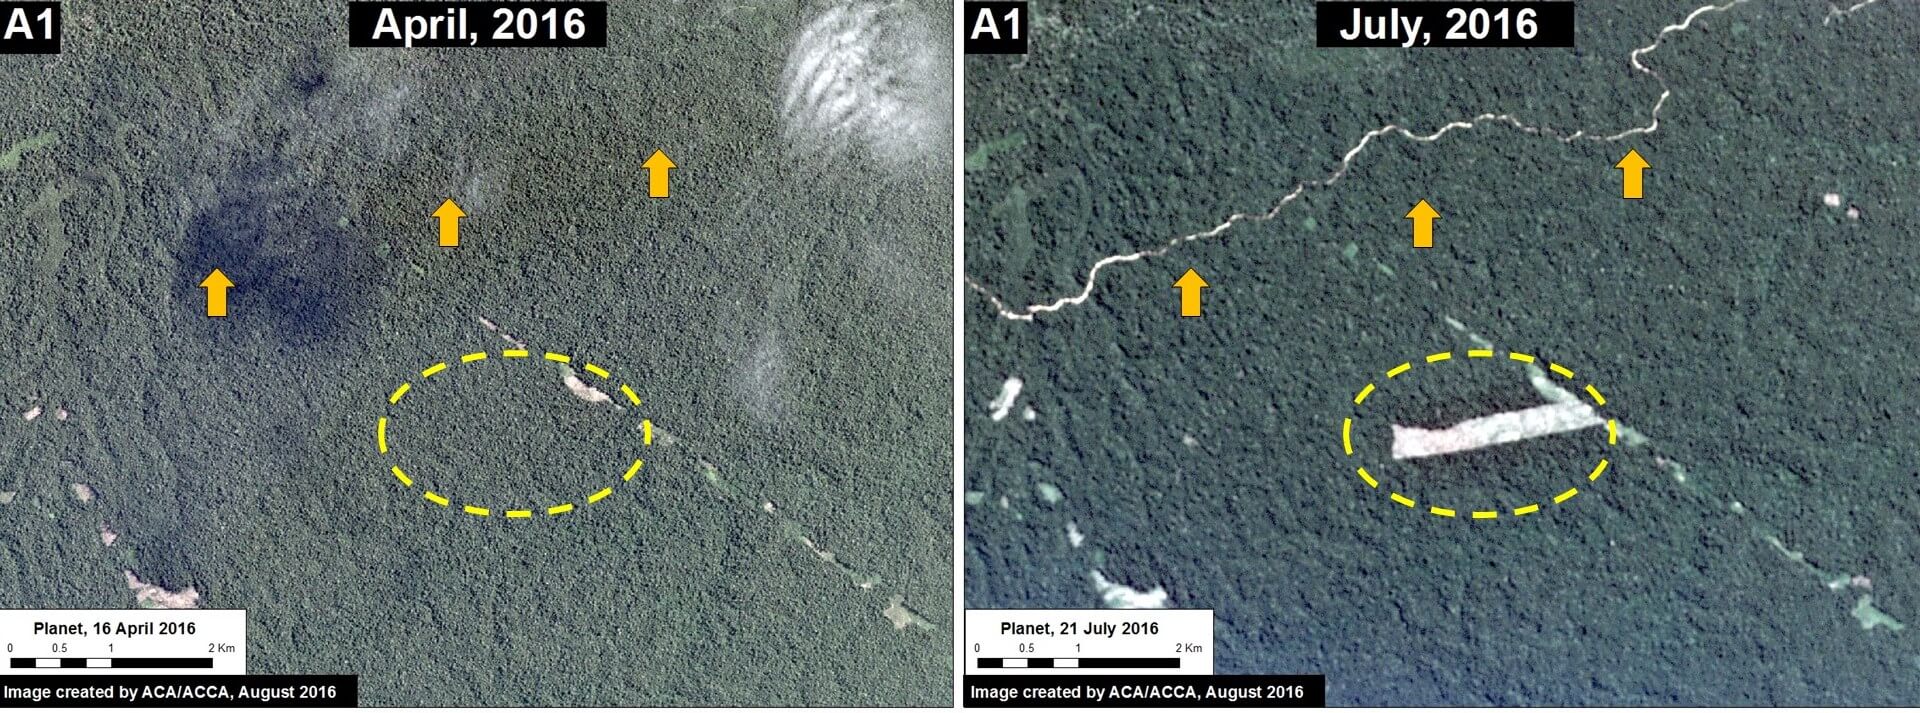
Image 43f. Data: Planet
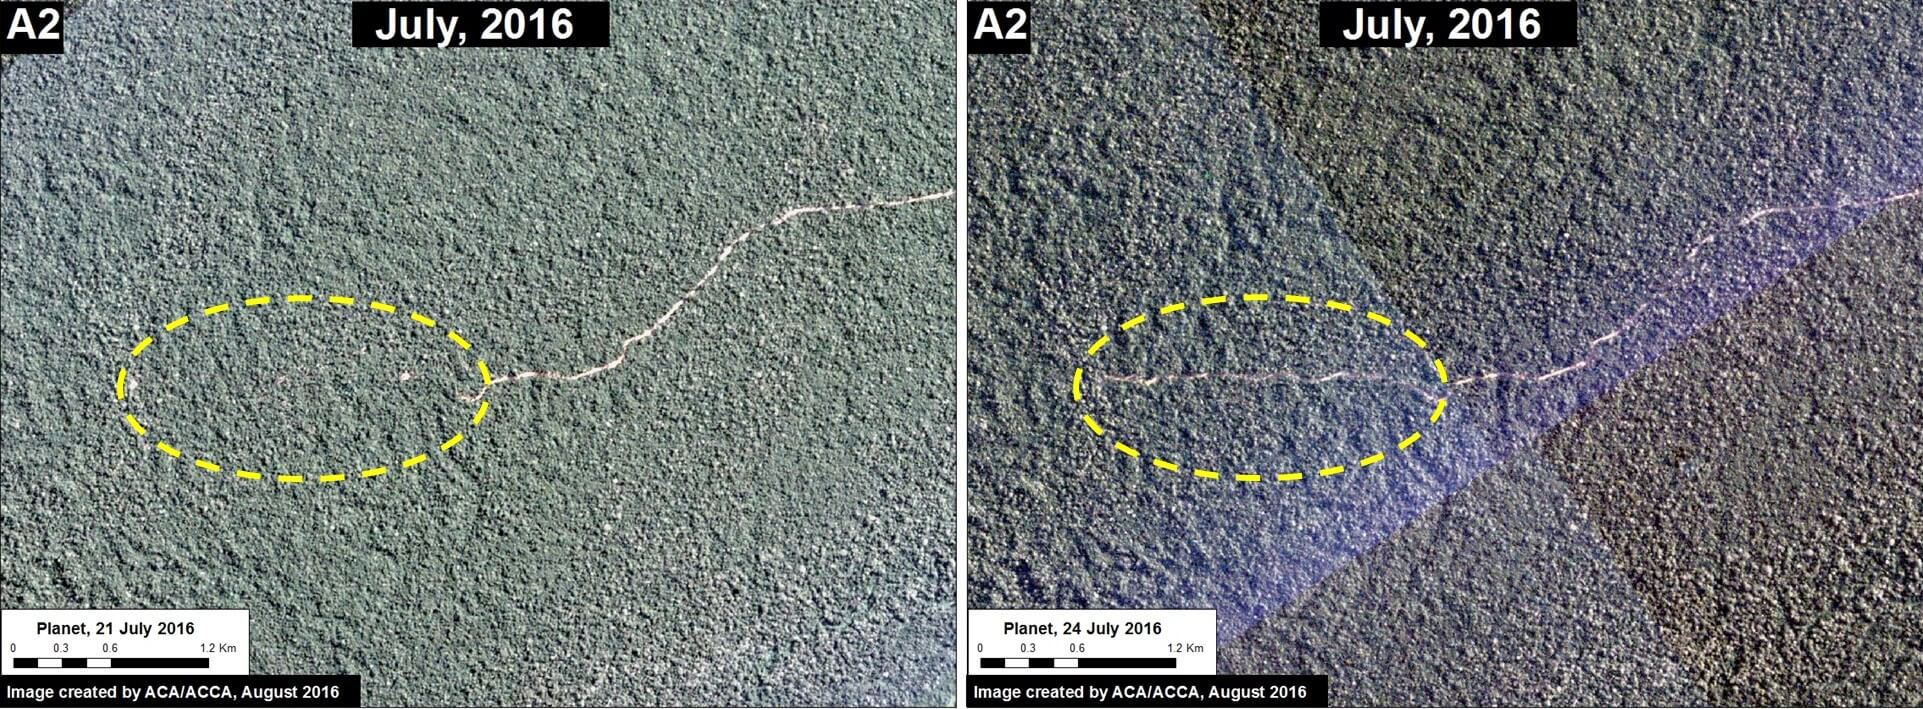
Image 43g. Data: Planet
Image 43h shows the construction of 13 km on the northern road between November 2015 (left panel) and July 2016 (right panel) within the buffer zone of the Cordillera Azul National Park.
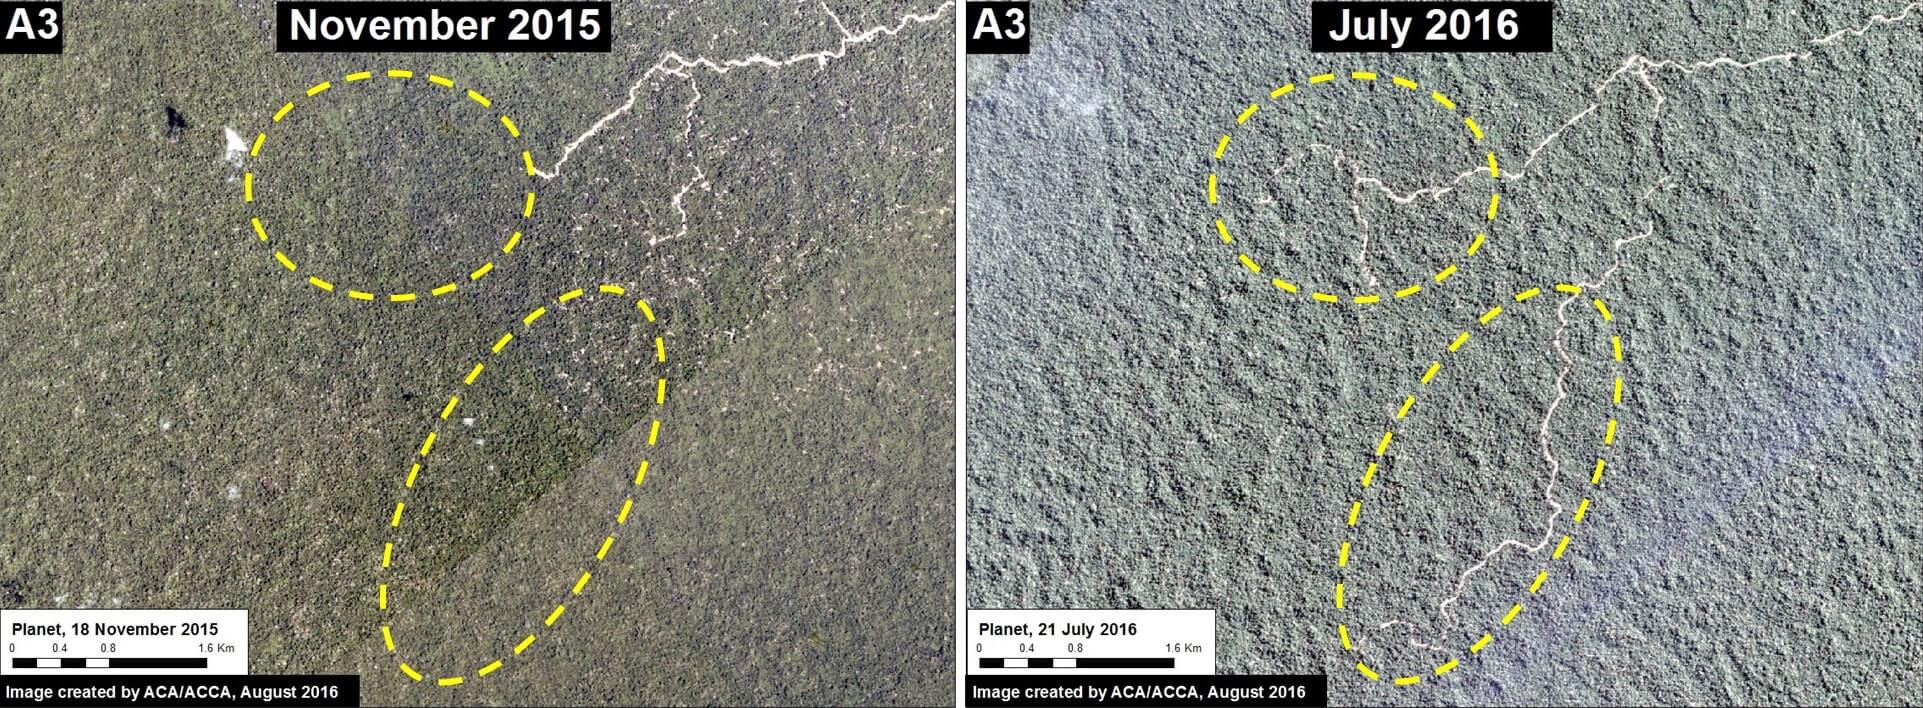
Image 43h. Data: Planet
Example 3: Deforestation in Permanent Production Forest (Ucayali)
Image 43i shows recent deforestation of 136 hectares (336 acres) in 2016 in southern Ucayali region within areas classified as Permanent Production Forest and Foresty Concession. These types of areas are generally zoned for sustainable forestry uses, not clear-cutting, thus we question the legality of the deforestation. Tables A-B correspond to the areas featured in the high-resolution zooms, below.
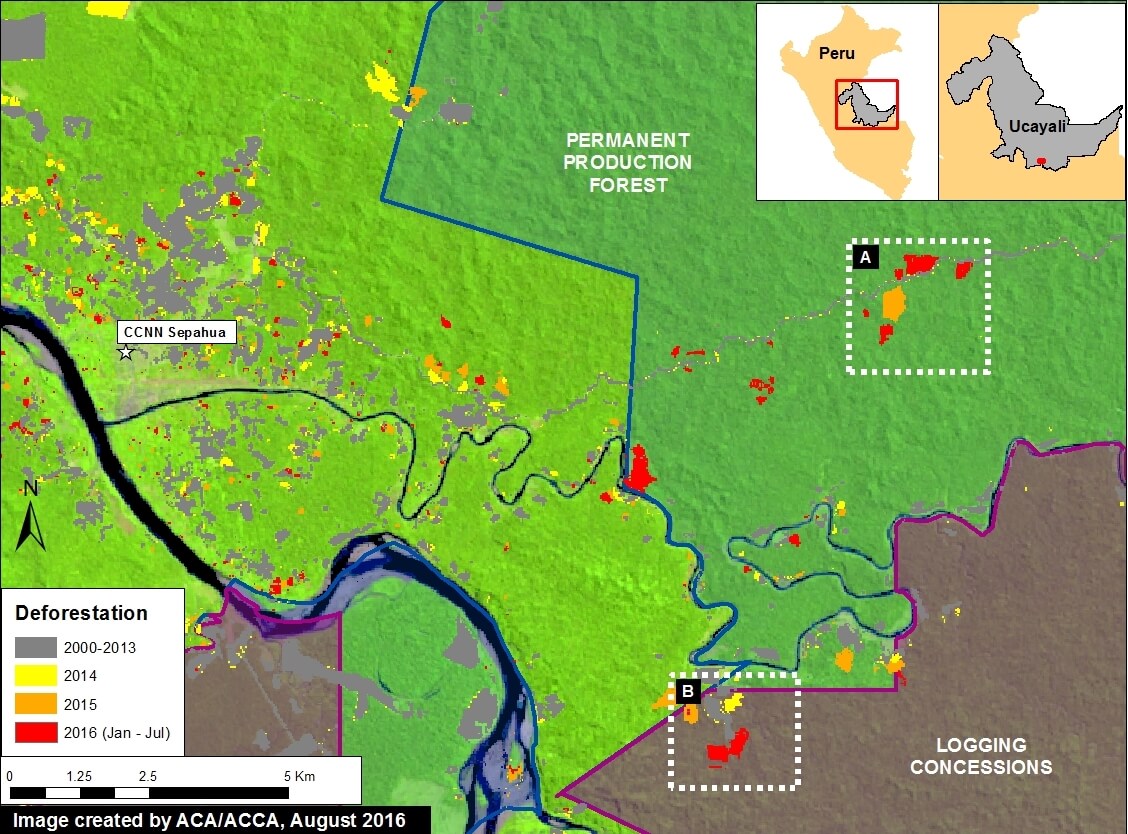
Image 43i. Data: UMD/GLAD, Hansen/UMD/Google/USGS/NASA, MINAGRI
Image 43j shows deforestation within a section of Permanent Production Forest, and Image 43k shows deforestation within a section of Forestry Concession.
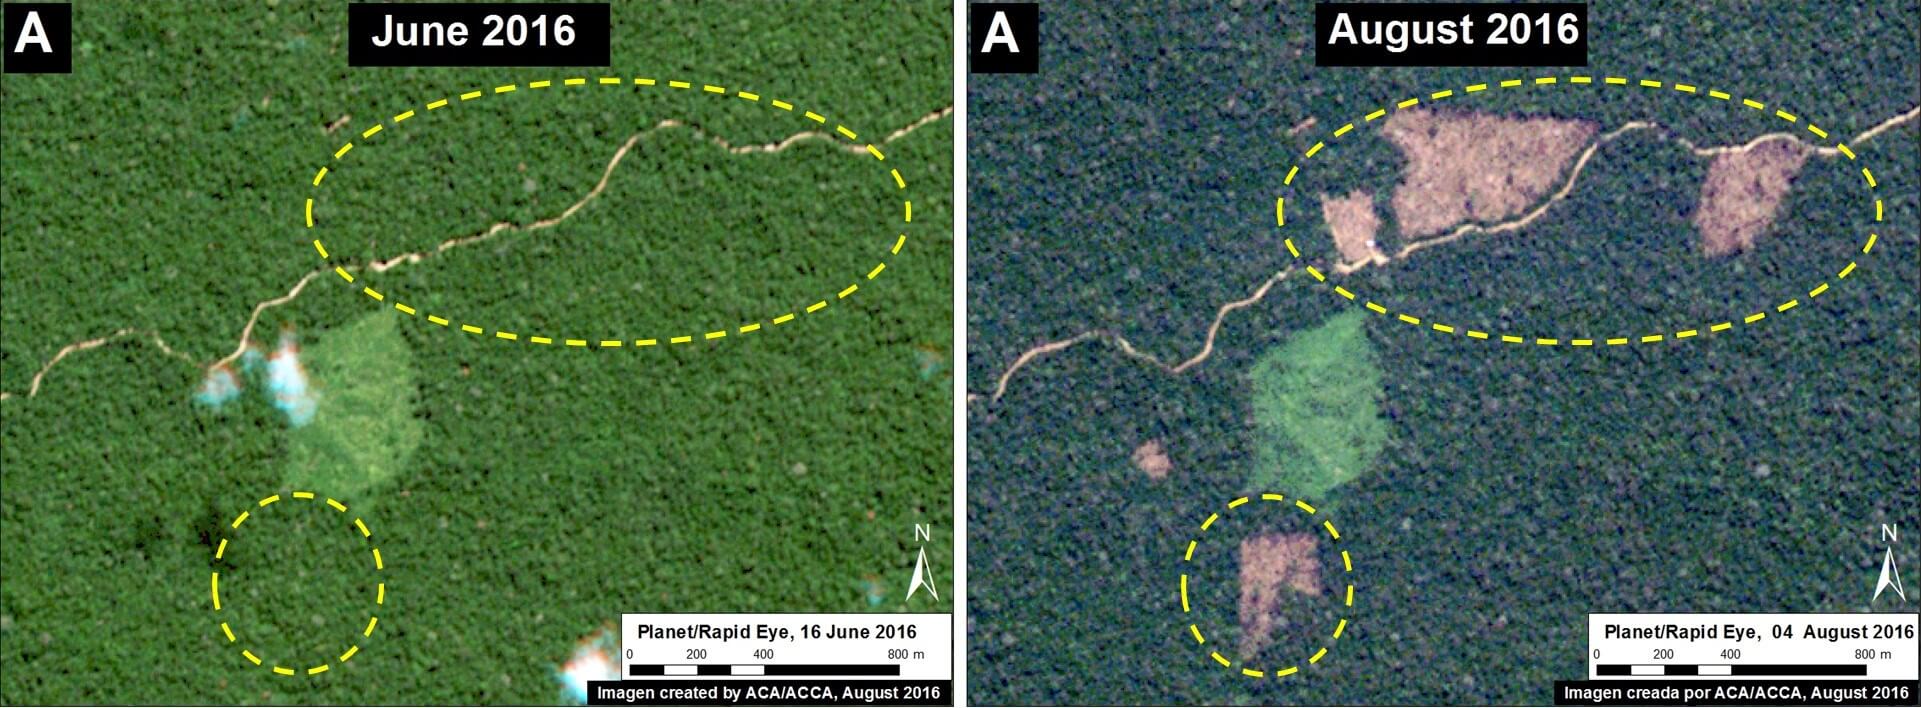
Image 43j. Data: Planet
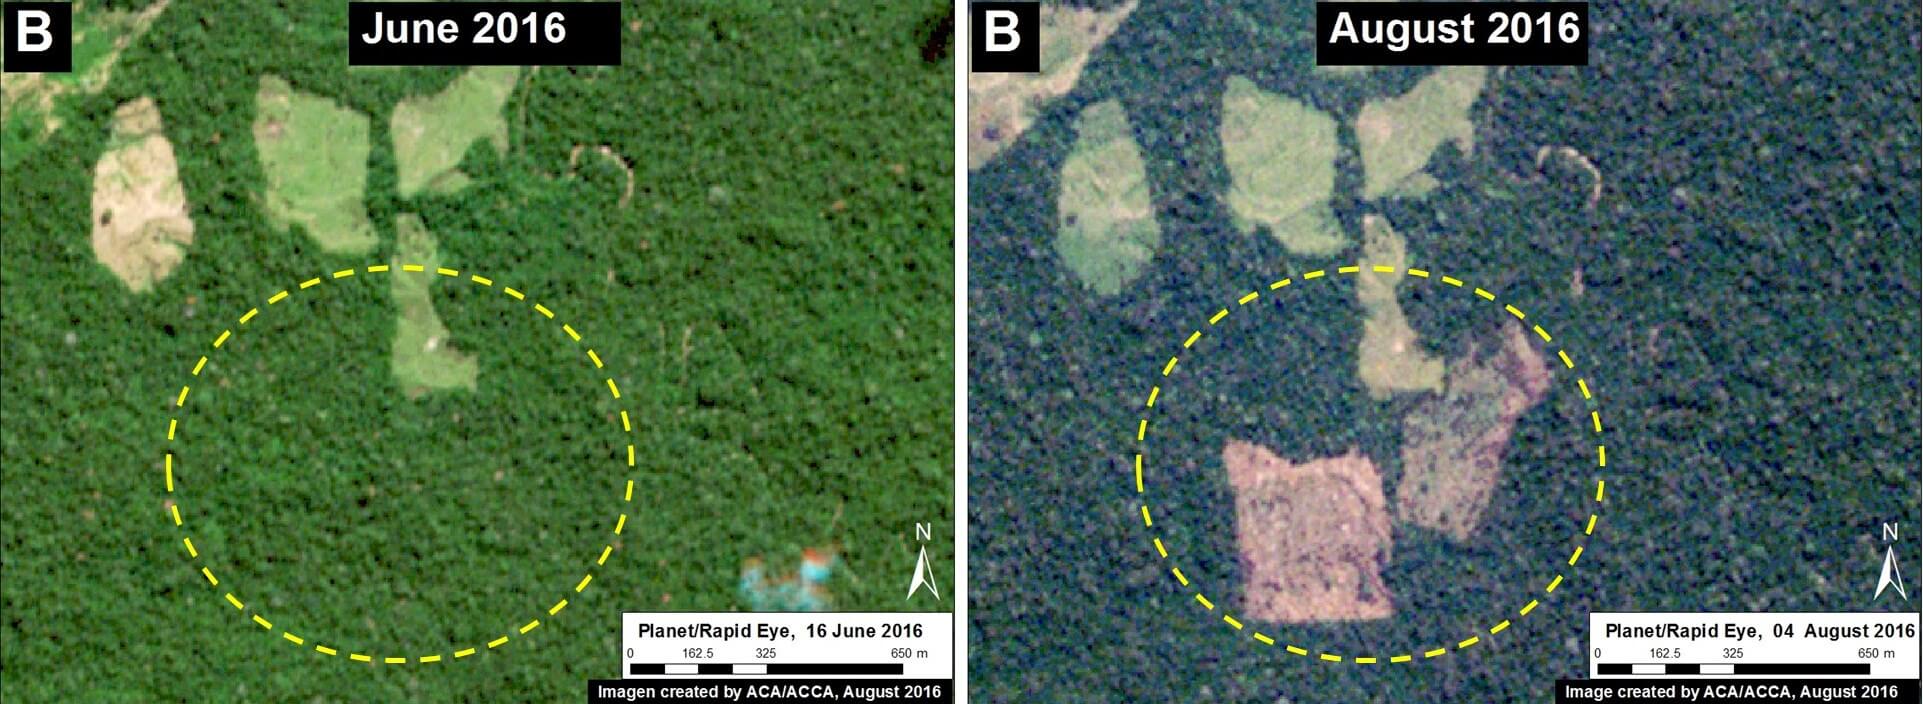
Image 43k. Data: Planet
Citation
Finer M, Novoa S, Goldthwait E (2016) Early Warning Deforestation Alerts in the Peruvian Amazon, Part 2. MAAP: 43.
MAAP #42: Papaya – New Deforestation Driver in Peruvian Amazon
In the previous MAAP #26, we published a preliminary map of Deforestation Hotspots in the Peruvian Amazon for 2015. Subsequently in 2016, we have been compiling information to improve understanding on the potential causes (drivers) of deforestation in the identified hotspots. In this article, we focus on a medium-intensity hotspot located along the newly paved Interoceanic Highway in the eastern part of the Madre de Dios region (see Inset A in Image 42a).
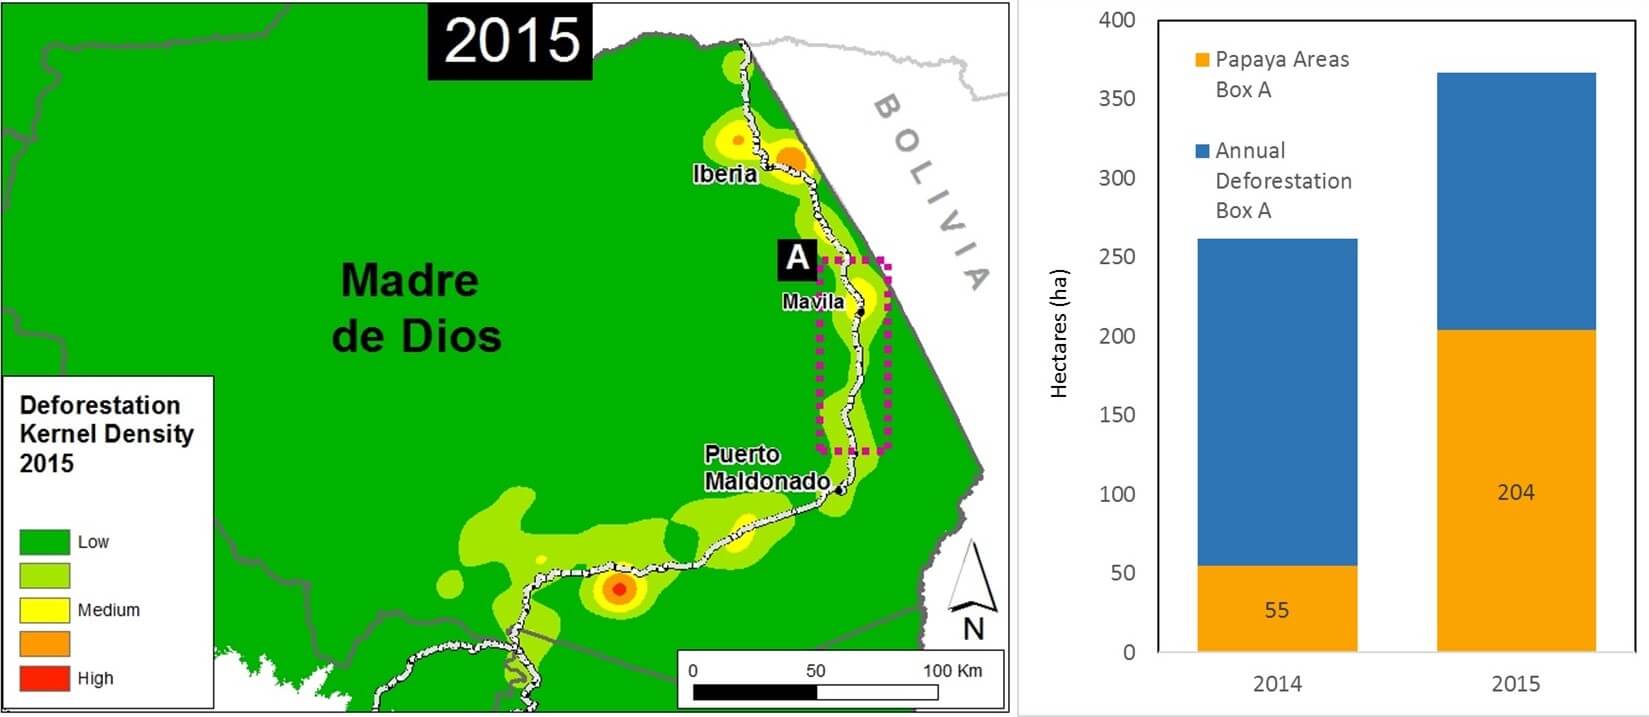
Image 42a. Data. UMD/GLAD, MTC, MAAP
The analysis in this article is based on field work carried out by the Peruvian Ministry of Environment, in collaboration with Terra-i. This team has verified the presence of papaya plantations in the area indicated by Inset A and shared their photos and coordinates with MAAP to allow us to search for and analyze relevant satellite imagery.
Synthesizing all of the available information, we found that the establishment of papaya plantations was an important deforestation driver in the area in 2015. Within the focal area (Inset A), we estimate the deforestation of 204 hectares (504 acres) for papaya plantations in 2015, a major increase relative to 2014 (see bar graph in Image 42a).
All of the papaya deforestation is small (< 5 hectares) or medium (5-50 hectares) scale. According to the analysis presented in MAAP #32, these two scales represented 99% of the deforestation events in Peru in 2015. Approximately 90% of the observed deforestation is within areas zoned for agricultural activity. Therefore, the legality of the deforestation in not known (i.e. if all the required permits were obtained).
Below, we show satellite images and field photos of 5 examples of the recent deforestation caused by papaya cultivation.
Example #1
Image 42b shows the deforestation of 12 hectares between September 2013 (left panel) and January 2016 (right panel). The red point indicates the same place in both images. Image 42c is a photo of the new papaya plantation in this area.
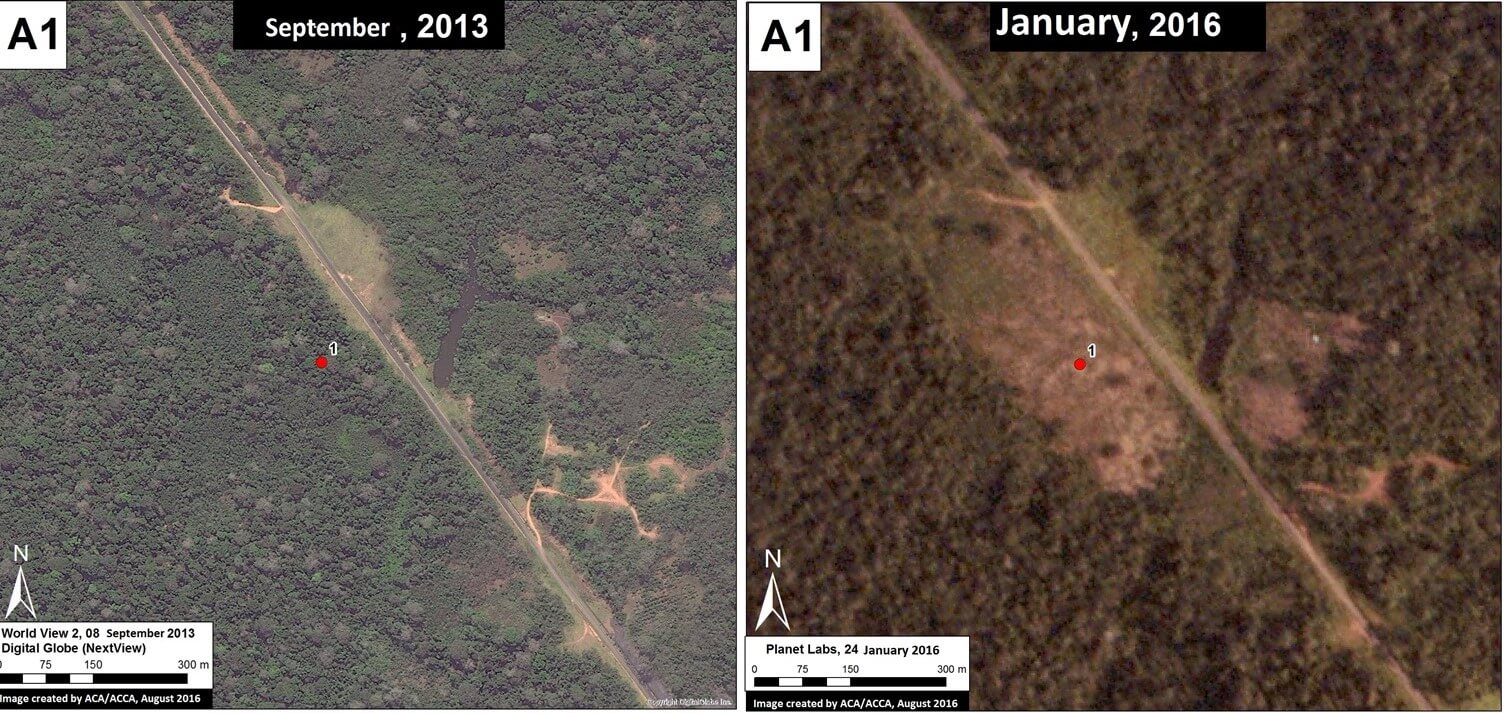
Image 42b. Data: Digital Globe (Nextview), Planet Labs
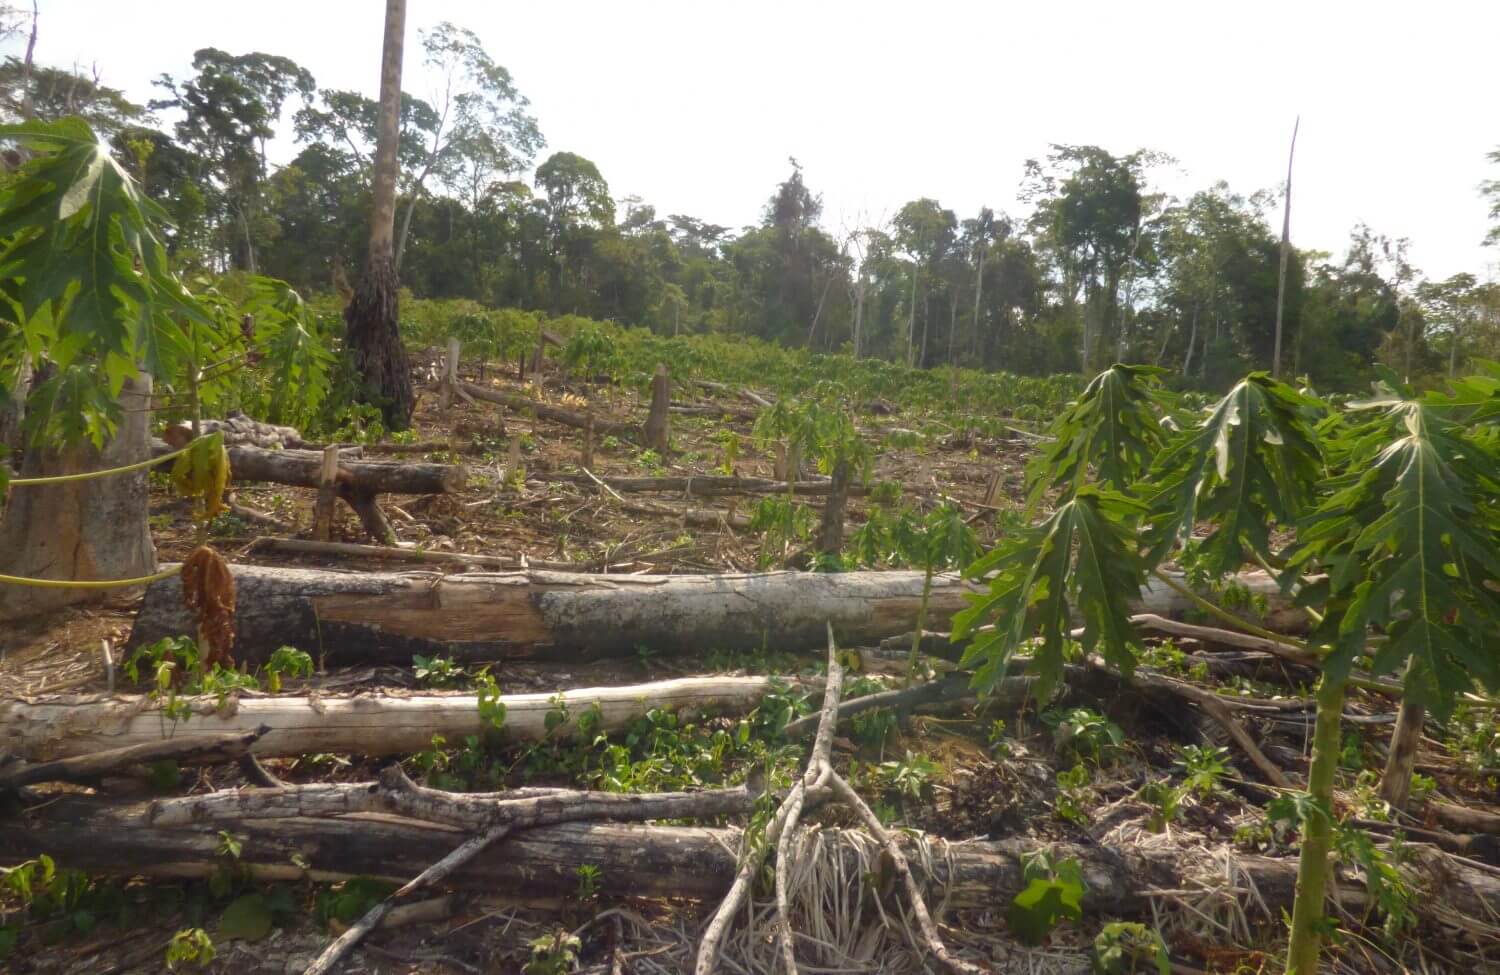
Image 42c. Photo: MINAM/DGOT, Terra-i
Example #2
Image 42d shows the deforestation of 5 hectares between September 2013 (left panel) and January 2016 (right panel). The red point indicates the same place in both images. Image 42e is a photo of the new papaya plantation in this area.
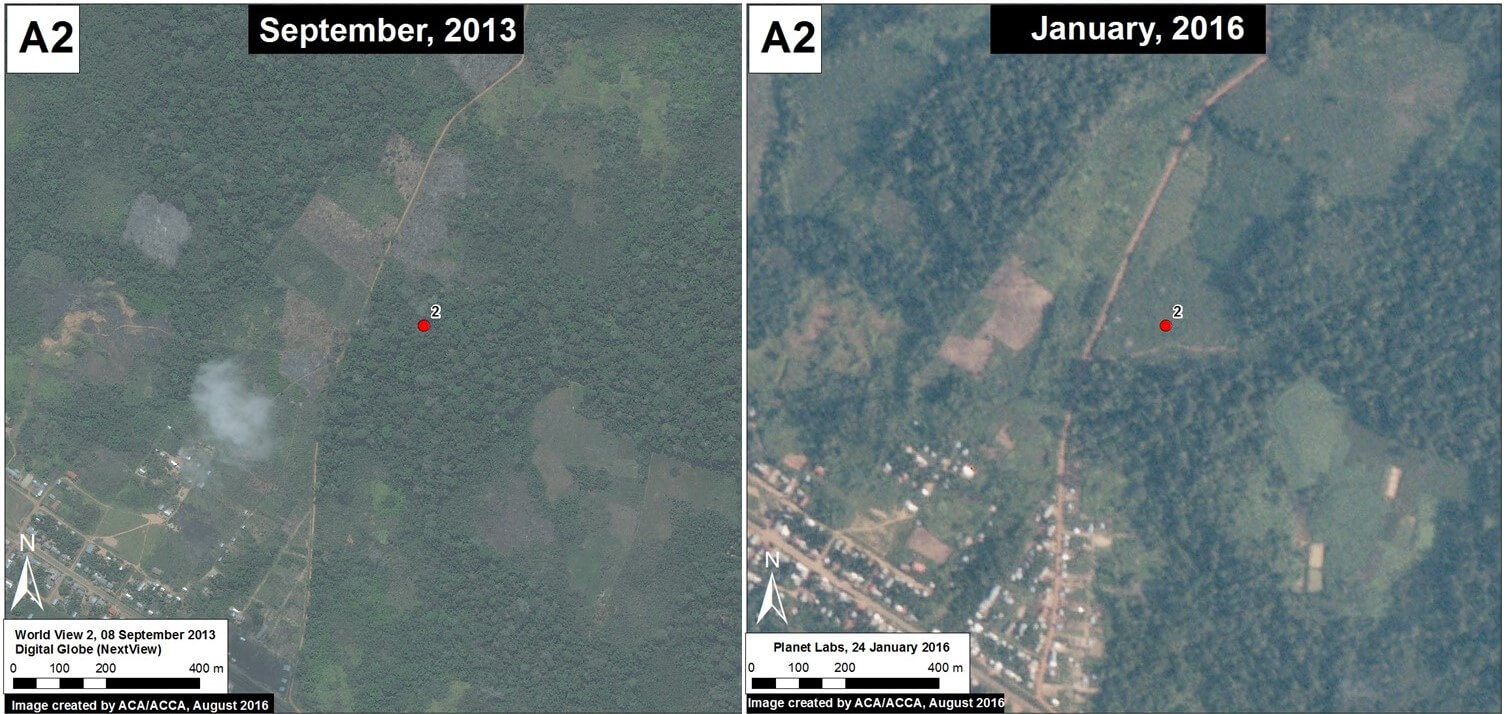
Image 42d. Digital Globe (Nextview), Planet Labs
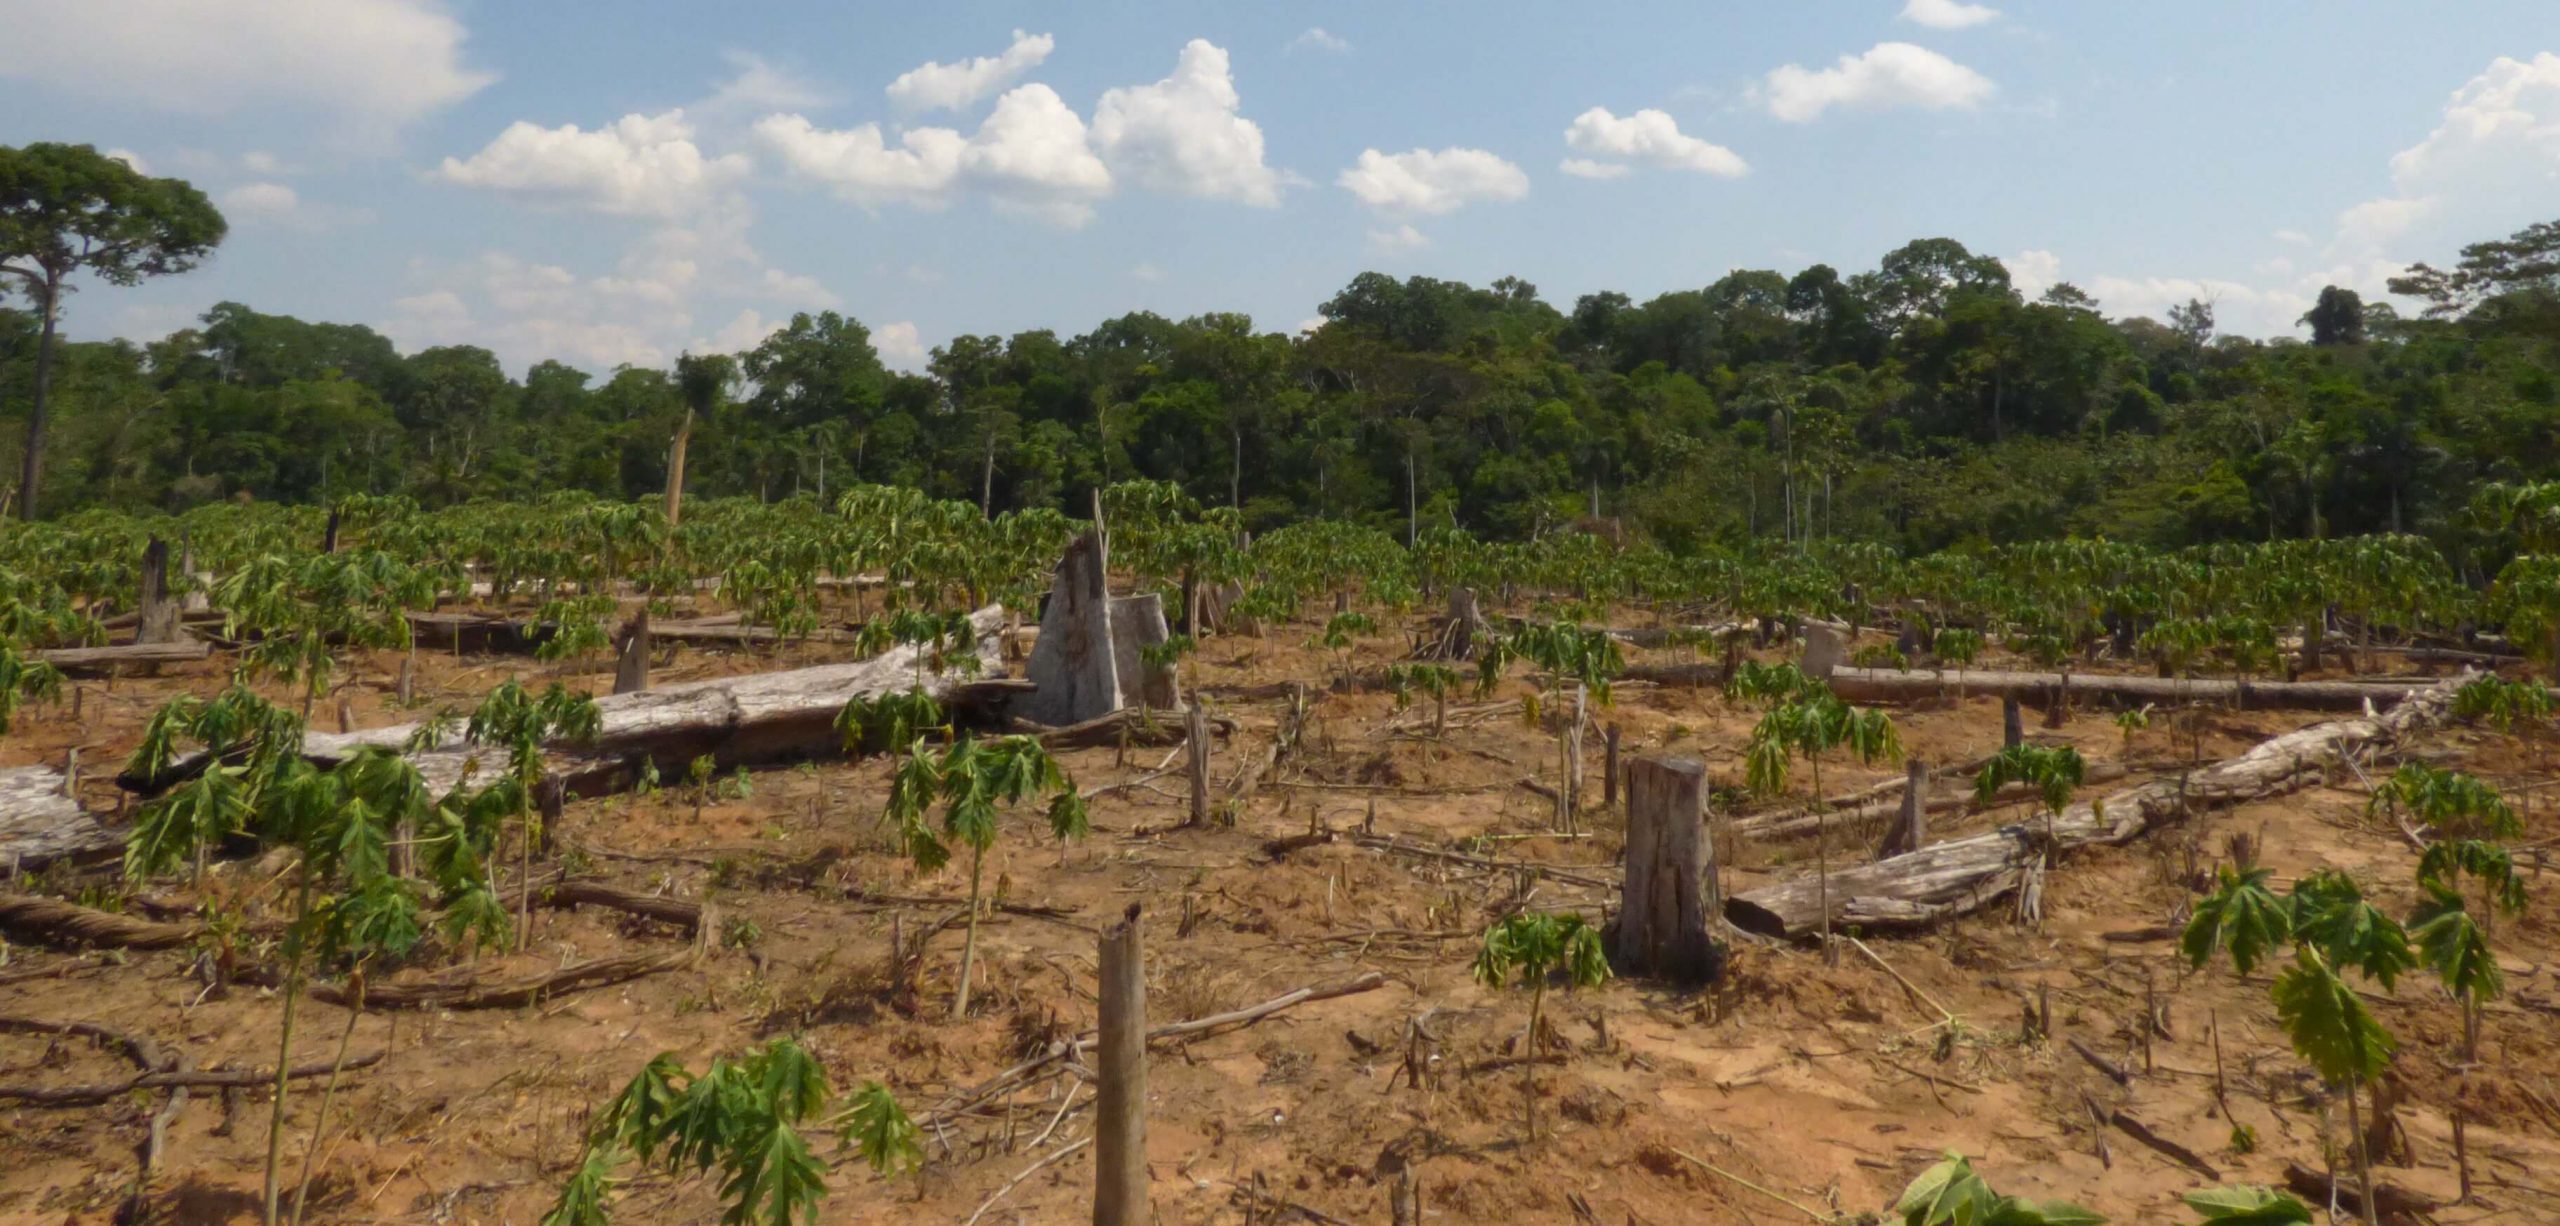
Image 42e. Photo: MINAM/DGOT, Terra-i
Example #3
Image 42f shows the deforestation of 5 hectares between September 2013 (left panel) and January 2016 (right panel). The red point indicates the same place in both images. Image 42g is a photo of the new papaya plantation in this area.
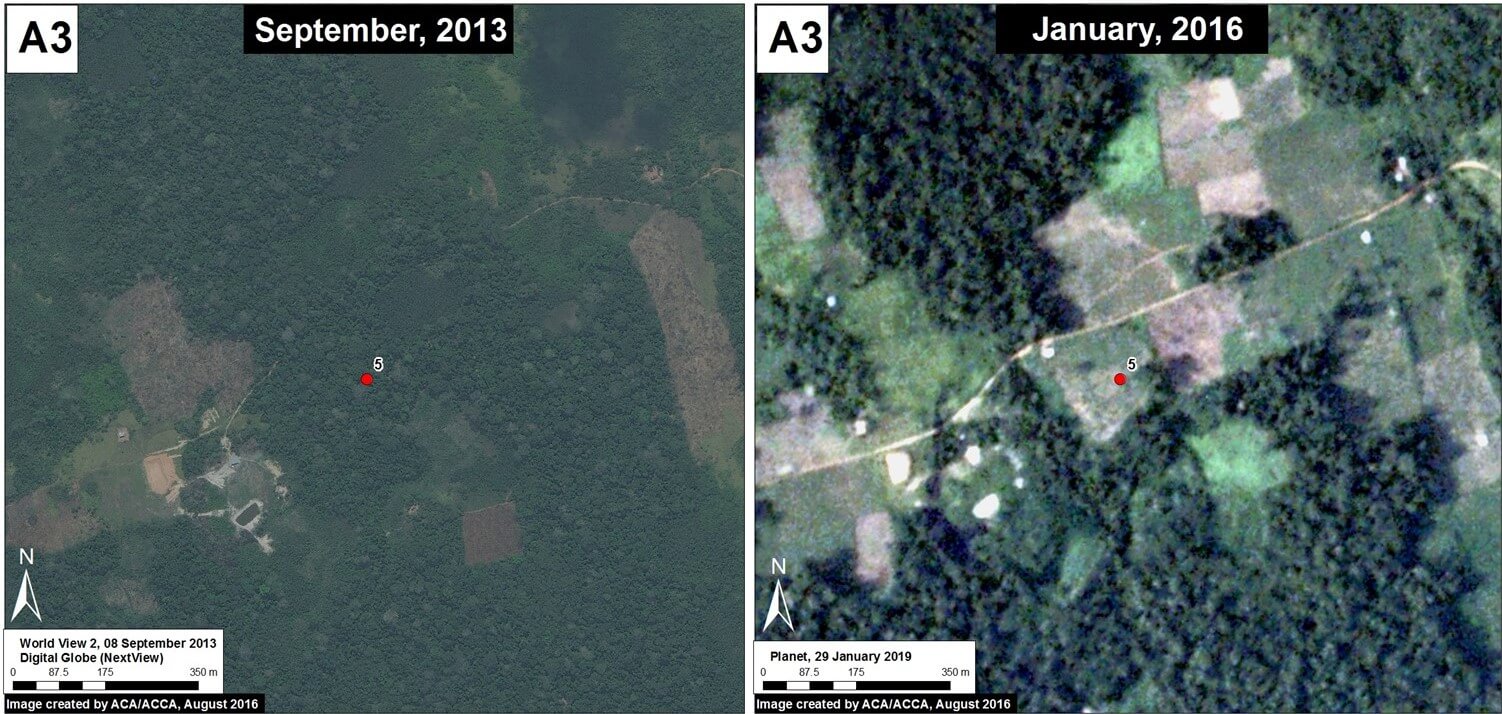
Image 42f. Digital Globe (Nextview), Planet Labs
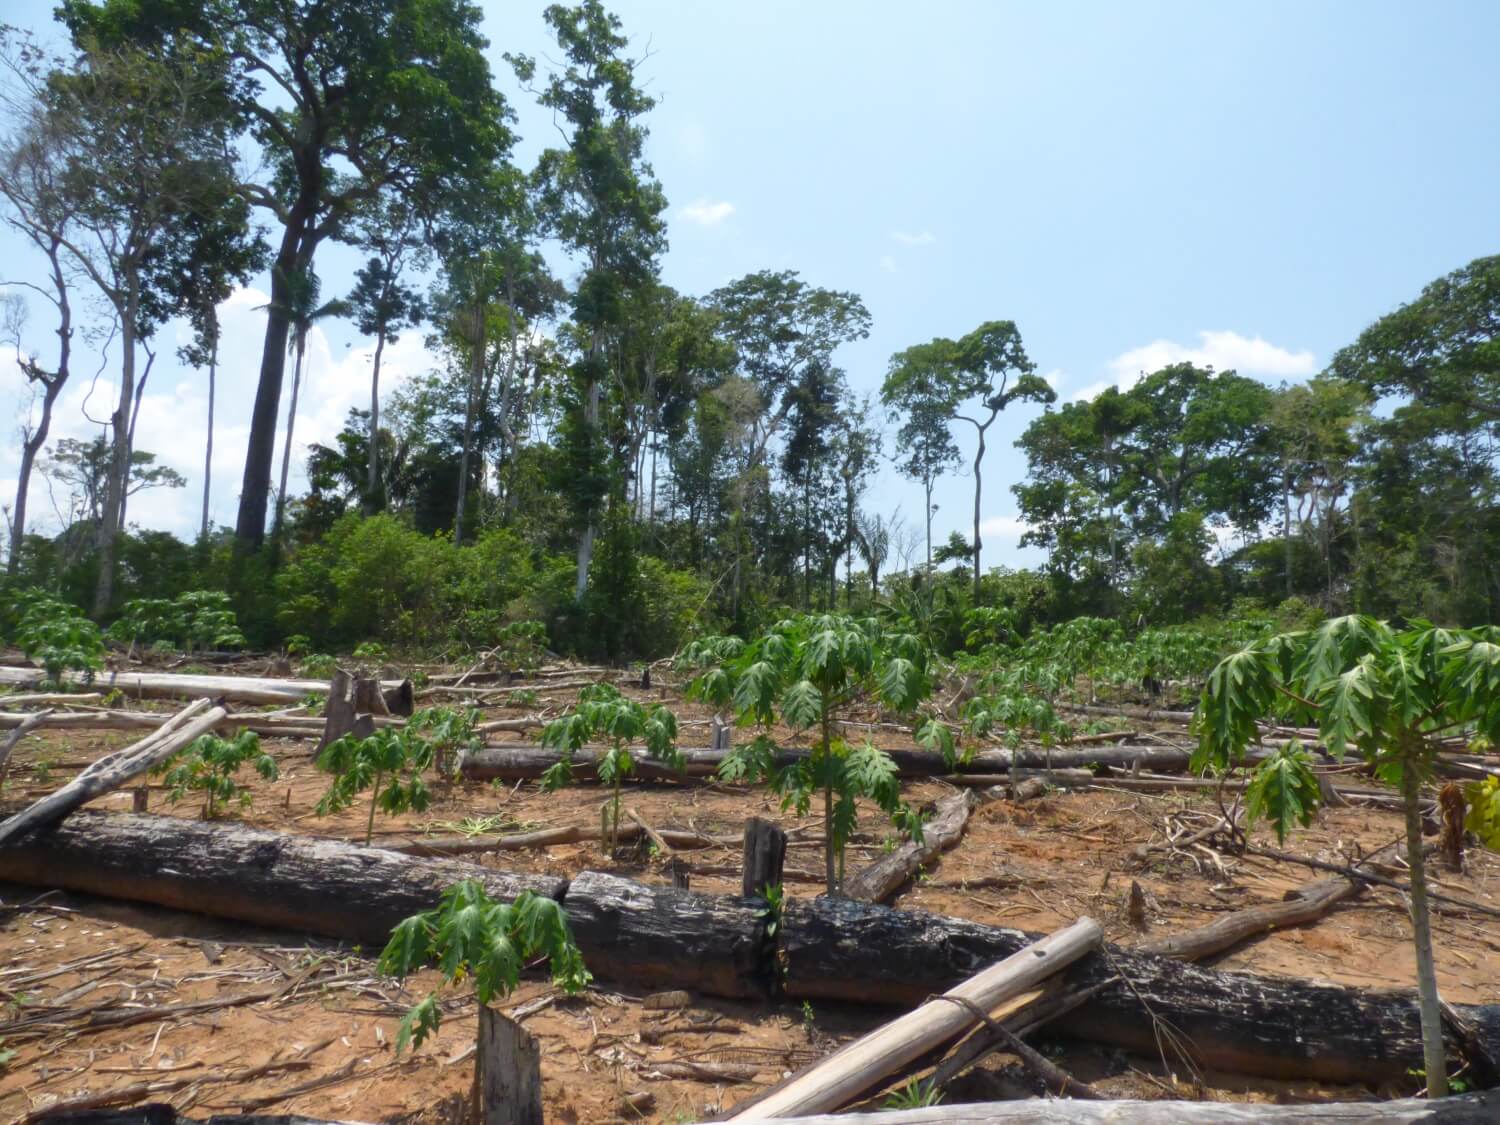
Image 42g. MINAM/DGOT, Terra-i
Example #4
Image 42h shows the deforestation of 12 hectares between September 2013 (left panel) and May 2016 (right panel). The red point indicates the same place in both images. Image 42i is a photo of the new papaya plantation in this area.
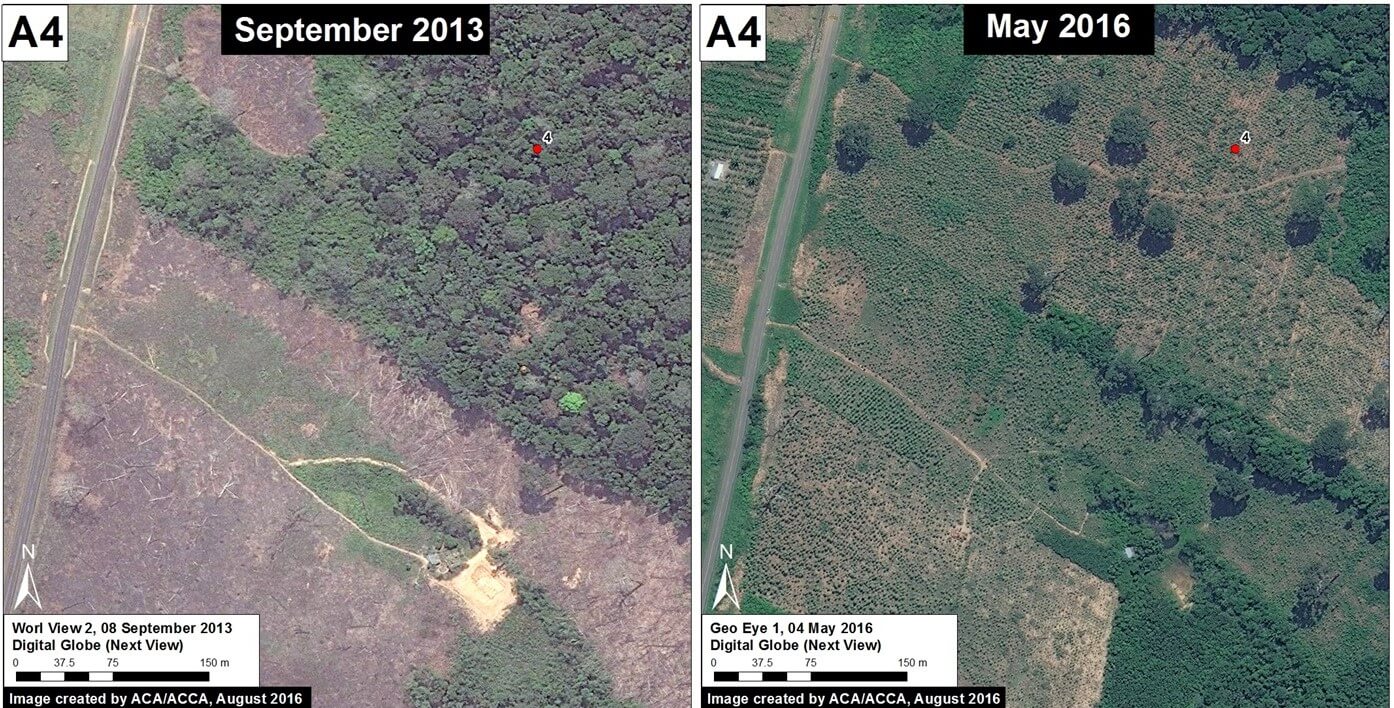
Image 42h. MINAM/DGOT, Terra-i
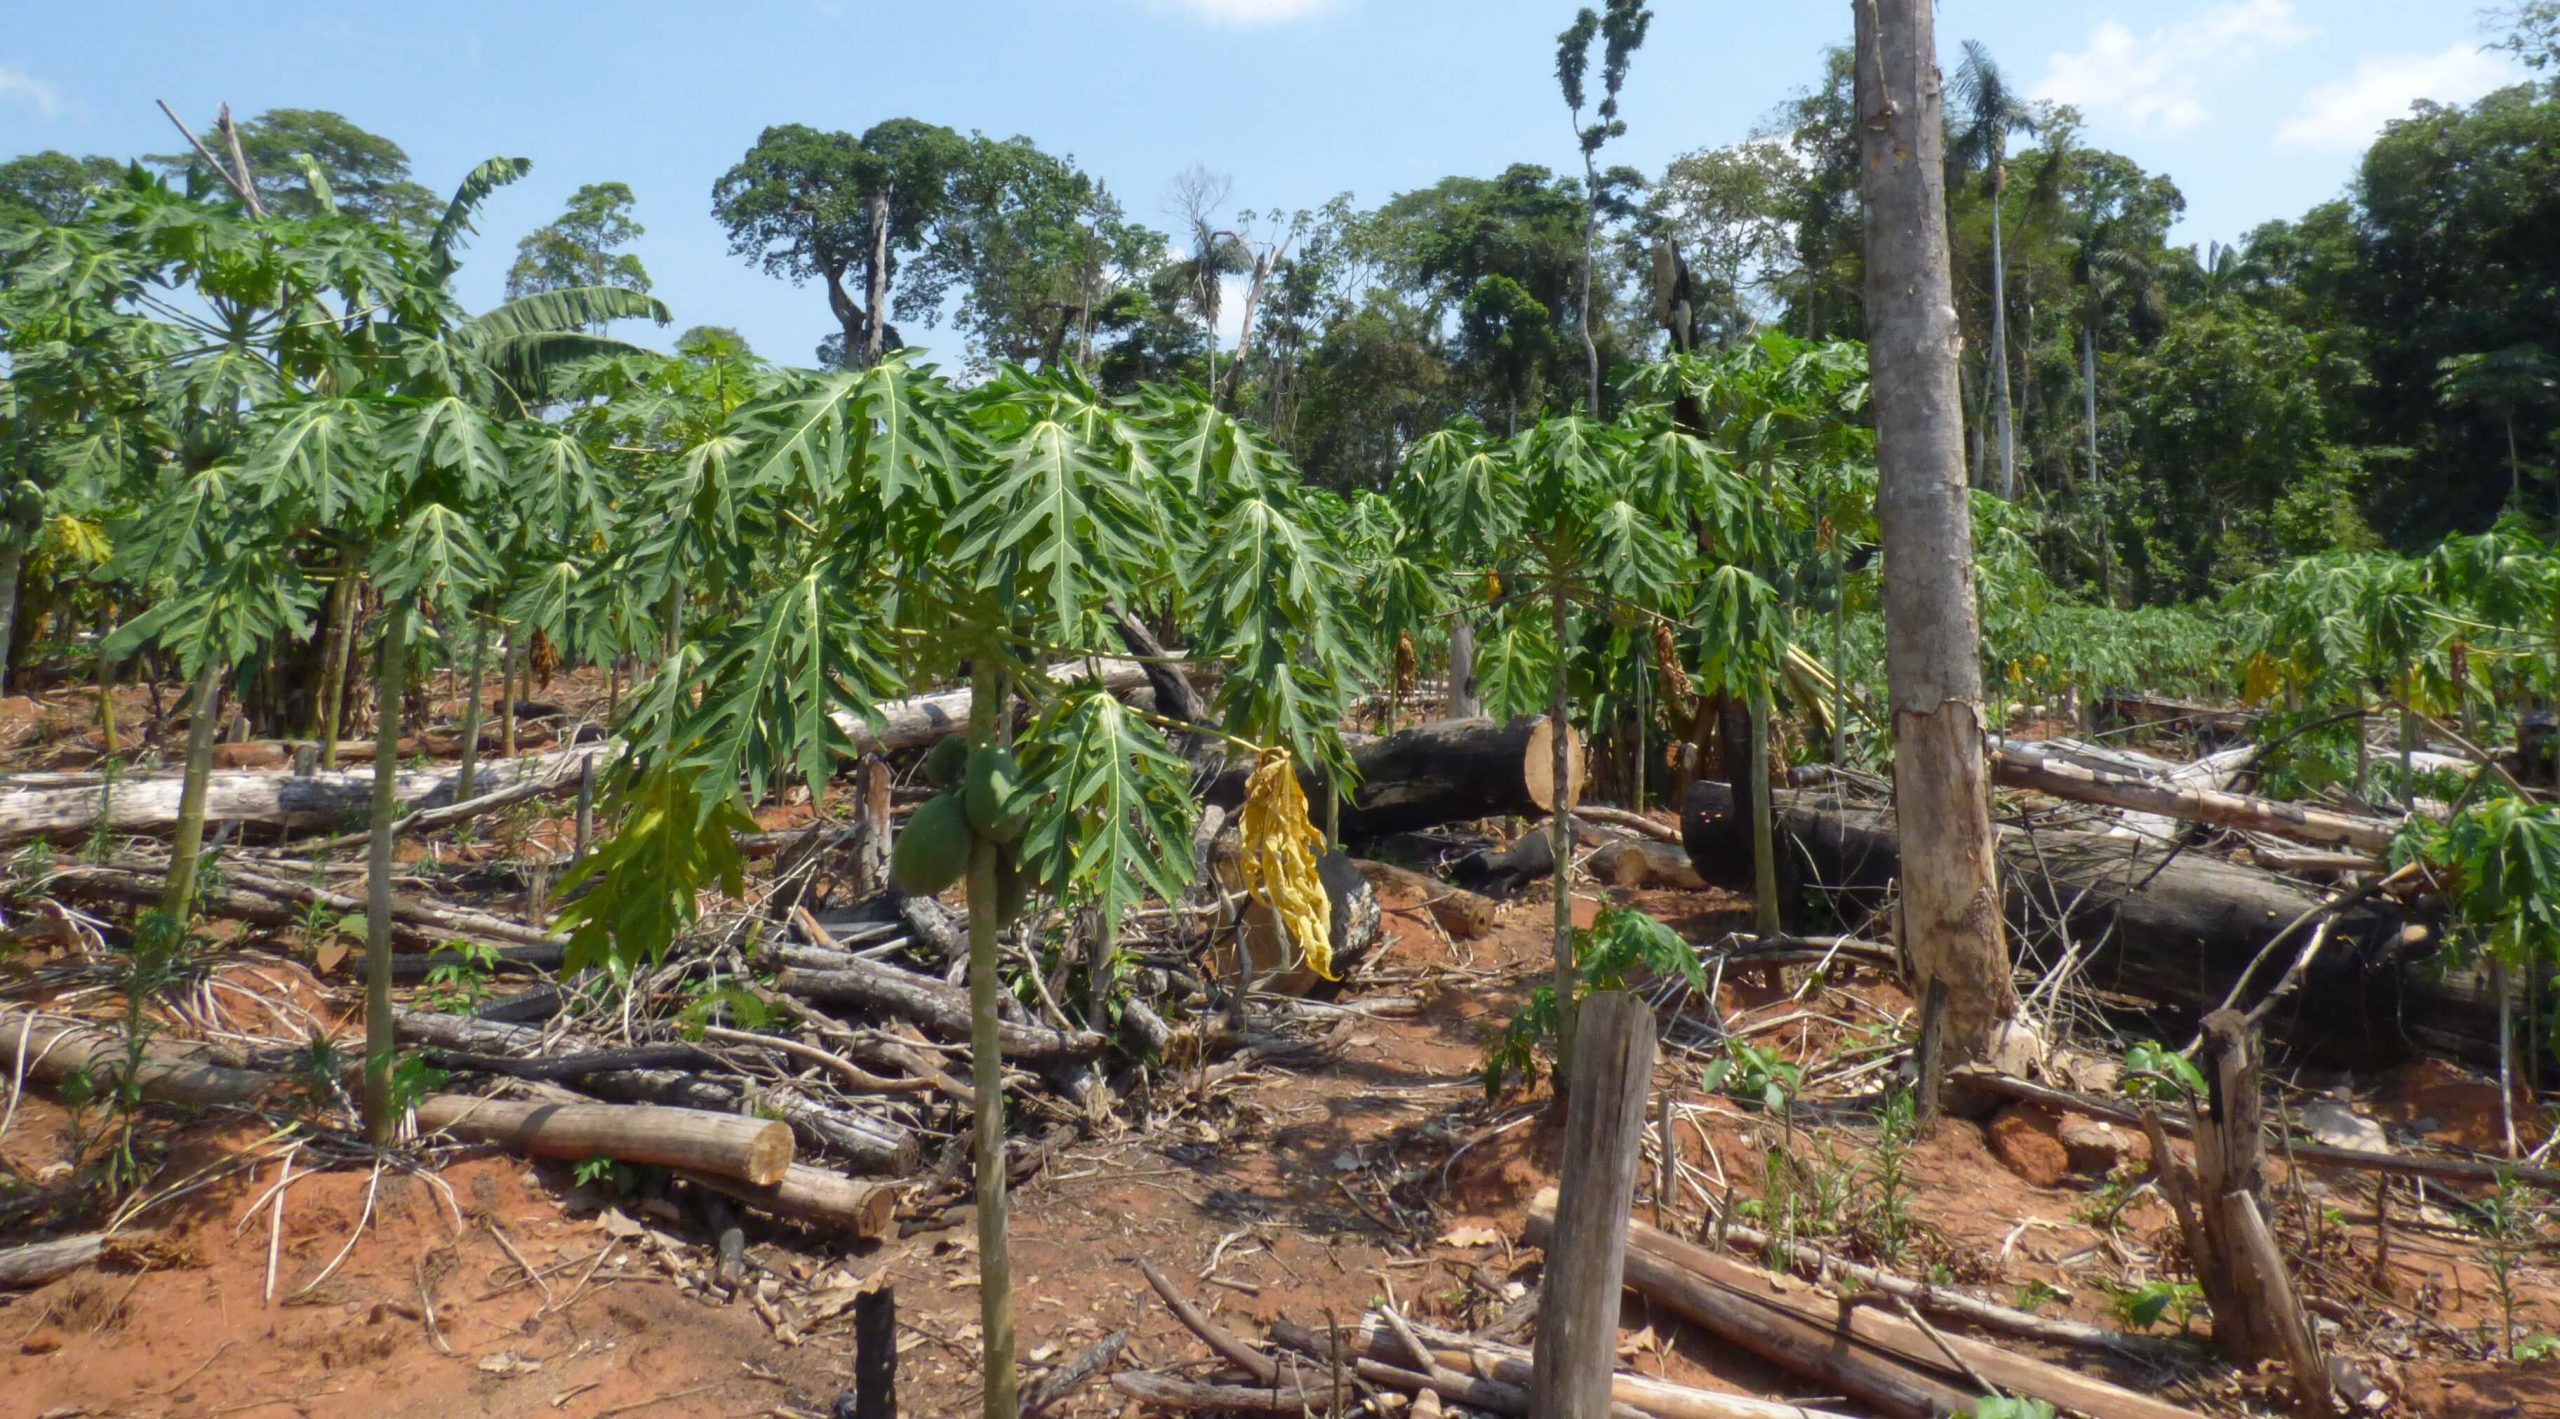
Image 42i. Photo: MINAM/DGOT, Terra-i
Example #5
Image 42j shows the deforestation of 9 hectares between April 2015 (left panel) and May 2016 (right panel). The yellow boxes indicate the same place in both images. Image 42k is a photo of the new papaya plantation in this area.
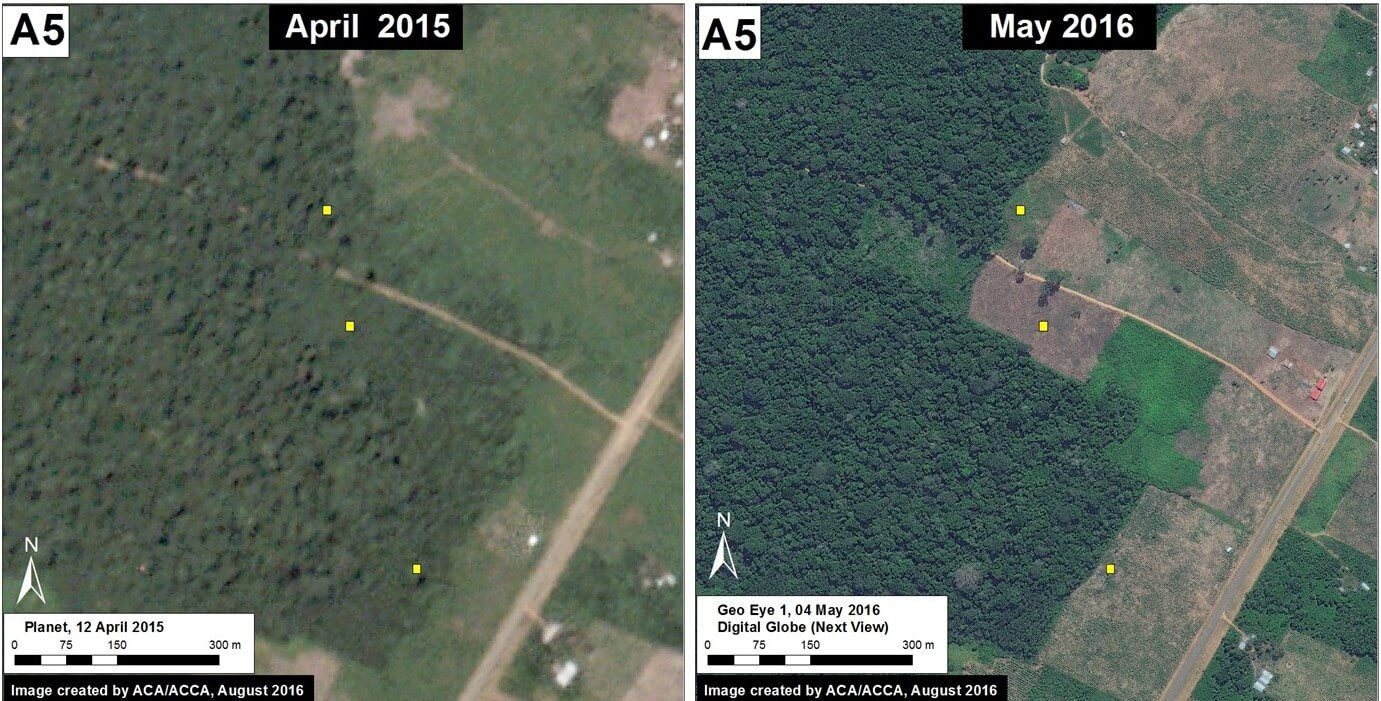
Image 42j. MINAM/DGOT, Terra-i
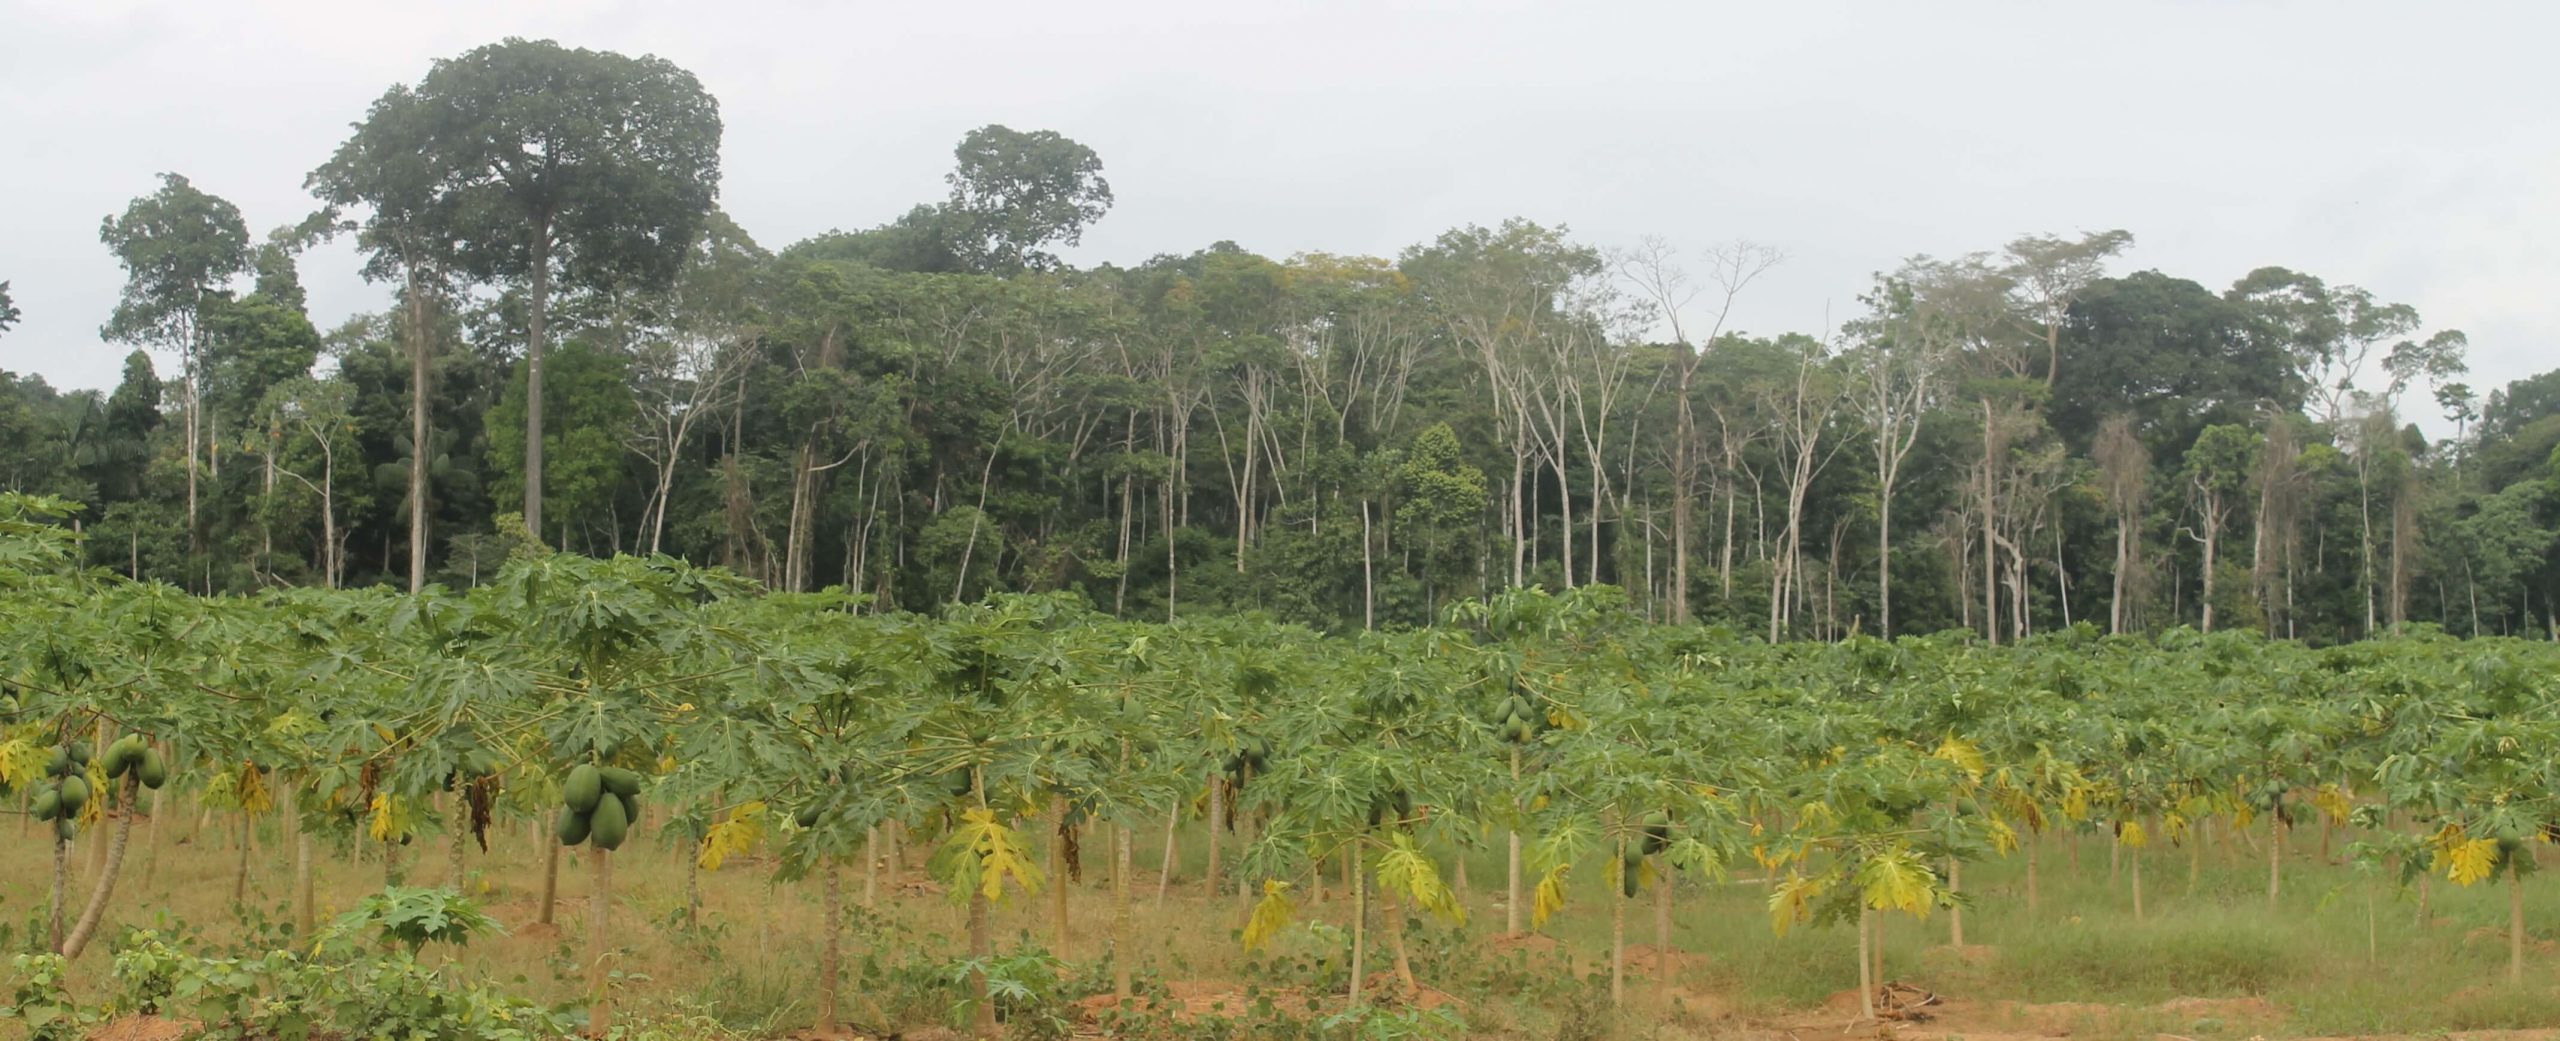
Image 42k. Photo: Farah Carrasco
Citation
Finer M, Novoa S, Carrasco F (2016) Papaya – Potential New Driver of Deforestation in Madre de Dios. MAAP: 42.
 Loading...