Thanks to the support of the USAID, via the Prevent Project, dedicated to the prevention and combat of environmental crimes in the Amazon, we conducted a detailed analysis of recent illegal gold mining deforestation in the southern Peruvian Amazon.
The objective is to understand the trends from early 2017 to June 2020 (which includes the first part of the mandatory quarantine issued by the Peruvian government as of March 16, 2020 due to the coronavirus pandemic).
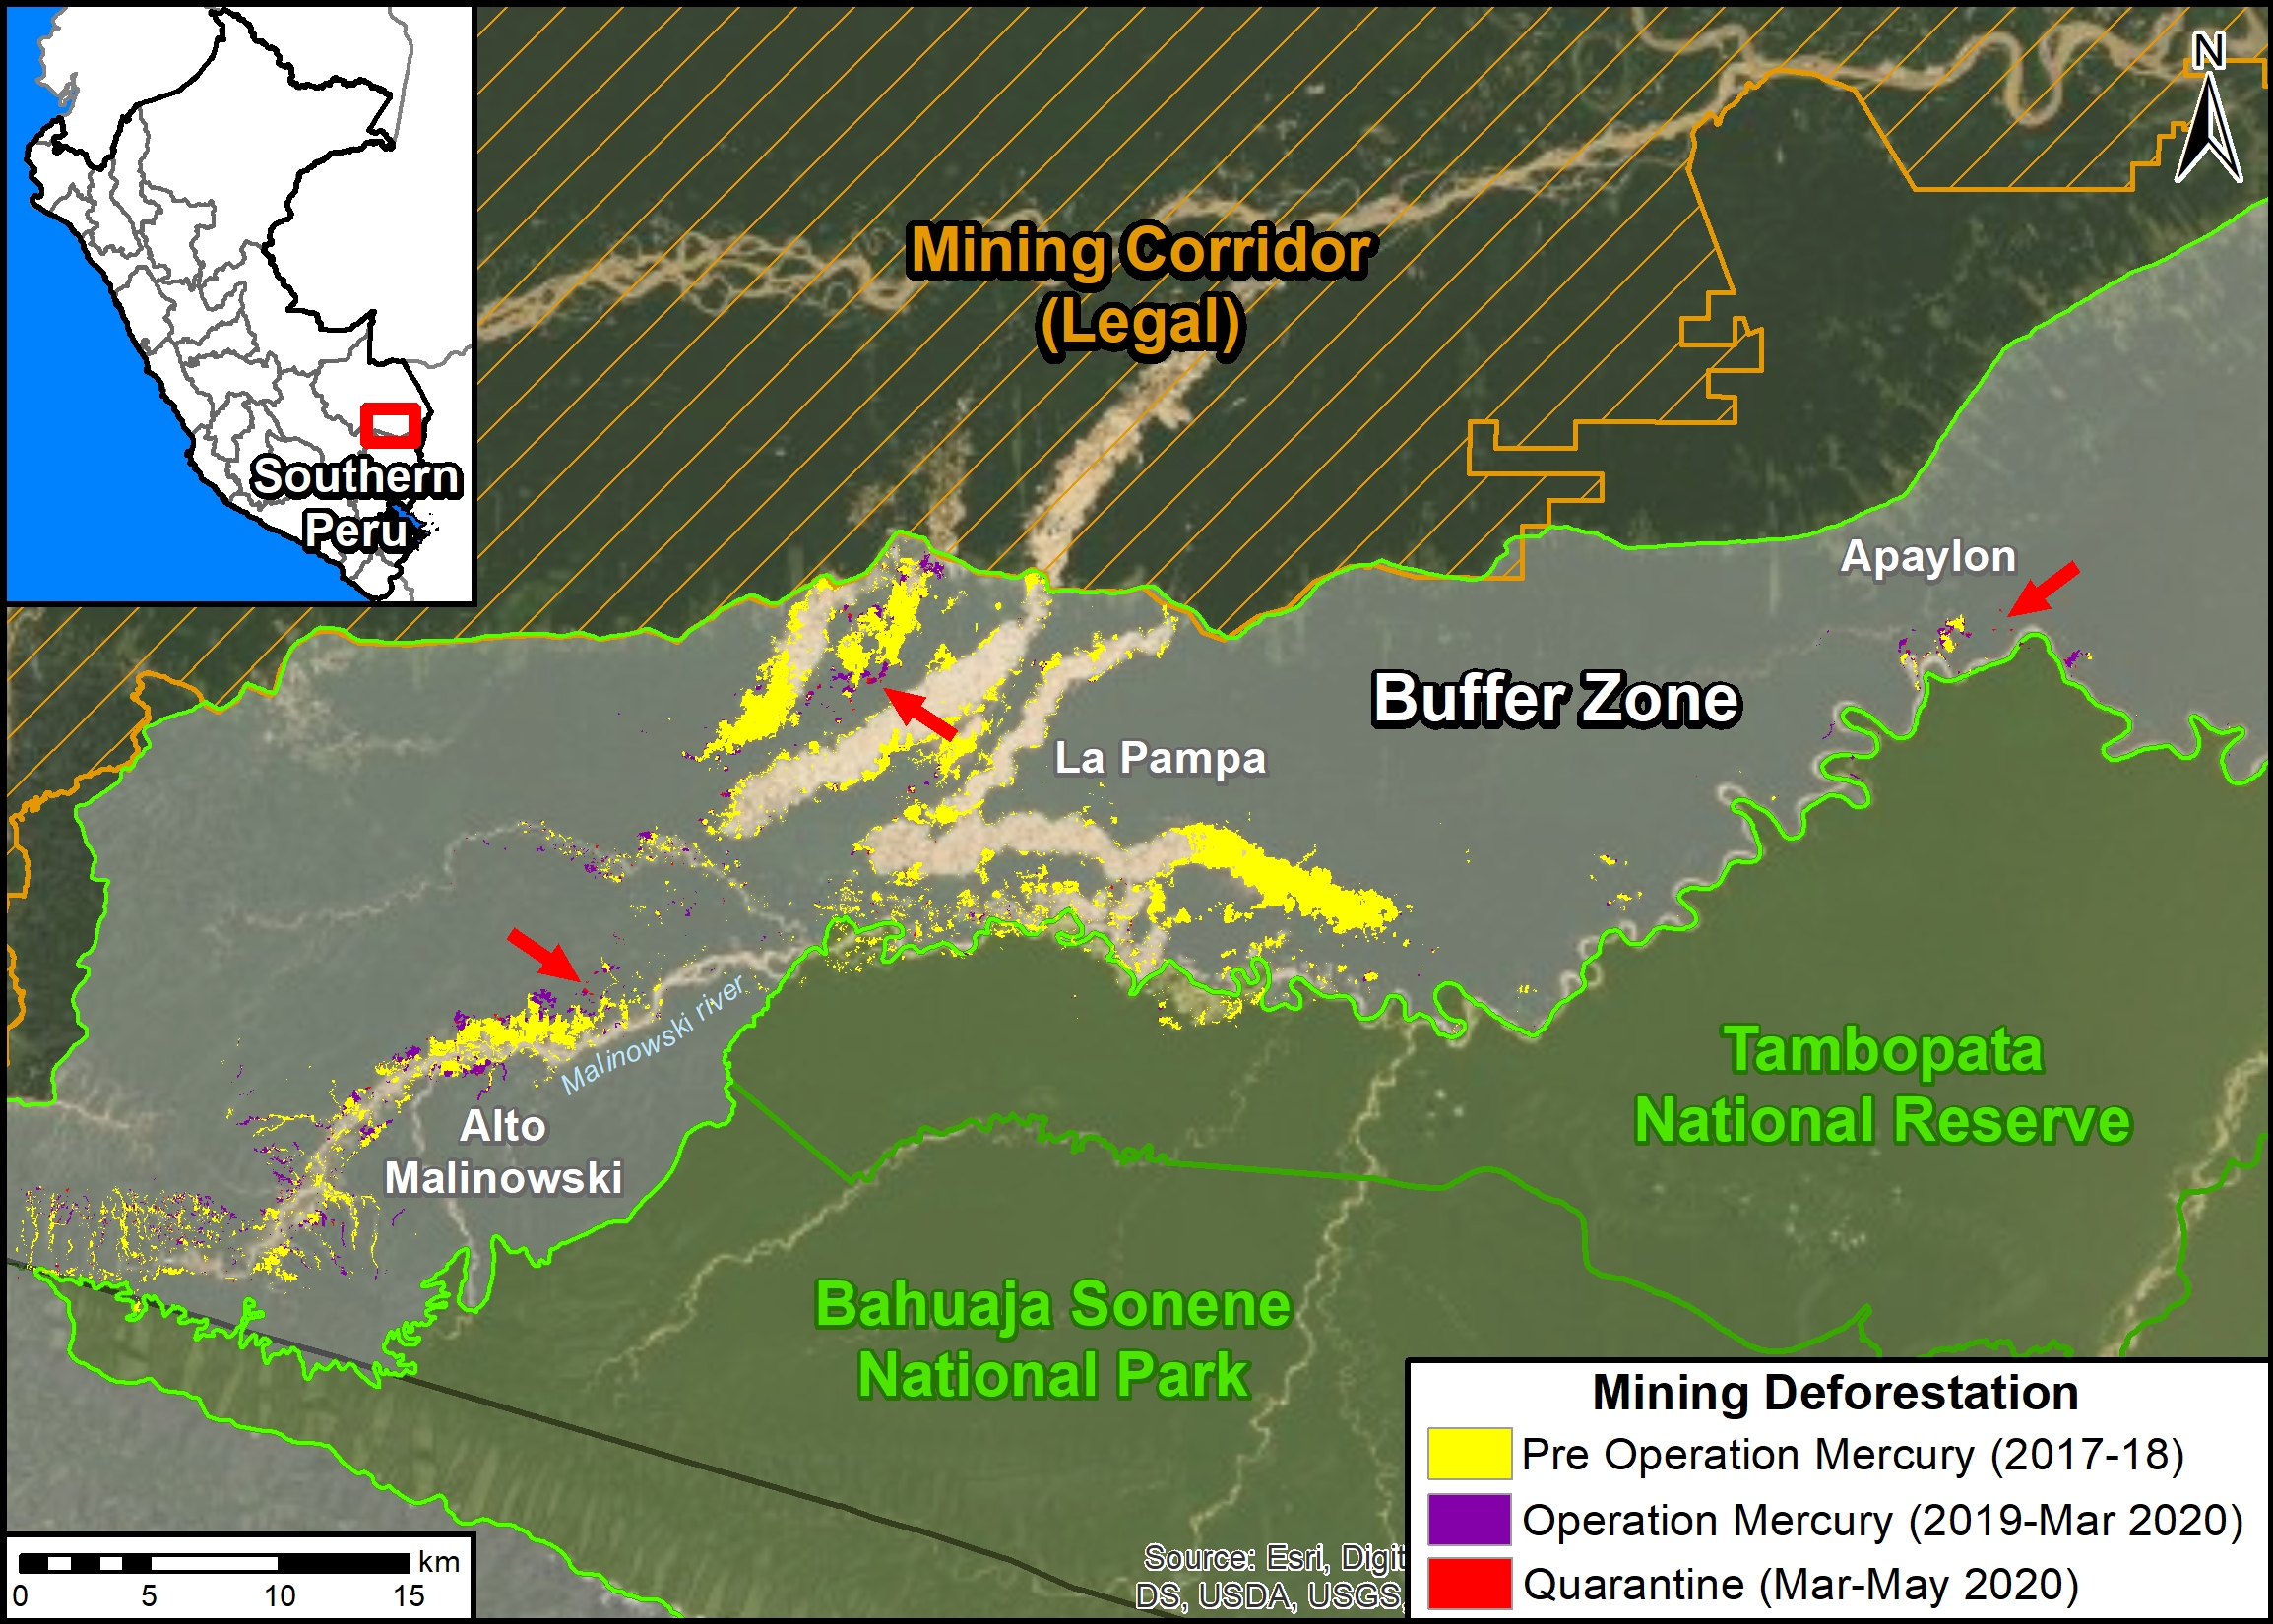
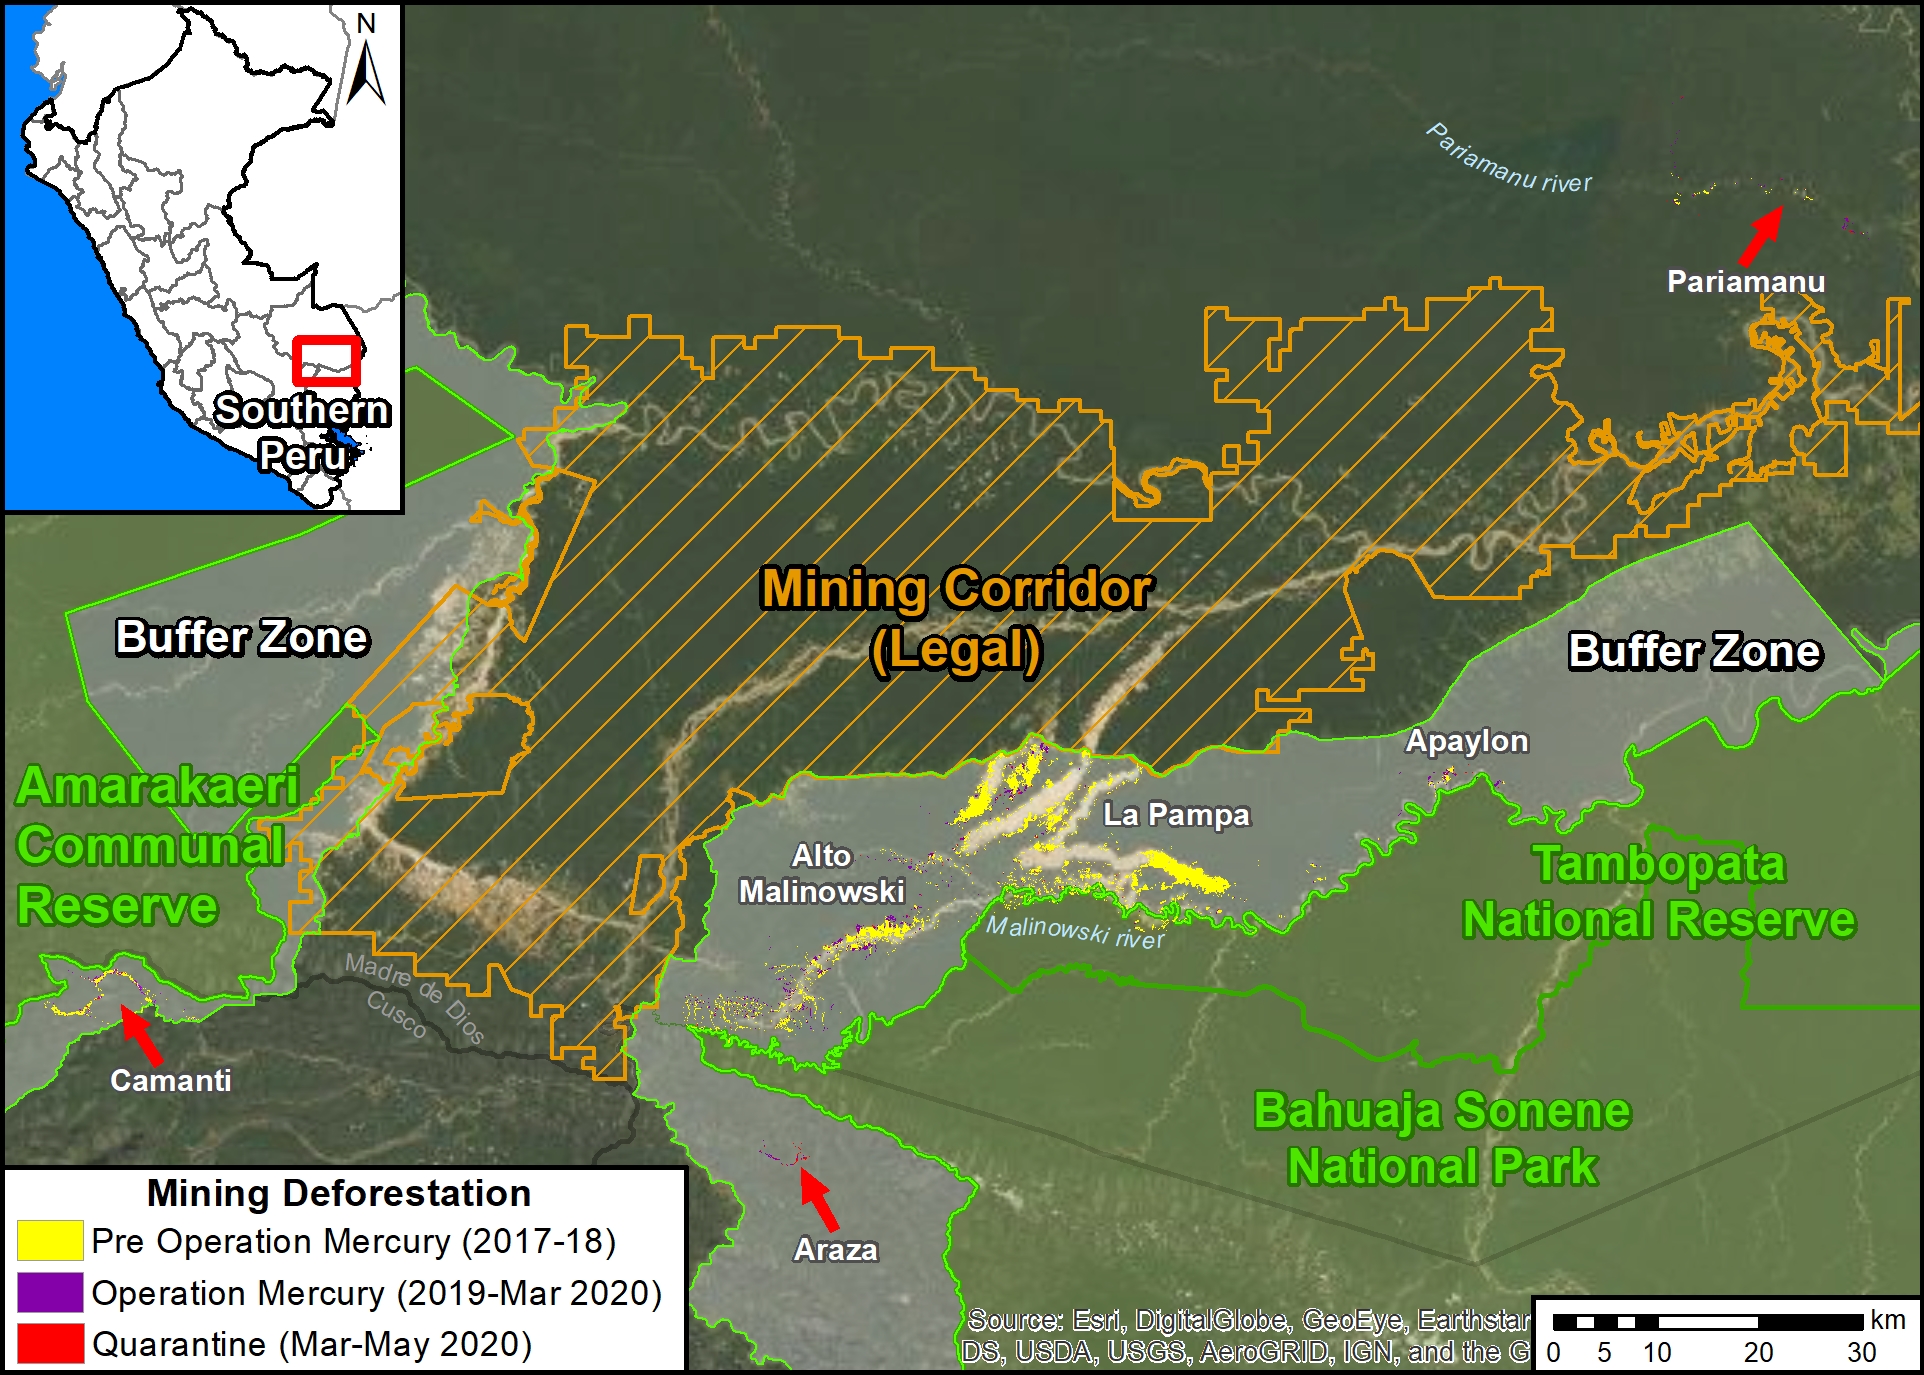
We focus on the buffer zones of two protected areas in the Madre de Dios region: Tambopata National Reserve and Bahuaja Sonene National Park (see Base Map).*
This area includes La Pampa, the current highest intensity illegal mining zone in the country. In February 2019, the Peruvian government launched Operation Mercury to confront the illegality in La Pampa and surrounding areas.
The Base Map shows that gold mining deforestation in La Pampa decreased over 90% following Operation Mercury.
However, illegal gold mining does continue after Operation Mercury (including during the coronavirus state of emergency), but at lower rates. Thus, current snapshots may be misleading and recent context is important.
On the Base Map, the red arrows indicate the areas with the most recent illegal activity (click the image to enlarge). See below for more details.
Main Results
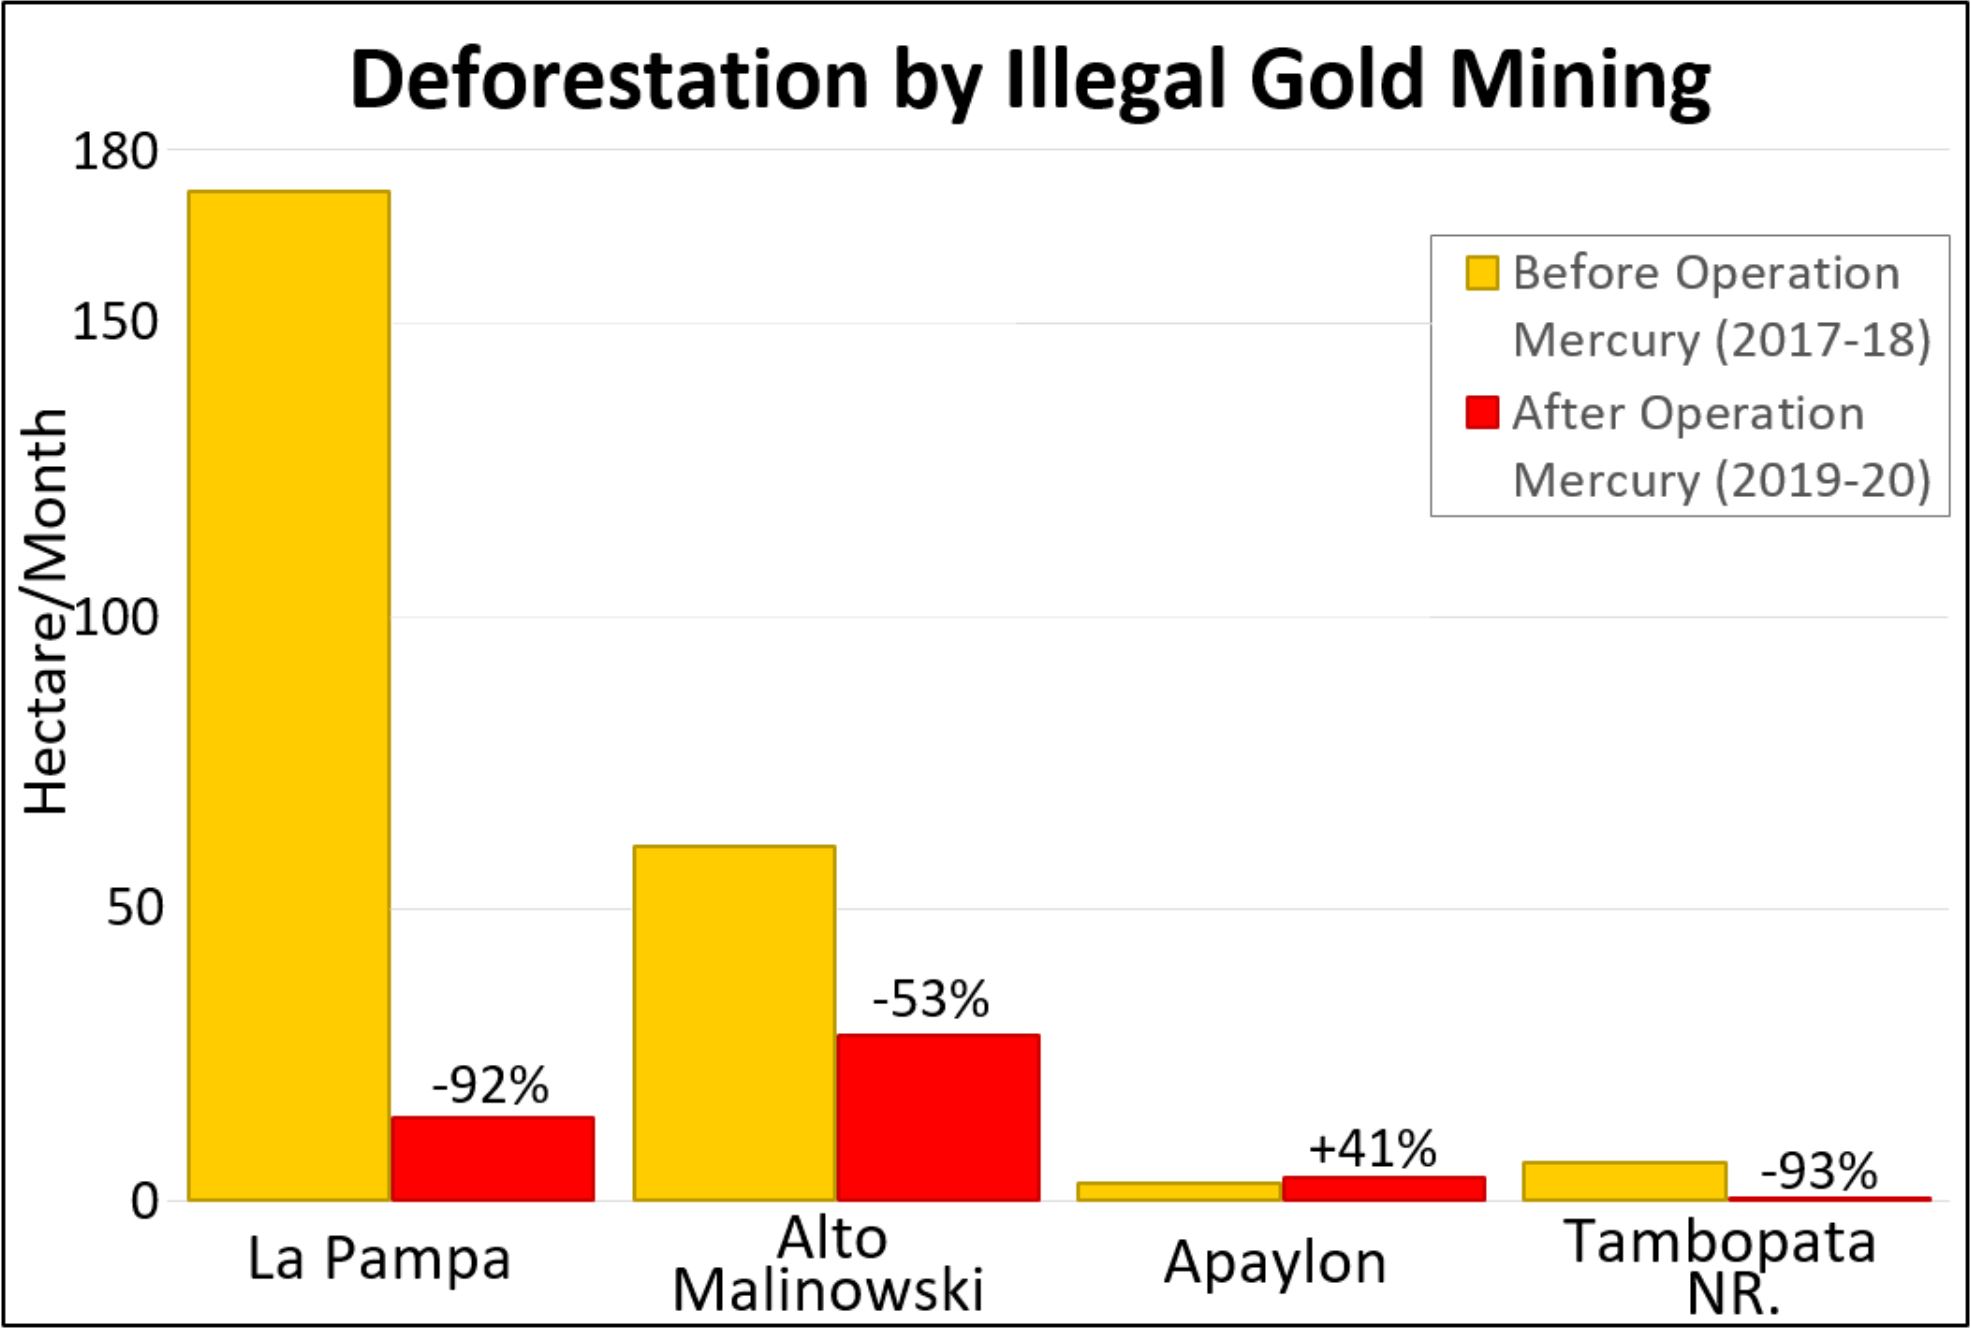
The Base Map and Table 1 illustrate the following key results:
- In La Pampa, we documented mining deforestation of 173 hectares (428 acres) per month before Operation Mercury (January 2018 – February 2019). After the intervention, deforestation was reduced to 14 hectares (36 acres) per month (March 2019 – May 2020), a decrease of 92%.
. - Upstream, in the Alto Malinowski, we documented the mining deforestation of 61 hectares (150 acres) per month before Operation Mercury. After the intervention, deforestation was reduced to 28 hectares (69 acres) per month, a decrease of 53%.
. - Downstream, in the Apaylon area, we documented the mining deforestation of 2.9 hectares (7 acres) per month, before Operation Mercury. After the intervention, deforestation increased to 4 hectares (10 acres) per month, an increase of 41%. Apaylon is main area in the buffer zone where deforestation has increased.
. - Within Tambopata National Reserve, we documented the mining deforestation of 6.5 hectares (16 acres) per month, before Operation Mercury. After the intervention, deforestation was reduced to 0.5 hectares (1.2 acres) per month, a decrease of 93%.
. - Overall, illegal gold mining does continue in the buffer zones of Madre de Dios, but at lower rates than the previous two years. We documented the gold mining deforestation of 797 hectares (1,670 acres) after Operation Mercury.
. - Regarding the speculation that illegal activity would increase during the coronavirus pandemic, we have not documented any major increase or surge in the buffer zones of Madre de Dios.* Illegal mining does continue, however, we documented the deforestation of 80 hectares (198 acres) during the quarantine.
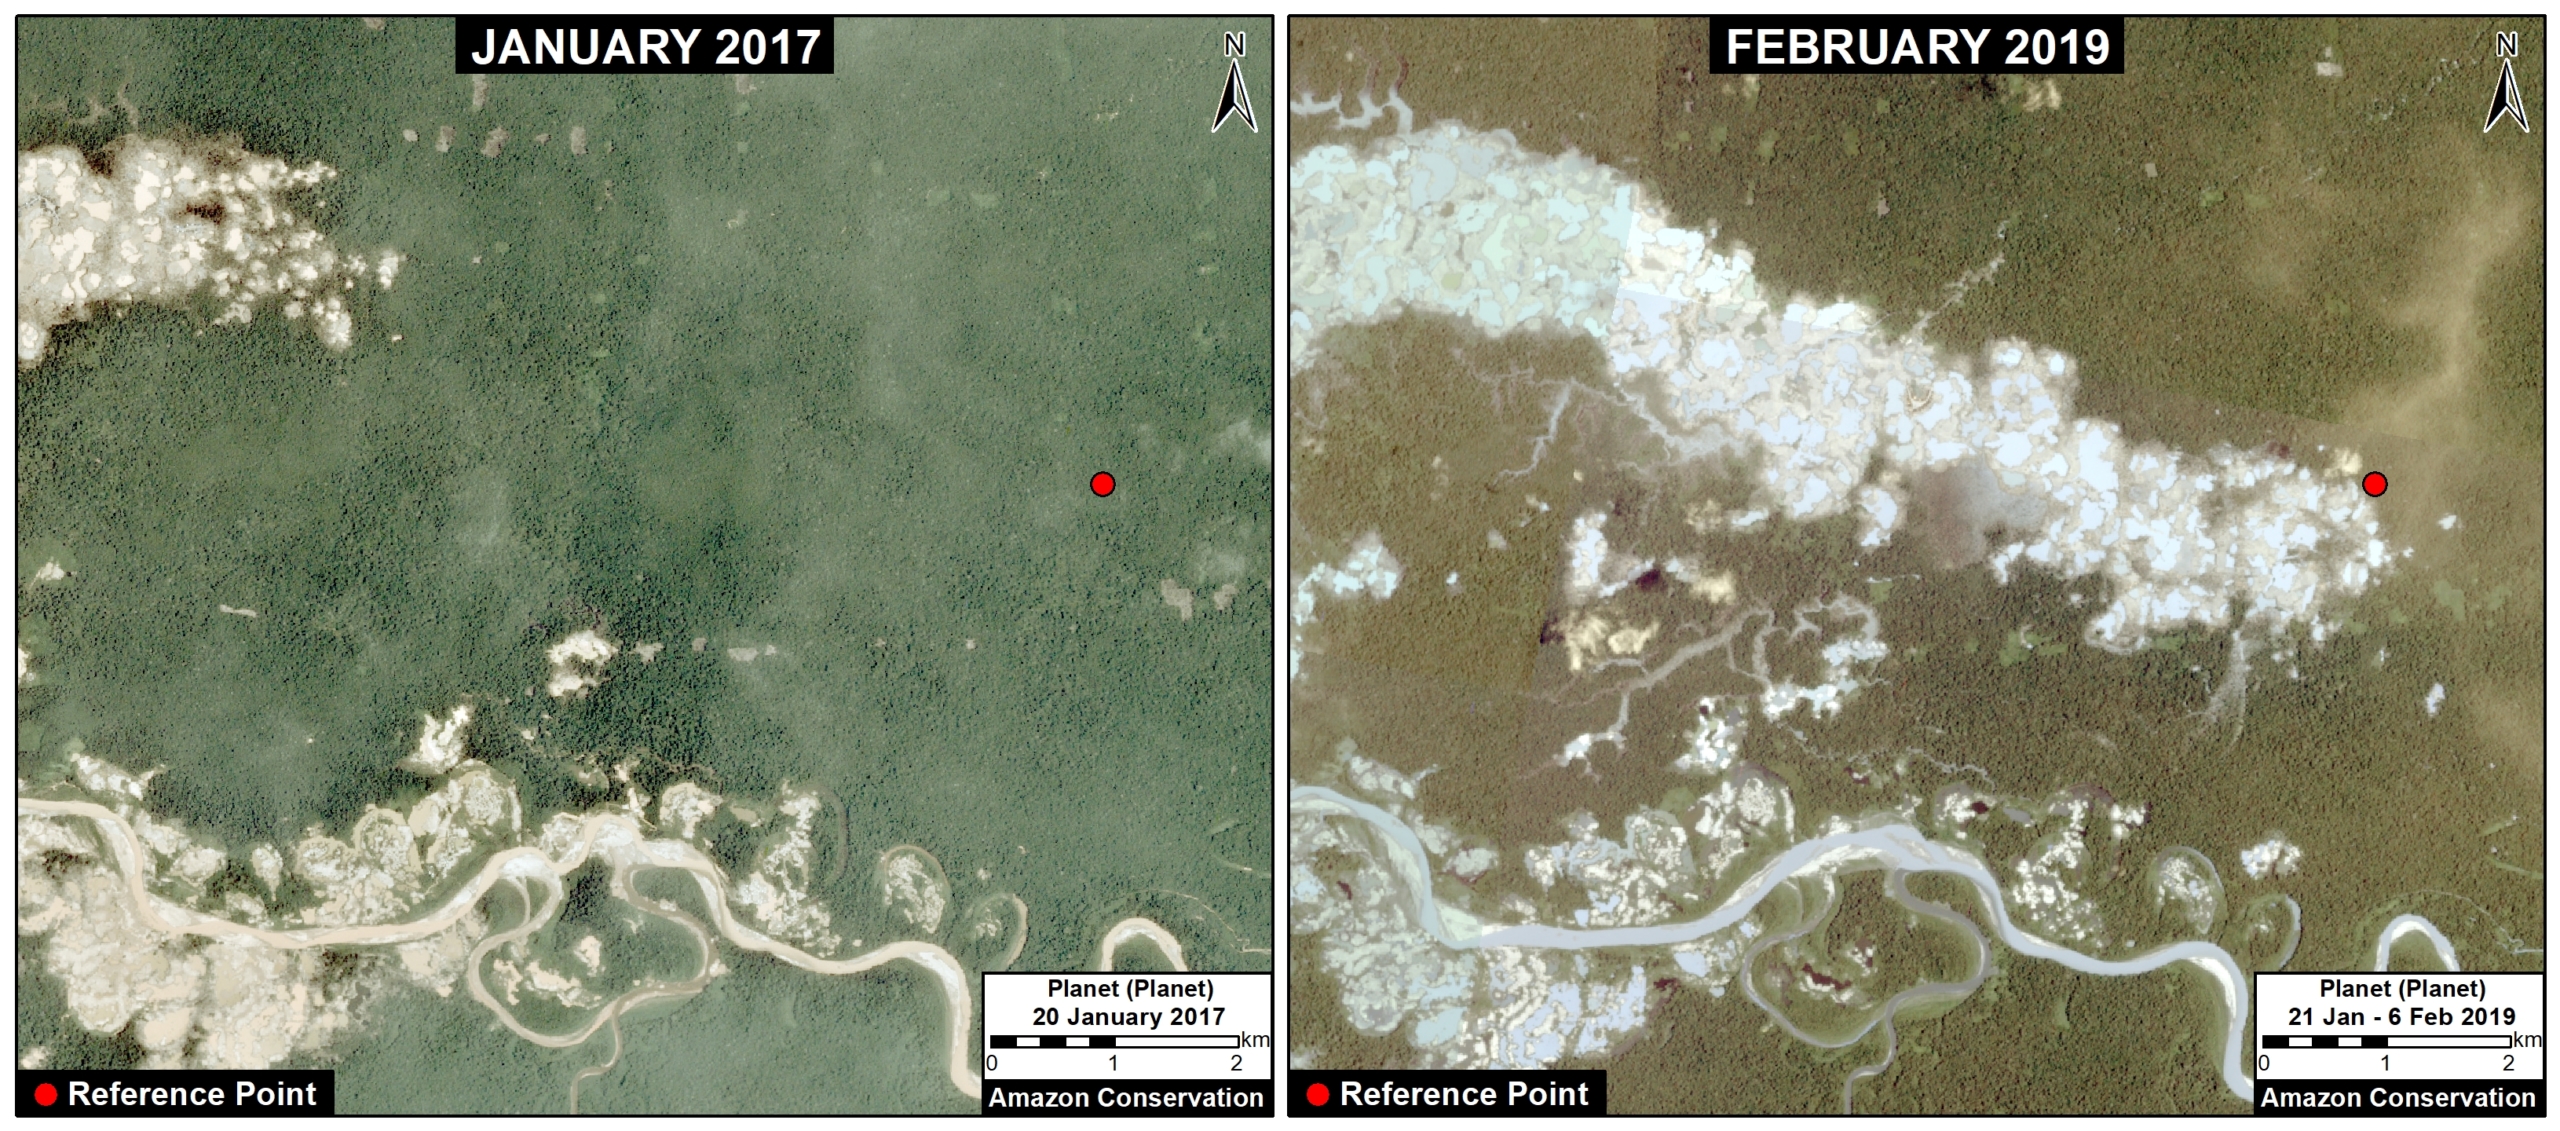
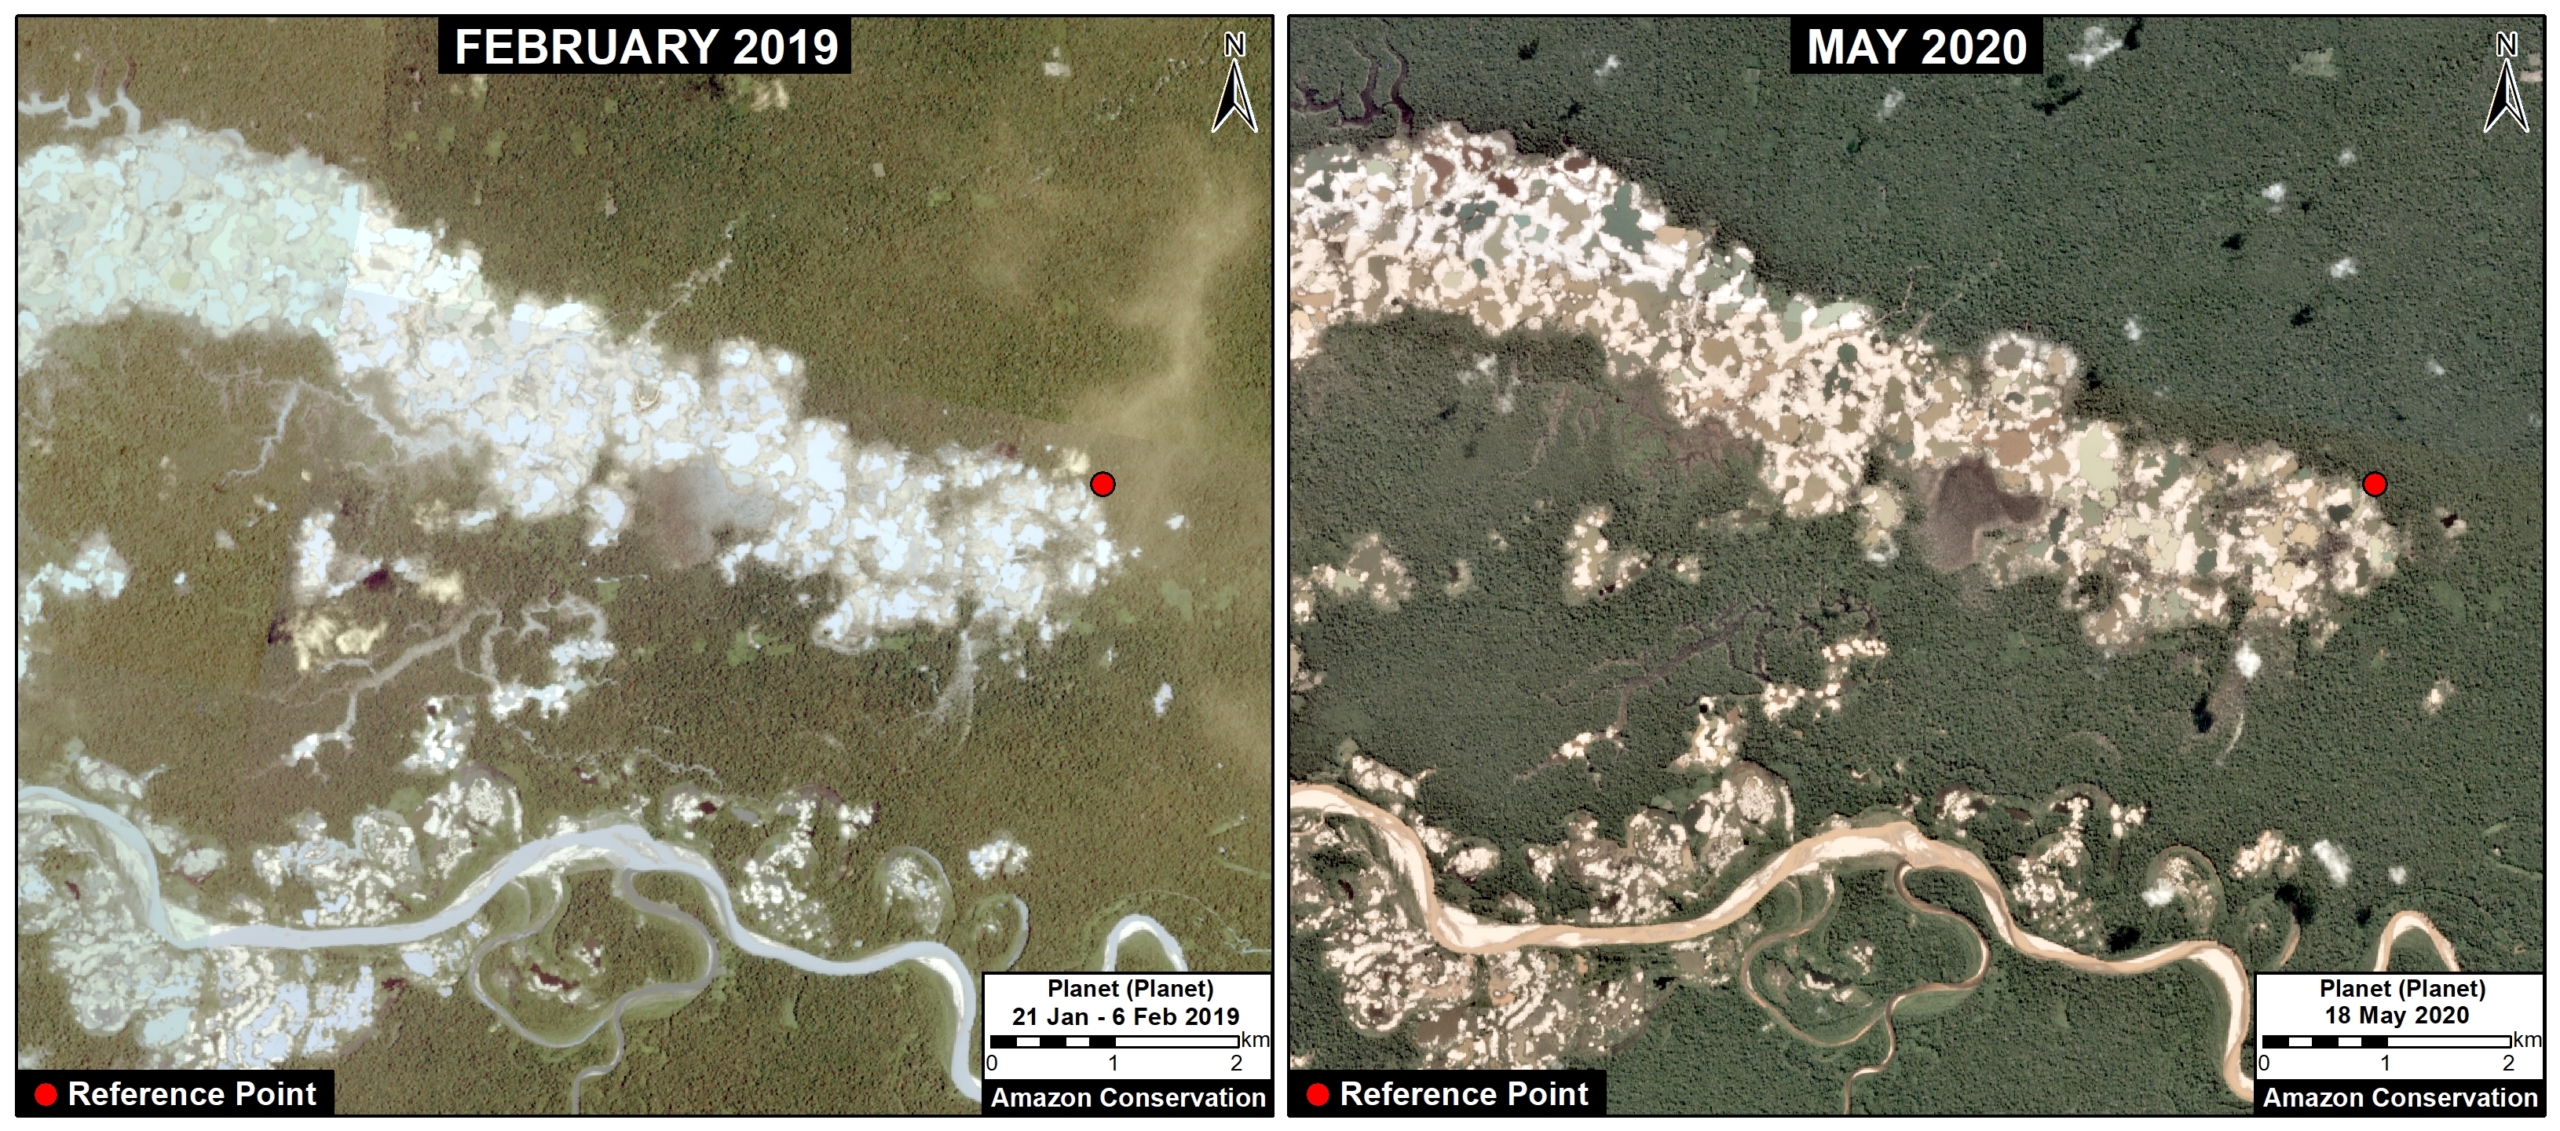
Reduction of 90% in La Pampa
The following images show the major decrease in gold mining deforestation in La Pampa after Operation Mercury. Image 1 shows the rapid deforestation before Operation Mercury, between January 2017 (left panel) and February 2019 (right panel). Image 2 shows how the deforestation decreased after Operation Mercury, between February 2019 (left panel) and May 2020 (right panel). The red dot represents a reference point between the images.
Displaced Miners?
There has also been speculation that the focus of Operation Mercury in La Pampa would lead to illegal miners moving to other areas.* Base Map 2 shows two of the most threatened areas: Camanti and Pariamanu.
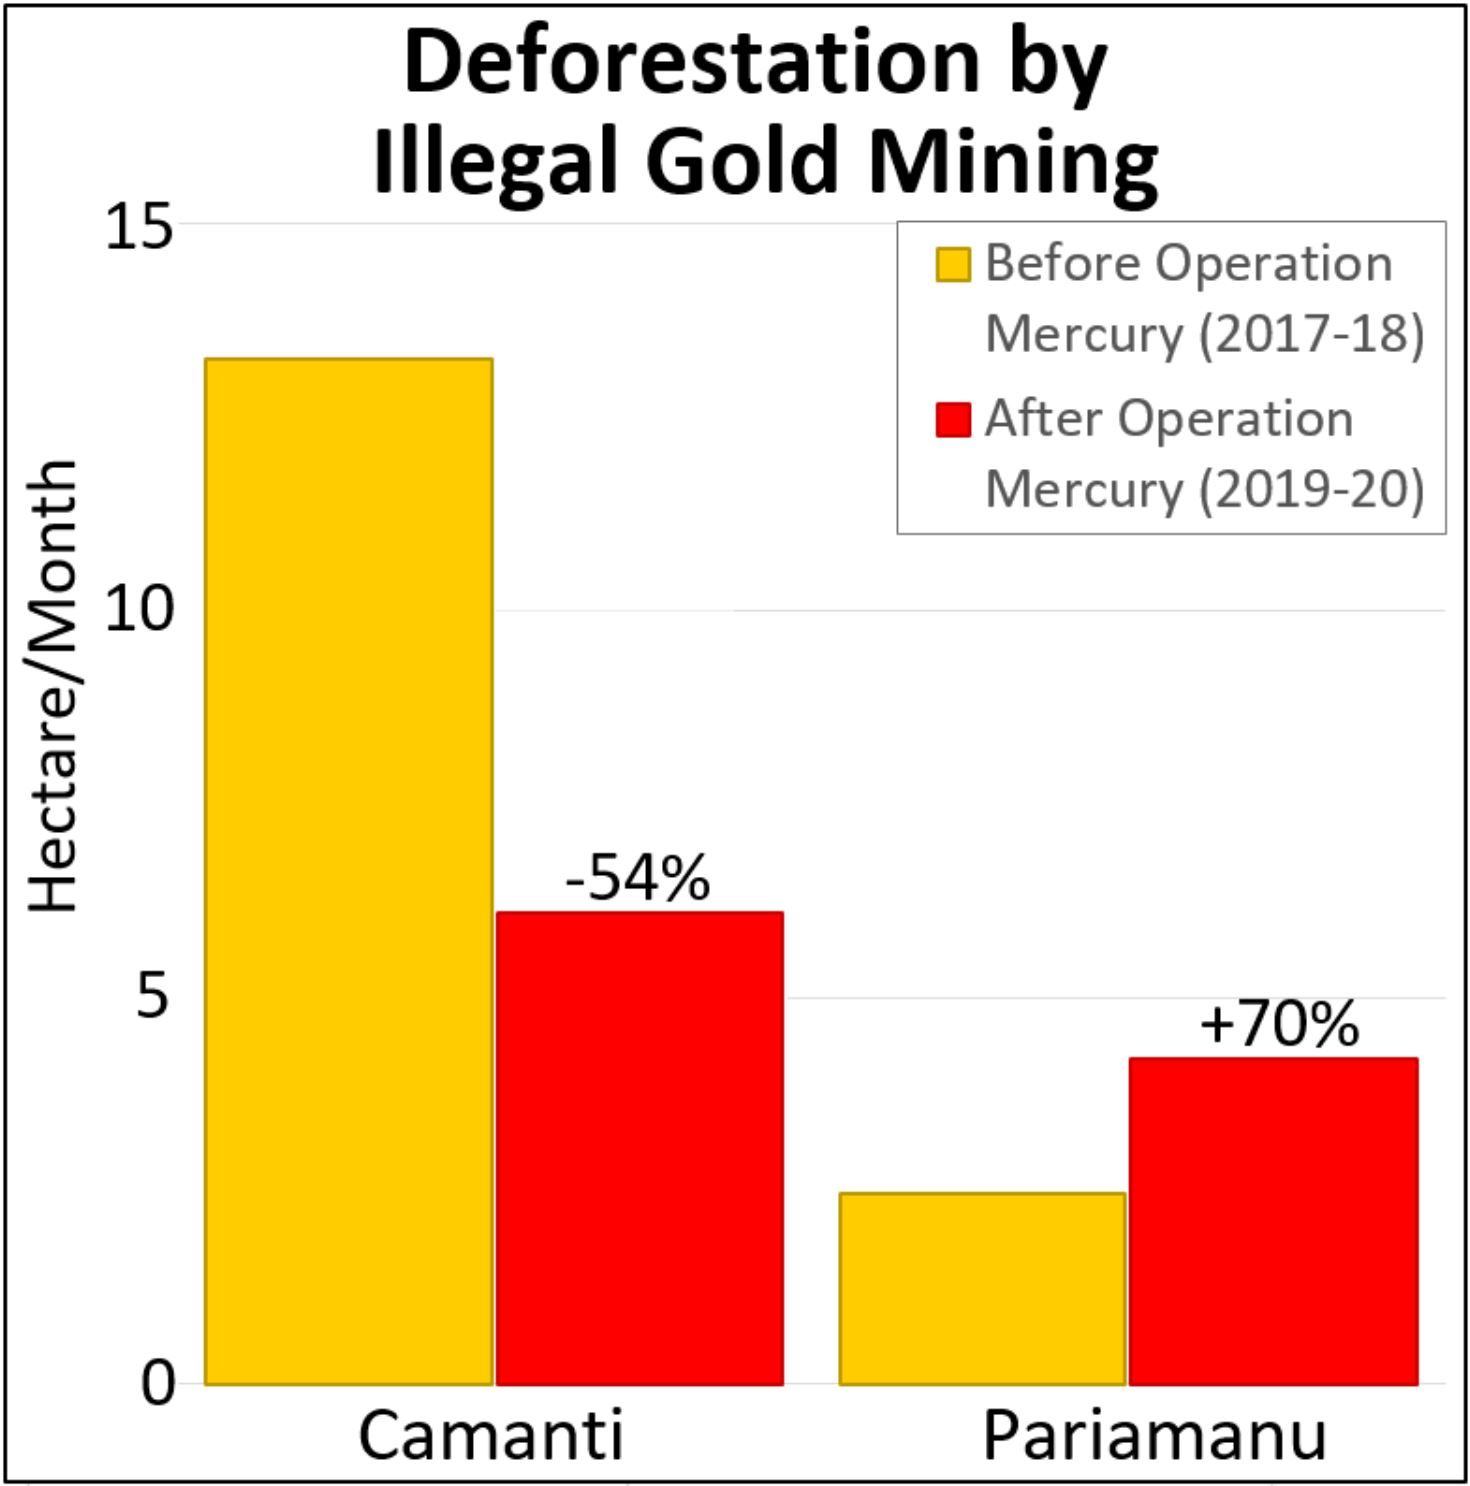
These are the main results for these two areas:
- In Camanti (located in the buffer zone of Amarakaeri Communal Reserve), we documented the gold mining deforestation of 13.3 hectares (33 acres) per month before Operation Mercury. After the intervention, deforestation was reduced to 6.1 hectares (15 acres) per month, a decrease of 54%.
. - In Pariamanu, we documented the mining deforestation of 2.5 hectares (6 acres) per month before Operation Mercury. After the intervention, it increased to 4.2 hectares (10 acres) per month, an increase of 70%.
- In summary, illegal gold mining continues in these two areas outside La Pampa. We documented the mining deforestation of 175 hectares (432 acres) after Operation Mercury (including 22 hectares during the pandemic). There is some evidence that miners are being displaced to Pariamanu, but there has not been a surge in Camanti.
Statement of the Peruvian Protected Area Agency (SERNANP)
El Servicio Nacional de Áreas Naturales Protegidas por el Estado (SERNANP) nos ha comunicado lo siguiente:
- La actividad de control y vigilancia en la Reserva Nacional Tambopata es permanente y las autoridades (SERNANP, Policía Nacional del Perú, Fiscalías Especializadas en Materia Ambiental, y Marina de Guerra del Perú) continúan interviniendo a todas las actividades de minería ilegal, manteniendo el 100%.
- Las zonas de amortiguamiento son espacios que están sujetos a la intervención de las autoridades de la Operación Mercurio (no del SERNANP). Se han realizado intervenciones continuas e interdicciones tanto en las zonas indicadas en el reporte, como en Apaylon y Camanti.
, - Cabe mencionar que la Operación Mercurio, durante el 2019 y sobre todo en el 2020 (Incluyendo el período de cuarentena) ha ampliado sus operativos mas allá de la Pampa, lo cual explica porque en Camanti las cifras también se ha reducido. En el segundo semestre de 2020 y en el 2021, se espera que los operativos es amplíen a otras zonas de Madre de Dios.
*Notes
- The area referred to as the “mining corridor” (see Base Map) is not included in the analysis.
. - Mining deforestation rates (hectares per month) during the coronavirus pandemic state of emergency (starting mid-March): La Pampa 16.3, Alto Malinowski 11.7, Apaylon 3.5, Tambopata National Reserve 0.4, Camanti 3.8, Pariamanu 4.7.
. - Speculation in the media:
Mineros de La Pampa amenazan la Reserva Comunal Amarakaeri
Incremento de minería ilegal durante la cuarentena
Acknowledgments
We thank R. Segura, M. Castro, E. Ortiz, M. Silman, M. E. Gutierrez, S. Novoa, H. Balbuena, M. Allemant, and G. Palacios for their helpful comments on this report.
This report was conducted with technical assistance from USAID, via the Prevent project. Prevent is an initiative that, over the next 5 years, will work with the Government of Peru, civil society, and the private sector to prevent and combat environmental crimes in Loreto, Ucayali and Madre de Dios, in order to conserve the Peruvian Amazon.
This publication is made possible with the support of the American people through USAID. Its content is the sole responsibility of the authors and does not necessarily reflect the views of USAID or the US government.

Citation
Finer M, Mamani N (2020) Reduction of Illegal Gold Mining in the Peruvian Amazon. MAAP:


 Loading...