Recap of This Year’s AmazonTEC

Each year, Amazon Conservation, along with our Peruvian partners, Conservación Amazónica – ACCA, hold an important webinar series entitled AmazonTEC. AmazonTEC is an international platform to present successful experiences on the application of science and technology for a sustainable Amazon. It is the space that brings together innovators, regulators, and friends of the forest, to assess the needs of the Amazon, the progress and pending efforts in terms of data, information, science, technology, and innovation, in order to make urgent decisions for the protection and sustainability of the Amazon.

The 2022 edition of AmazonTEC was comprised of 3 sessions (one virtual, one live, and one in hybrid format) featuring biologists, conservationists, ecologists, government entities, and more representing 5 countries and bringing expertise from a multitude of diverse backgrounds and experiences.  This year, attendees were treated to presentations from scientists working with NASA, GIS specialists from various North American universities and Peruvian organizations, officials from USAID, and many others.

By joining and presenting a diverse array of scientists, conservationists, and advocates for the environment, AmazonTEC brings together minds from all over the world who are committed to protecting the greatest forest on Earth by utilizing cutting-edge technologies and perspectives informed by decades of research and experience.

Recordings of this year’s sessions can be found at the link below.


MAAP #166 Mennonites have Deforested 4,800 hectares (11,900 acres) in the Peruvian Amazon

Since 2017, the Mennonites have arrived in the Peruvian Amazon and created 5 new colonies.

Here, in MAAP #166, we show that these colonies have caused the deforestation of more than 4,800 hectares of tropical forests, including 650 hectares in 2022.

First, we present an updated Base Map that shows the current situation of Mennonites in Peru.

Base Map. Mennonite colonies in the Peruvian Amazon

Next, we detail the deforestation history in each colony since 2017, with an emphasis on the most recent loss in 2022.

We emphasize that the most urgent current situation is developing in the Padre Marquez colony, located on both sides of the border between the regions of Ucayali and Loreto. It is the newest colony, with the deforestation of 976 hectares since its creation in 2021 (including a large expansion of 491 hectares in the current year 2022).

We also highlight the massive deforestation of 2,884 hectares in the three colonies (Vanderland, Osterreich and Belize) near the town of Tierra Blanca in the Loreto region. These colonies are also expanding in 2022.

The Masisea colony, located south of the city of Pucallpa (Ucayali region), has caused the deforestation of 960 hectares.

In total, we documented the deforestation of 4,819 hectares in the five new Mennonite colonies in the Peruvian Amazon since 2017, including active expansion at the present time in 2022

In the more detailed report we track the deforestation history in each colony since 2017, with an emphasis on the most recent loss in 2022.

Follow the link below to read the full report.


MAAP #164 Tipping Point

Base Map. Total Amazon forest loss. Data: ACA/MAAP.

It is increasingly reported that the largest rainforest in the world, the Amazon, is rapidly approaching a tipping point.

As repeatedly highlighted by the late Tom Lovejoy (see Acknowledgements in full report), this tipping point is where parts of the rainforest will convert into drier ecosystems due to disrupted precipitation patterns and more intense dry seasons, both exacerbated by deforestation.

The Amazon generates much of its own rainfall by recycling water as air passes from its major source in the Atlantic Ocean. Thus, high deforestation in the eastern Amazon may lead to downwind impacts in the central and western Amazon (see Background section in full report).

The scientific literature indicates this tipping point could be triggered at 25% Amazon forest loss, in conjunction with climate change impacts.

The literature, however, is less clear on the critical first part of the tipping point equation: how much of the Amazon has already been lost?

There are numerous estimates, including 14% forest loss cited in the recent Science Panel for the Amazon report, but we did not find any actual definitive studies specifically addressing this question.

Here, we directly tackle this key question of how much of the original Amazon has been lost to date.

First, we present the first known rigorous estimate of original Amazon biome forest prior to European colonization: over 647 million hectares (1.6 billion acres; see Image 1 below).

Second, we estimate the accumulated total Amazon forest loss, from the original estimate to the present: over 85 million hectares (211 million acres; see Base Map in full report).

Combining these two results, we estimate that 13% of the original Amazon biome forest has been lost.

More importantly, however, focusing on just the eastern third of the Amazon biome, we estimate that 31% of the original forest has been lost, above the speculated tipping point threshold. This finding is critical because the tipping point will likely be triggered in the eastern Amazon, as it is closest to the oceanic source of the water that then flows to the central and western Amazon.

Original Amazon Forest

Image 1 shows the first known estimate of original Amazon forest prior to European colonization. Note that we use a broader biogeographical definition of the Amazon that covers nine countries (the Amazon biome) rather than the strict Amazon watershed.

Image 1. Original Amazon biome forest. Data: ACA/MAAP.

This represents the most rigorous effort to date to recreate the original Amazon. For example, we attempted to recreate original forest lost to historic dam reservoirs.

The map has just three classes: Original Amazon forest, Original non-forest (such as natural savannah), and Water.

We found that the original Amazon forest covered over 647 million hectares (647,607,020 ha). This is equivalent to 1.6 billion acres.

Of this total, 61.4% occurred in Brazil, followed by Peru (12%), Colombia (7%), Venezuela (6%), and Bolivia (5%). The remaining four countries (Ecuador, Guyana, Suriname, and French Guiana) make up the final 8%.

Comparing today’s map of forest loss with the extensive recreation of the original Amazon biome paints an impactful picture of the history and current trajectory of deforestation on a grand scale.

Follow the link below to read the full report.


MAAP #138: As Brazil Negotiates With World, Amazon Deforestation Continues In 2021

Expanding new 2021 deforestation in the Brazilian Amazon (Mato Grosso). Data: Planet. Click to enlarge image.
Expanding new 2021 deforestation in the Brazilian Amazon (Mato Grosso). Data: Planet.

Brazil is currently in high-profile negotiations with countries such as the United States and Norway for international compensation in exchange for improved action to address Amazon deforestation.*

While this may be a positive development diplomatically, on the ground extensive deforestation continues.

We recently reported that, in 2020, Brazil had the sixth-highest primary forest loss on record (1.5 million hectares) and a 13% increase from 2019 (MAAP #136).

Here we present a first look at 2021 Brazilian Amazon deforestation.

This early analysis is important because a) it provides real-time context for the negotiations, and b) these are the first areas that are likely to be burned in the upcoming fire season (see MAAP #129).

We first analyzed a new generation of early warning forest loss alerts, based on 10-meter resolution imagery (a major upgrade from the previous 30-meter alerts).* These alerts indicate the loss of over 175,000 hectares of primary forest thus far in 2021.

We then investigated the most urgent (large alert clusters) with even higher resolution (3 meters) satellite imagery from Planet.

Below, we present a series of high-resolution imagery videos showing key examples of 2021 Brazilian Amazon deforestation.


Primary forest hotspots 2021 (thru April 4). Data: UMD/GLAD, MAAP.

Forest Loss Alerts

The alerts indicate the loss of 175,330 hectares of primary forest in the Brazilian Amazon between January 1 and April 4, 2021.

The Base Map illustrates where this deforestation has been concentrated.

Note the heavy concentrations in the states of Mato Grosso, Pará, and Amazonas, followed by Rondônia and Roraima.


High-resolution Imagery Videos

Mato Grosso

Planet Link


Pará

Planet Link


Mato Grosso

Planet Link


Rondônia

Planet Link


Munduruku Indigenous Territory (Pará)

Planet Link


*Notes

For more information on the negotiations between Brazil and both the United States and Norway, see the following links:

As climate summit unfolds, no Biden-Bolsonaro Amazon deal forthcoming
Mongabay

Brazil’s Bolsonaro, under U.S. pressure, vows climate neutrality by 2050
Reuters

Joe Biden’s billions won’t stop Brazil destroying the Amazon rainforest
Guardian

Brazil demand for U.S. to pay upfront stalls deal to save Amazon forest
Reuters

Brazil needs $10 bln a year in aid for carbon neutrality by 2050, minister says
Reuters

‘Negotiating with your worst enemy’: Biden in risky talks to pay Brazil to save Amazon
Guardian

Brazil’s promises to slash forest losses ’empty’, researchers say ahead of Biden summit
Reuters

Brazil must cut deforestation 15-20% a year to reach 2030 goal, says vice president
Reuters

Norway nixes support until Brazil reduces Amazon deforestation
Business Day


*Methods

The early warning forest loss alerts used in this report are produced by the University of Maryland (GLAD).  They are the first alerts based on 10-meter resolution imagery obtained from the European Space Agency’s Sentinel-2 satellite. Previous alerts were based on 30-meter resolution imagery obtained from NASA/USGS Landsat satellites.

To identify the deforestation hotspots, we conducted a kernel density estimate. This type of analysis calculates the magnitude per unit area of a particular phenomenon, in this case forest cover loss. We conducted this analysis using the Kernel Density tool from Spatial Analyst Tool Box of ArcGIS. We used the following parameters:

Search Radius: 15000 layer units (meters)
Kernel Density Function: Quartic kernel function
Cell Size in the map: 200 x 200 meters (4 hectares)
Everything else was left to the default setting.

For the Base Map, we used the following concentration percentages: Medium: >10%; High: >15%; Very High: >25%.


Acknowledgments

We thank A. Folhadella (ACA) for their helpful comments on this report.

This work was supported by NORAD (Norwegian Agency for Development Cooperation) and ICFC (International Conservation Fund of Canada).

Citation

Finer M, Mamani N (2021) As Brazil negotiates with world, Amazon deforestation continues in 2021. MAAP: 138.

Download PDF of this article >>


MAAP #126: Drones and Legal Action in the Peruvian Amazon

ACOMAT member flying a drone for monitoring their forestry concession. Source: ACCA.

The southern Peruvian Amazon (Madre de Dios region), is threatened by illegal mining, logging, and illegal deforestation.

In response, an association of forest concessionaires (known as ACOMAT) is implementing a comprehensive monitoring system that links the use of technology (satellites and drones) with legal action.

ACOMAT was formed in 2012 and now comprises 15 forestry concessions, covering 440,000 acres (178,000 hectares) in the southern Peruvian Amazon (see Base Map). Most of the concessions are alternatives to logging, such as Brazil nuts, Conservation, and Ecotourism.

This comprehensive system has three main elements:

  1. Real-time, satellite-based forest loss monitoring (such as GLAD alerts) to quickly detect any possible new threats, even across vast and remote areas.
  2. Field patrols with drone flights to verify forest alerts (or monitor threatened areas) with very high resolution images.
  3. If suspected illegality is documented, initiate a criminal or administrative complaint, utilizing both the satellite and drone-based evidence.

In the case of ACOMAT, during 2019 they conducted 26 drone patrols and filed 15 legal complaints with the regional Environmental Prosecutor’s Office, known as FEMA. Below, we describe several of these cases.

Note that there is high potential to replicate this comprehensive monitoring model at the level of forest custodians (for example, concessionaires and indigenous communities) in the Amazon and other tropical forests.

Key ACOMAT Cases

Next, we describe four cases where comprehensive monitoring was performed (see Insets A-D on the Base Map).

Base Map. ACOMAT concessions. Data: ACCA, MINAM/PNCBMCC, SERNANP.

A. Illegal logging in the Los Amigos Conservation Concession

In October 2019, a patrol was carried out to investigate a threatened area within the Los Amigos Conservation Concession (the world’s first Conservation Consession). During the patrol, which included five drone flights, illegal logging was documented, including stumps with sawn trees , paths for the transfer of wood to a nearby river, and abandoned camps. The drone images were added as evidence in support of the previously filed criminal complaint to the FEMA in Madre de Dios. Below we present two striking images from the drone flights, clearly showing the illegal logging. Status of the Complaint: In Preliminary Investigation.

Case A. Illegal logging in the Los Amigos Conservation Concession, identified with drone overflight. Source: ACCA.

B. Ilegal Logging in the MADEFOL Forestry Concession

In May 2019, a field patrol was carried out to investigate a threatened area within the MADEFOL forestry concession. During the patrol, which included two drone flights, illegal logging was documented, including stumps with sawn trees, a recently abandoned camp, and an access road. With the drone images as evidence, a new criminal complaint was filed with the FEMA in Madre de Dios. Below is an image from the drone flights, clearly showing the evidence of illegal logging. Status of the complaint: In qualification.

Case B. Illegal logging in the “MADEFOL” forestry concession identified with drone overflight. Source: ACCA.

C. Illegal Gold Mining in a Conservation Concession

In May 2019, a field patrol was carried out in the “Inversiones Manu SAC” Conservation Concession to investigate an area that had previously been affected by illegal gold miners. During the patrol, which included two drone flights, illegal gold mining was documented in the Malinowski River. With the drone images as evidence, a new criminal complaint was filed with the FEMA in Madre de Dios. Below is a drone image clearly showing the evidence of illegal gold mining. Status of the complaint: Preliminary Investigation.

Case C. Illegal mining in the Conservation Concession "Inversiones Manu SAC," identified with a drone overflight. Source: ACCA.
Case C. Illegal mining in the Conservation Concession “Inversiones Manu SAC,” identified with a drone overflight. Source: ACCA.

D. Deforestation in a Brazil Nut Concession

In October 2019, a patrol was carried out to investigate an early warning deforestation alert within the “Sara Hurtado Orozco B” Brazil nut concession.

During the patrol, which included one drone flight, the recent deforestation of five acres (two hectares) was documented. With the drone images, a new criminal complaint was filed with the FEMA of Madre de Dios. It should be noted that this concession was being investigated for a separate illegal deforestation event. Below is one of the images of the drone flight, clearly showing the illegal deforestation. Status of the complaint: In preliminary proceedings.

Case D. Deforestation in the “Sara Hurtado Orozco B” Chestnut Forest Concession. Source: ACCA.
Case D. Deforestation in the “Sara Hurtado Orozco B” Brazil Nut Forest Concession. Source: ACCA.

Importance of the “ACOMAT Model”

We have started using the term “Acomat model” to refer to the innovative use of the three elements described above (real-time monitoring, drone flights, and criminal complaints) by the ACOMAT concessionaires.

ACOMAT was created in 2012, and since 2017 has received crucial support from the organization Conservation Amazónica-ACCA, supported by funds from Norway’s International Climate and Forest Initiative (NICFI), led by the Norwegian Agency for Development Cooperation (NORAD).

This project has provided training on all three major aspects, satellite-based monitoring alerts, drones, and the legal process. Concessionaires now receive deforestation alerts to their phones, have the ability to organize and conduct field patrols, and some are trained to perform their own drone flights.

Acknowledgments

We thank R. Segura (DAI), M.E. Gutierrez (ACCA), D. Suarez (ACCA), H. Balbuena (ACCA), M. Silman (WFU), and G. Palacios for their helpful comments on this report.

This report was conducted with technical assistance from USAID, via the Prevent project. Prevent is an initiative that, over the next 5 years, will work with the Government of Peru, civil society, and the private sector to prevent and combat environmental crimes in Loreto, Ucayali and Madre de Dios, in order to conserve the Peruvian Amazon.

This publication is made possible with the support of the American people through USAID. Its content is the sole responsibility of the authors and does not necessarily reflect the views of USAID or the US government.

This work was also supported by NORAD (Norwegian Agency for Development Cooperation) and ICFC (International Conservation Fund of Canada).


Citation

Finer M, Castañeda C, Novoa S, Paz L (2020) Drones and Legal Action in the Peruvian Amazon. MAAP 126.

MAAP: Fires In The Bolivian Amazon 2020

Base Map. Major fires in the Bolivian Amazon during 2020. Data: MAAP/ACEAA.

We have detected 120 major fires this year in the Bolivian Amazon, as of the first of October (see Base Map).*

The majority of these fires (54%) occurred in savannas, located in the department of Beni.

Another 38% of the major fires were located in forests, mostly in the dry forests of the Chiquitano.

We emphasize that 25% of the major fires were located in Protected Areas (see below).


*The data, updated through October 1, is based on our novel real-time Amazon Fires Monitoring app, which is based on the detection of elevated aerosol emissions (by the European Space Agency’s Sentinel-5 satellite) that indicate the burning of large amounts of biomass (defined here as a “major fire”).


Major Fires in Protected Areas of the Bolivian Amazon in 2020. Data: MAAP/ACEAA.

Major Fires in Protected Areas

The most impacted Protected Areas are Noel Kempff Mercado National Park (21,000 acres burned), and Copaibo Municipal Protected Area (99,000 acres burned hectares).

Other impacted Protected Areas impacted include Iténez National Park, Keneth Lee Reserve and Pampas del Río Yacuma Integrated Management Natural Area.


Satellite Images of the Major Fires in the Bolivian Amazon

We present a series of high-resolution satellite images of the major fires in the Bolivian Amazon.

Image 1 shows a major fire in the extreme northwest of Noel Kempff Mercado National Park in September. Note that the fires are burning in the transition between Amazon forest and savanna.

Image 1. Major Fire #61 (Sept 8, 2020). Data: Planet.

Image 2 shows a major fire in Copaibo Municipal Protected Area in September. Note that it is located in the transition zone of the moist Amazon forest and Chiquitano dry forest.

Image 2. Major Fire #65 (September 7, 2020). Data: Planet.

Image 3 shows another major fire in Copaibo Municipal Protected Area, also in the transition zone of the Amazon forest and the Chiquitano dry forest.

Image 3. Major Fire #51 (September 4, 2020). Data: Planet.

Image 4 shows a major fire in the savannas of Beni.

Image 4. Major Fire #68 (September 12, 2020). Data: Planet.


Citation

Finer M, Ariñez A (2020) Fires in the Bolivian Amazon 2020. MAAP.

MAAP #123: Detecting Illegal Logging In The Peruvian Amazon

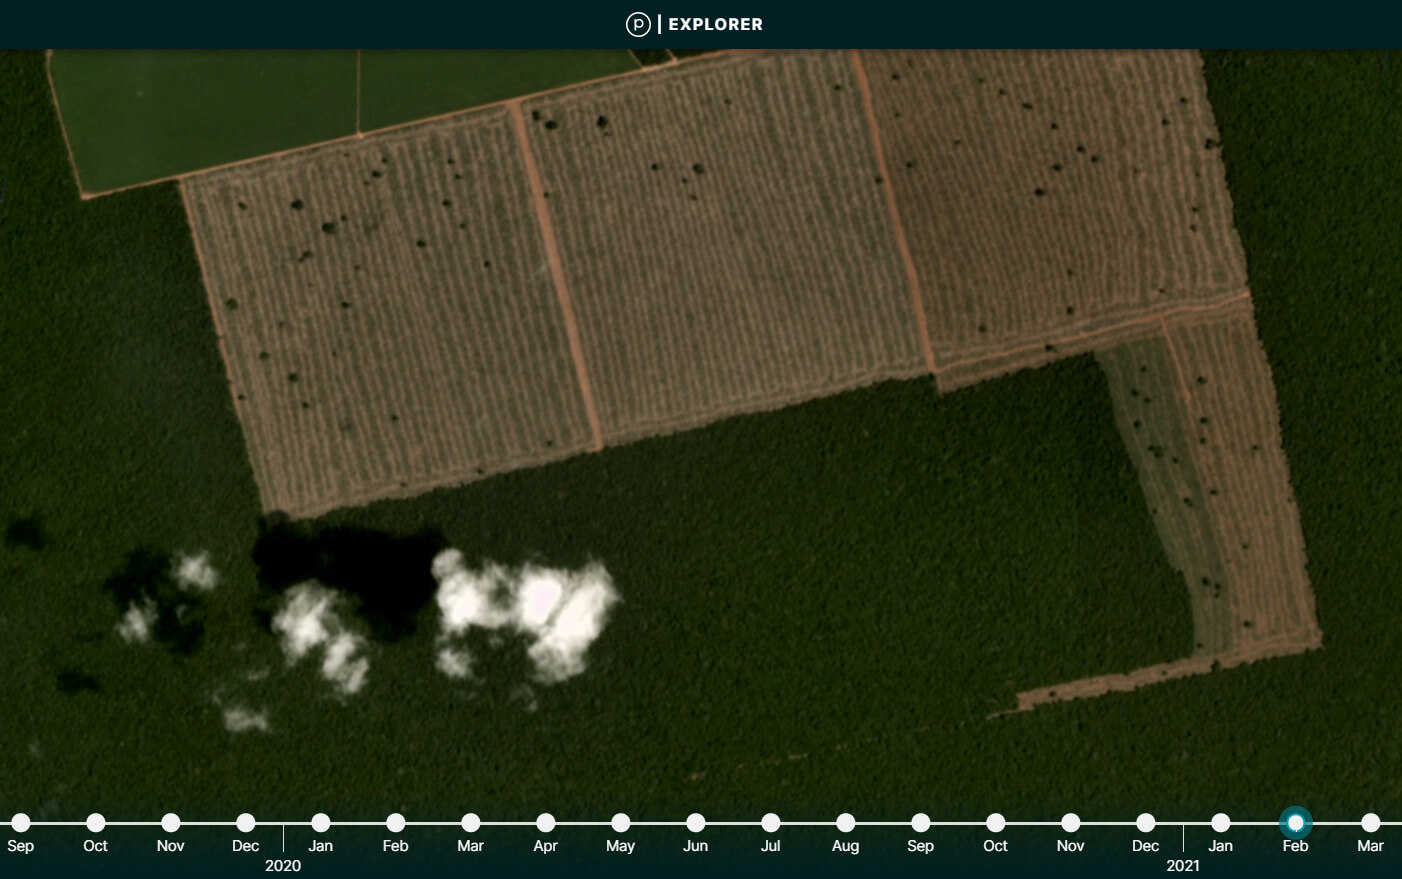
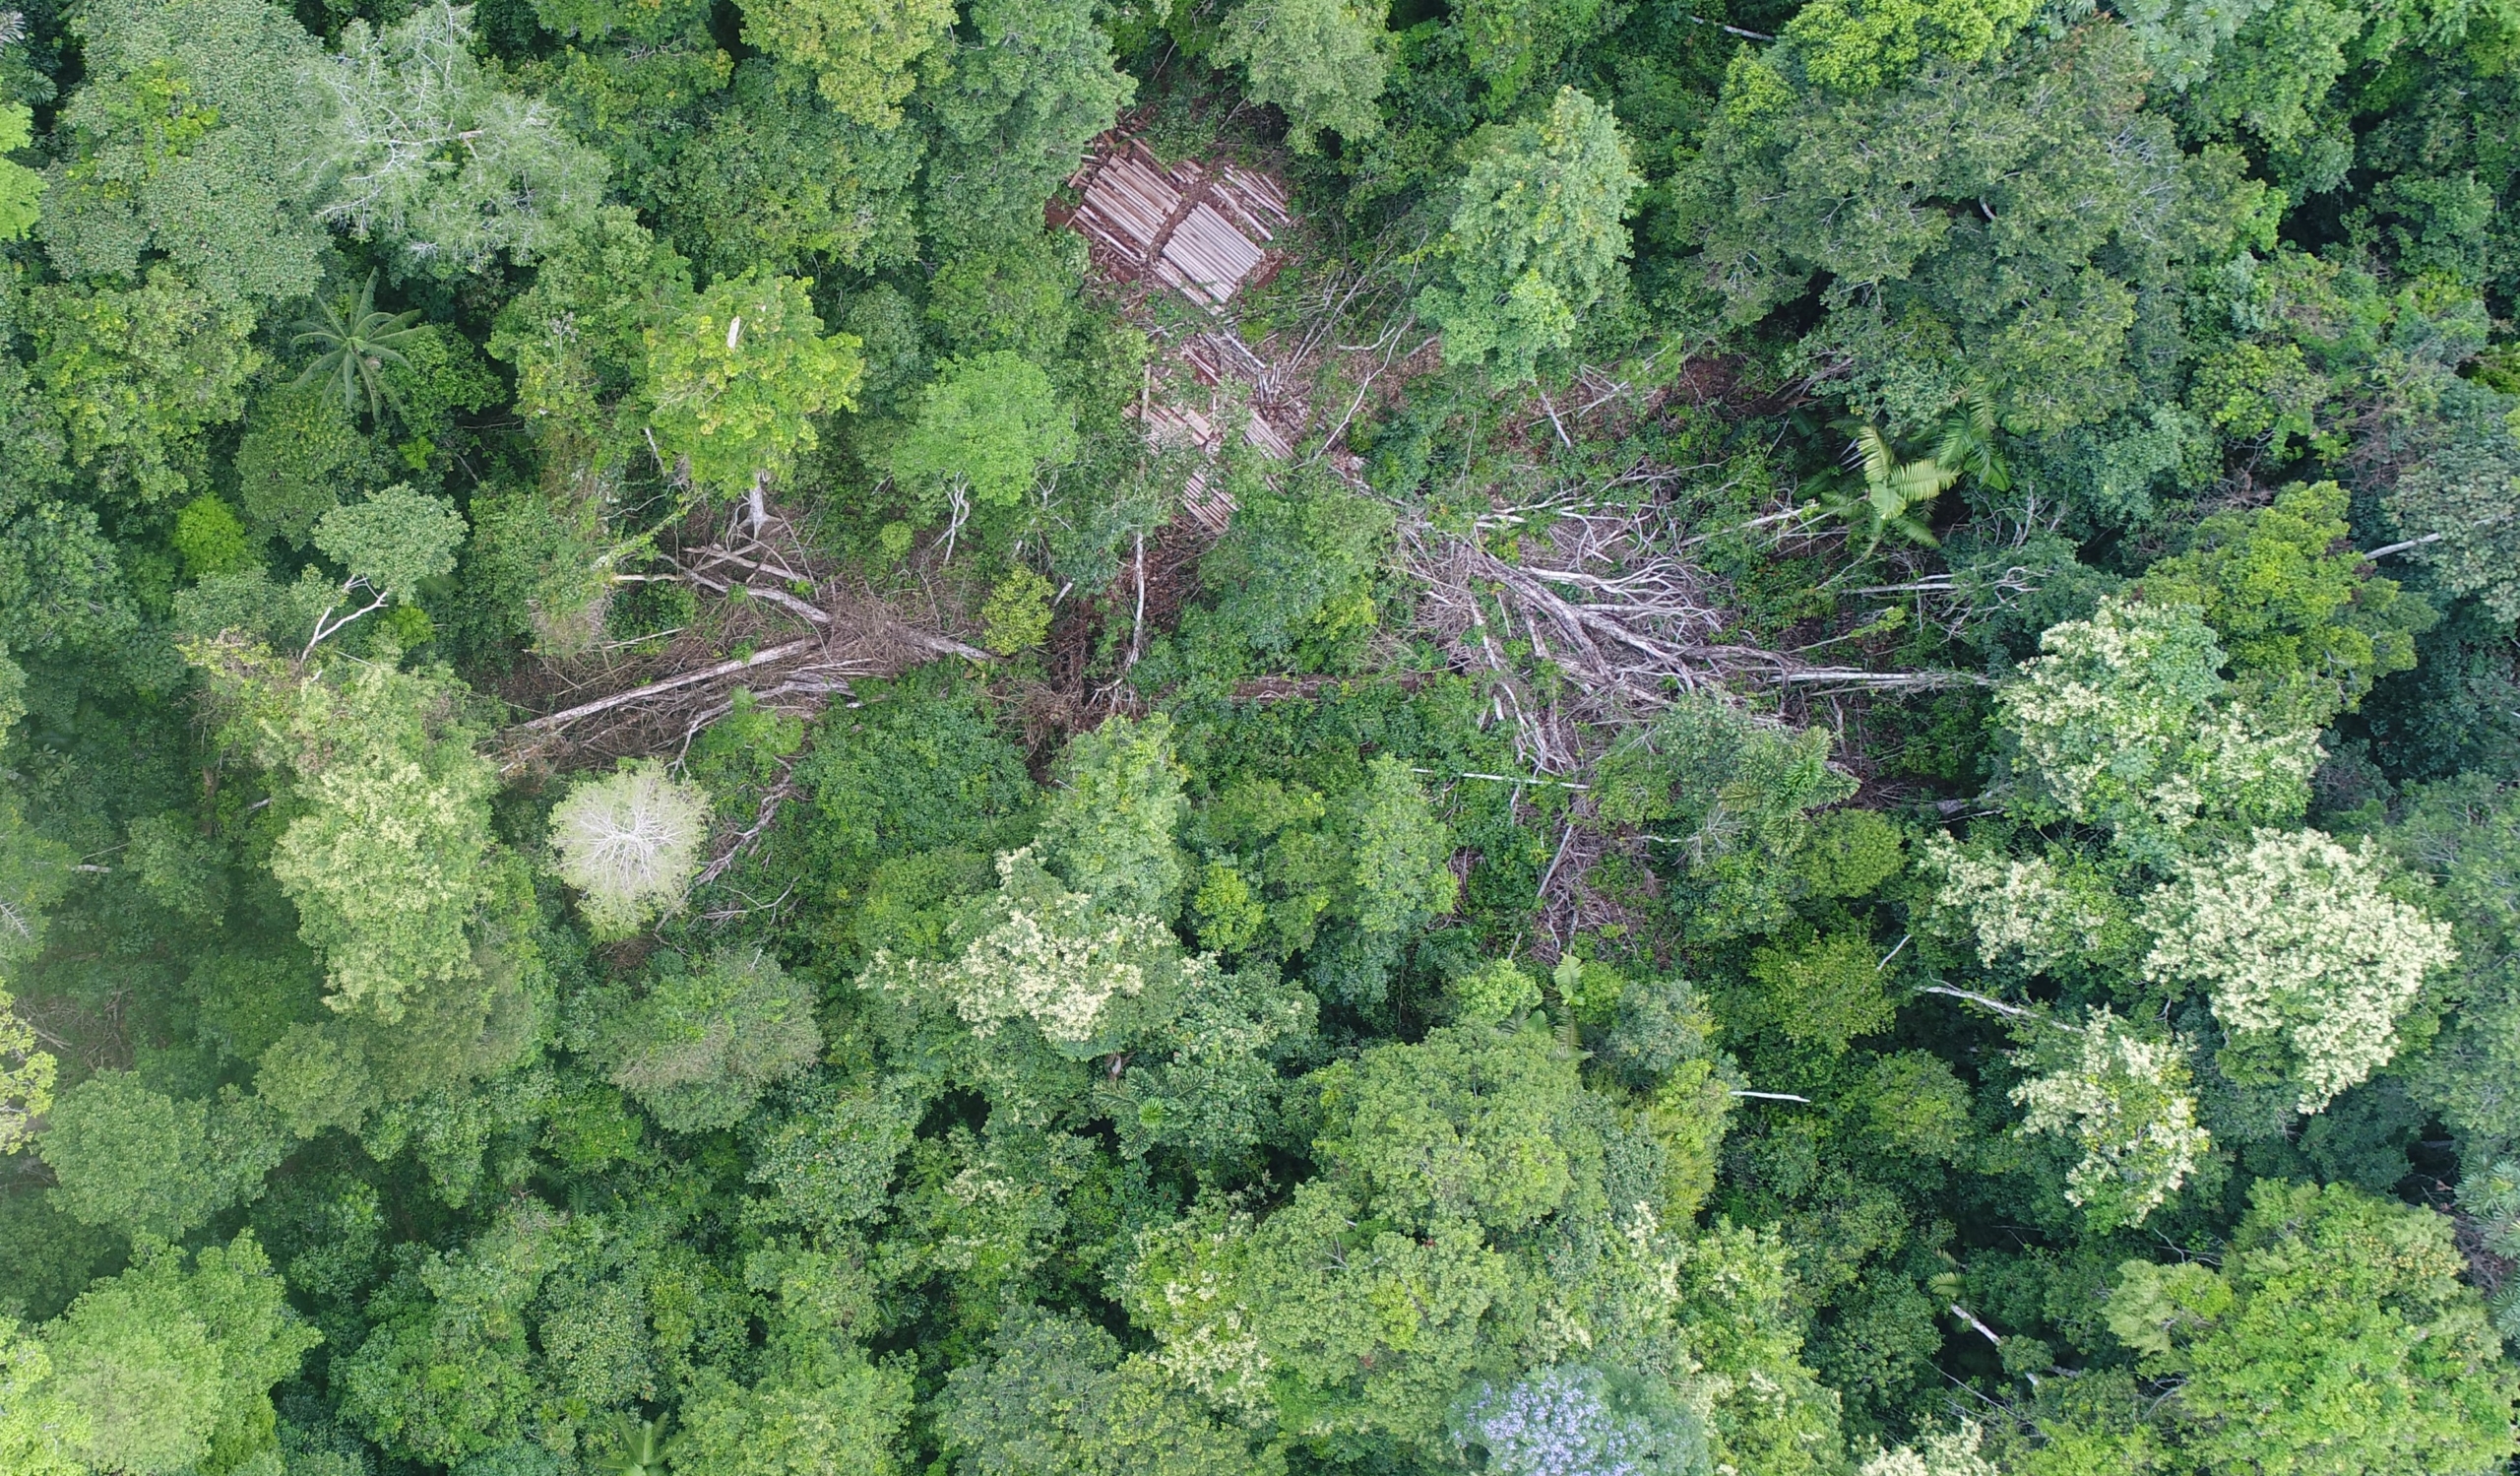
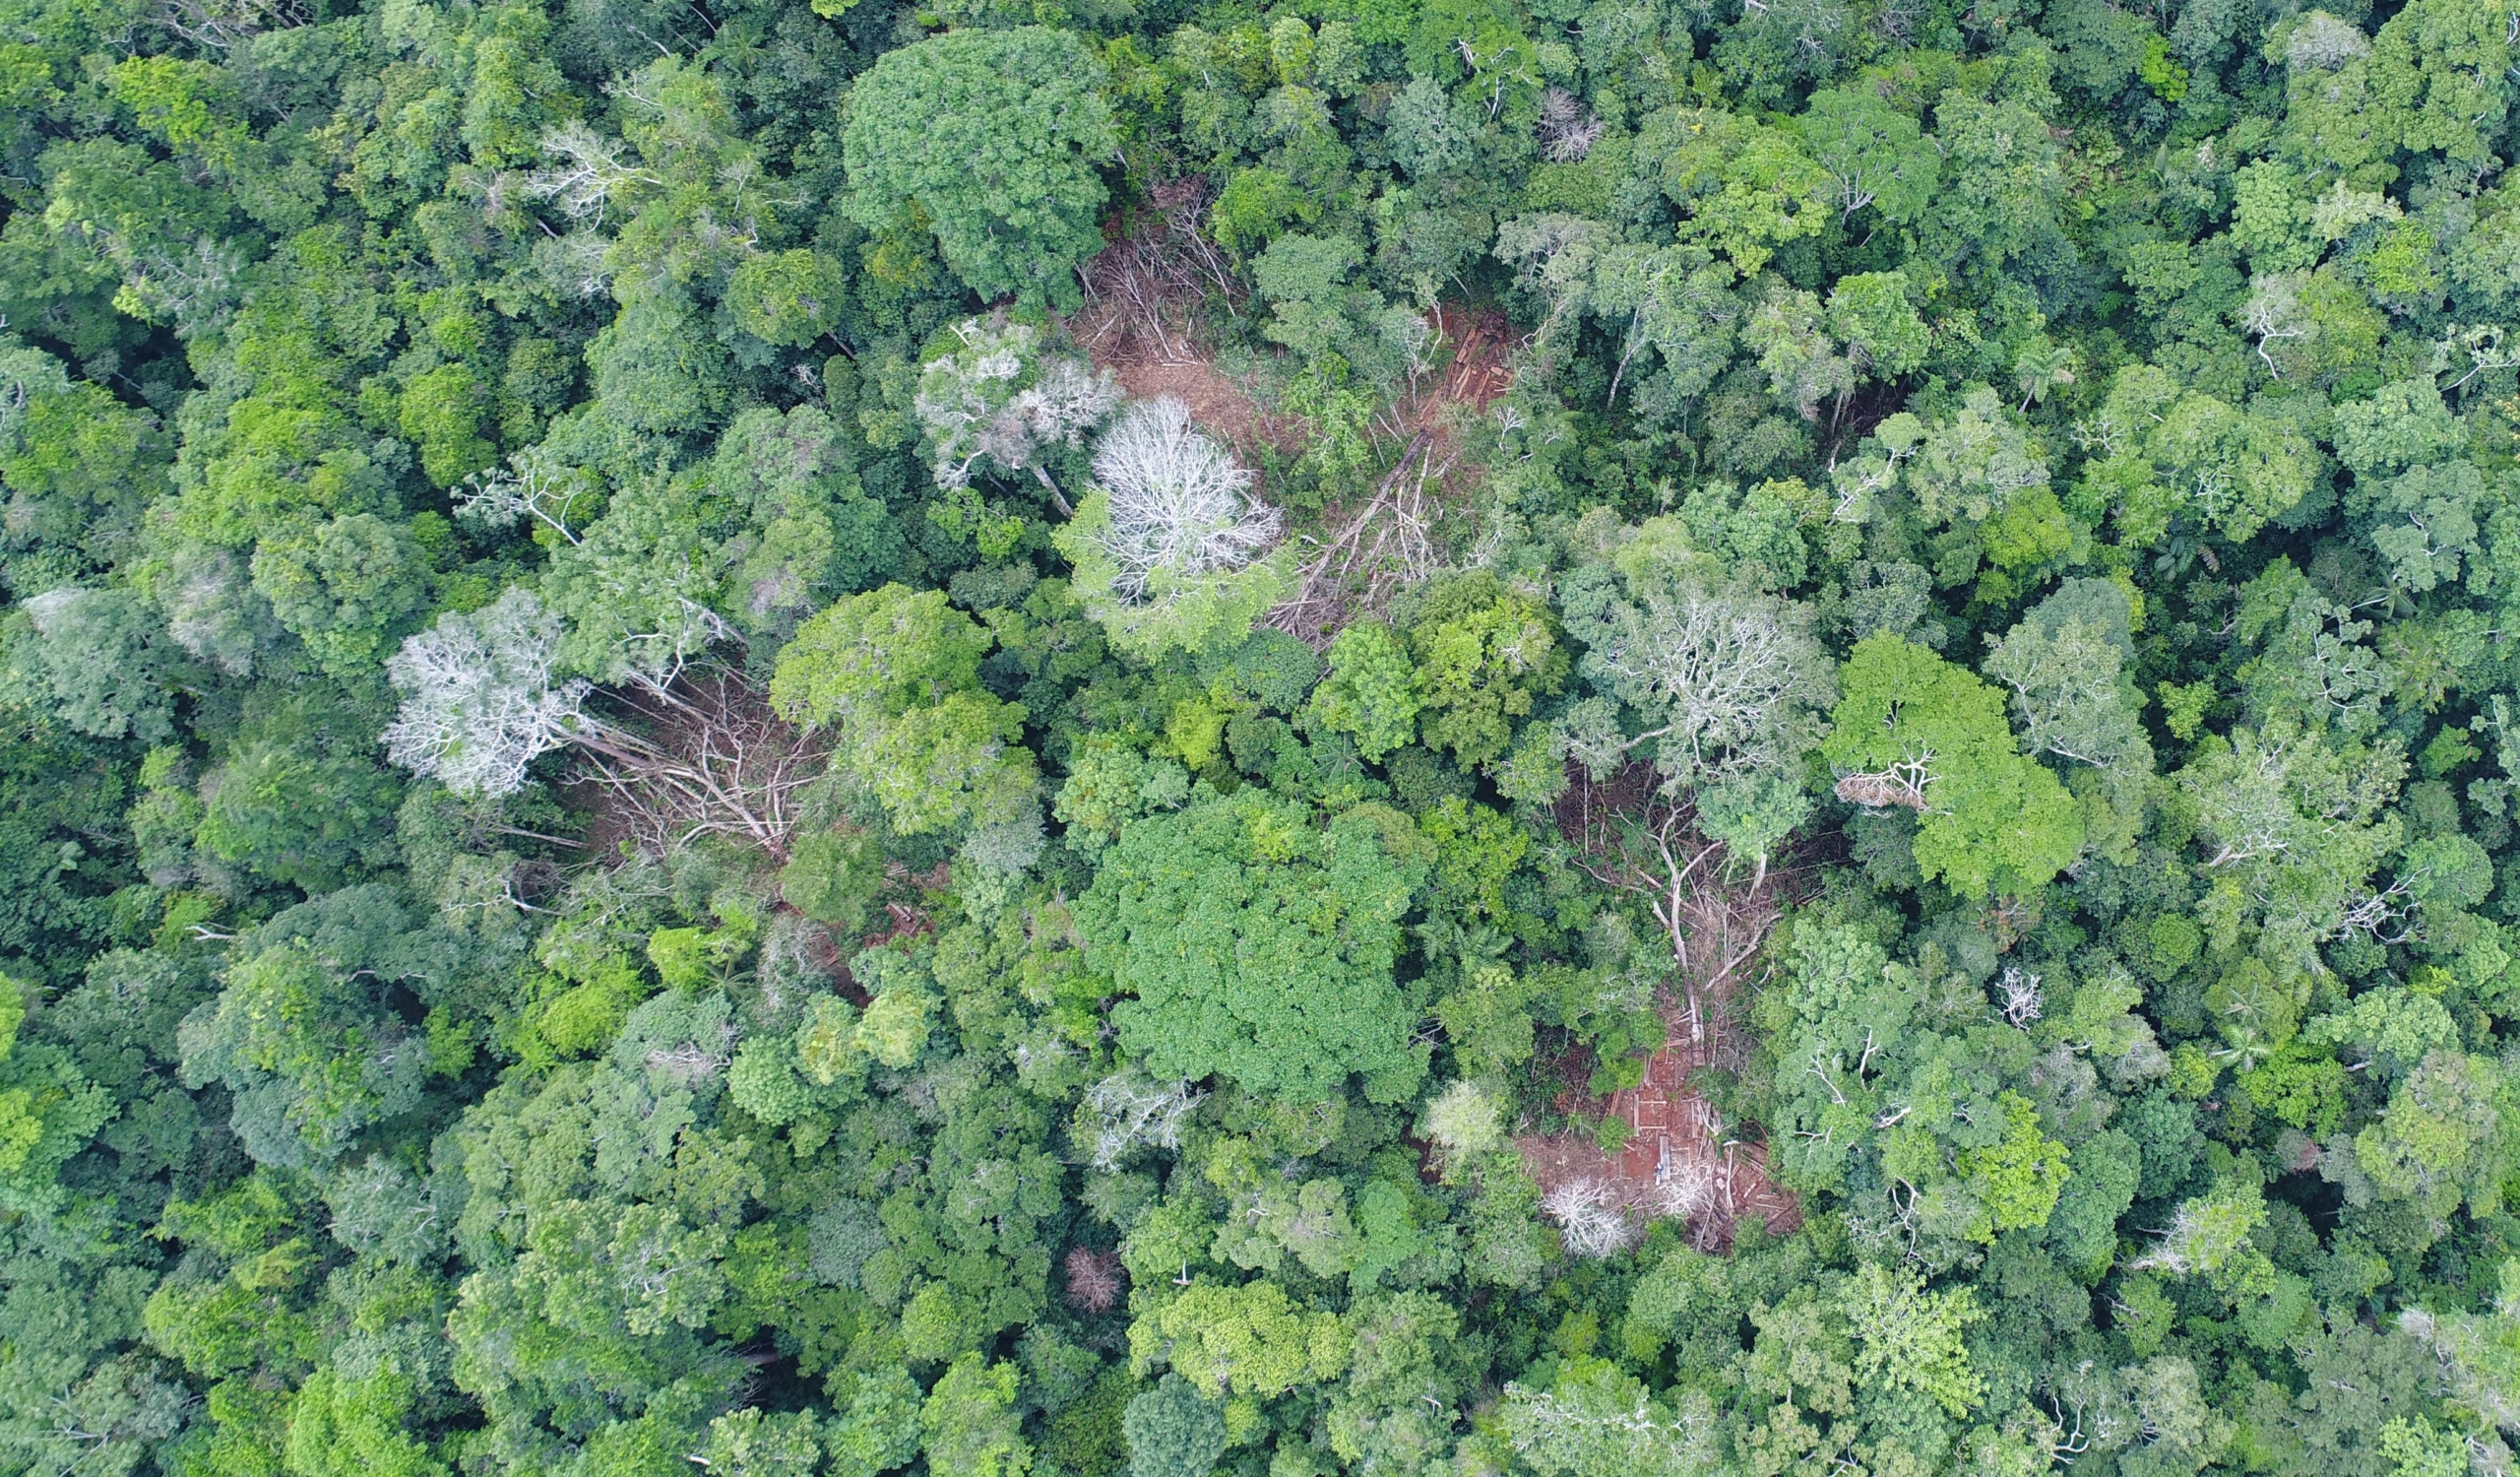
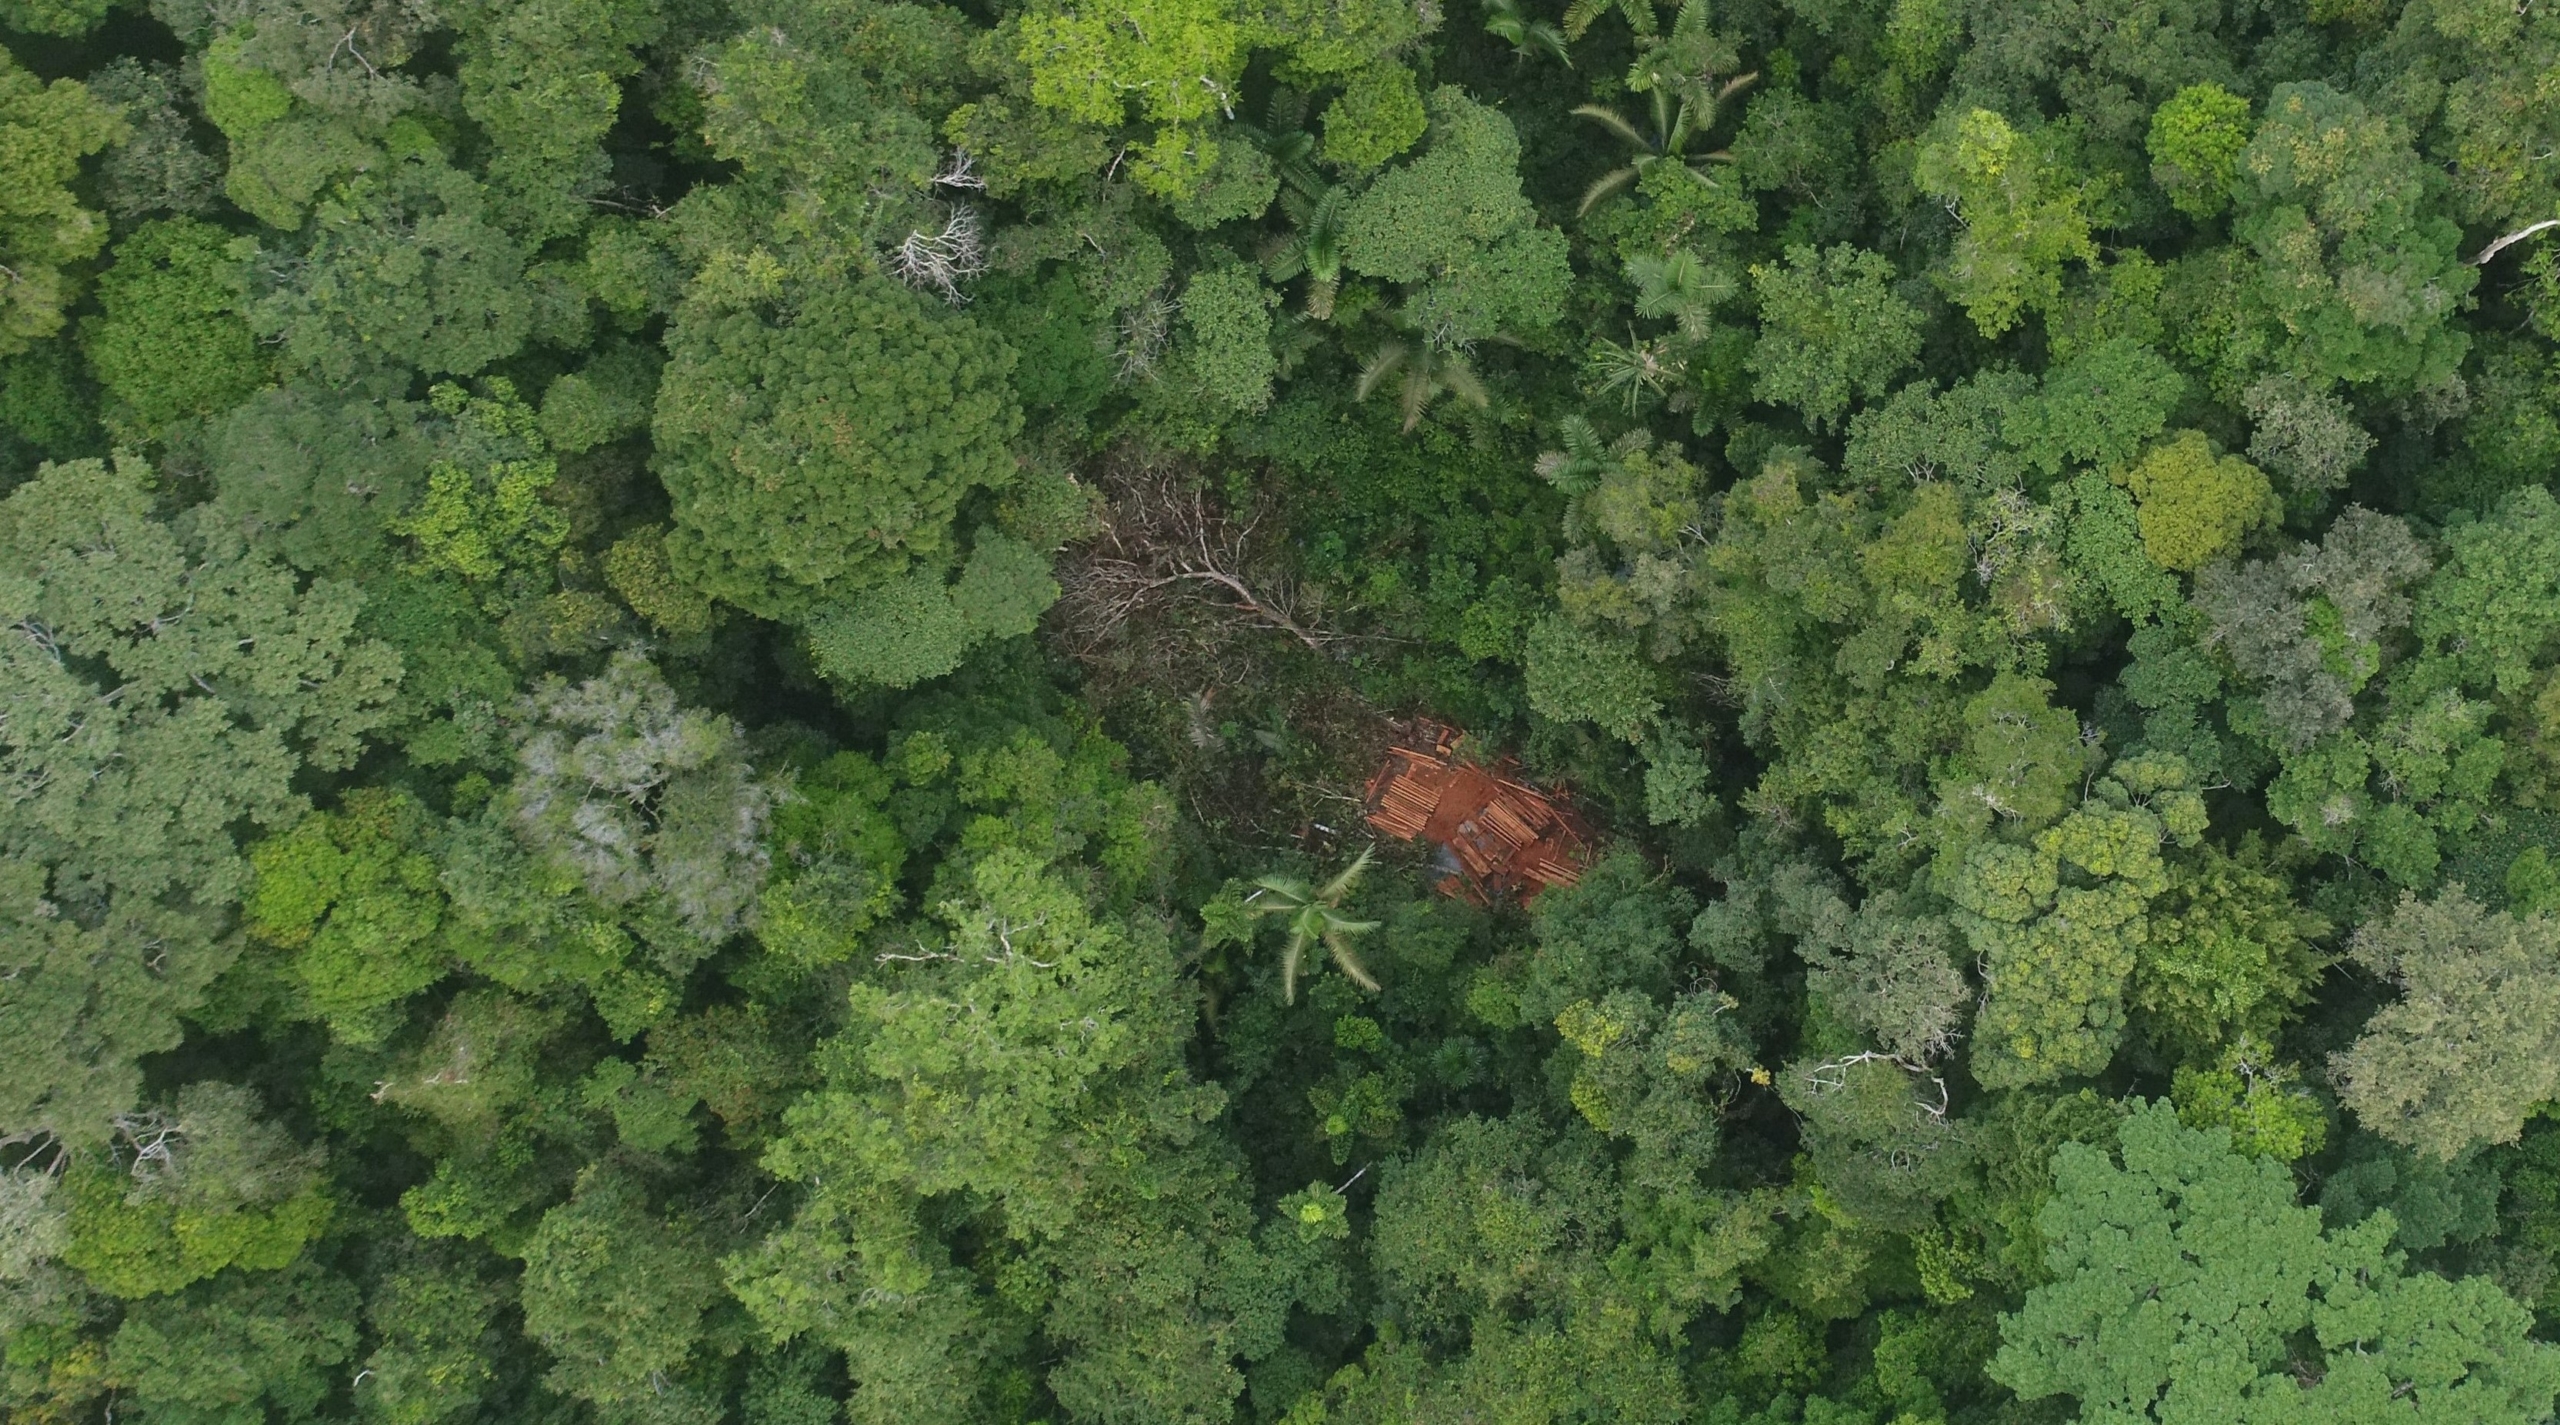
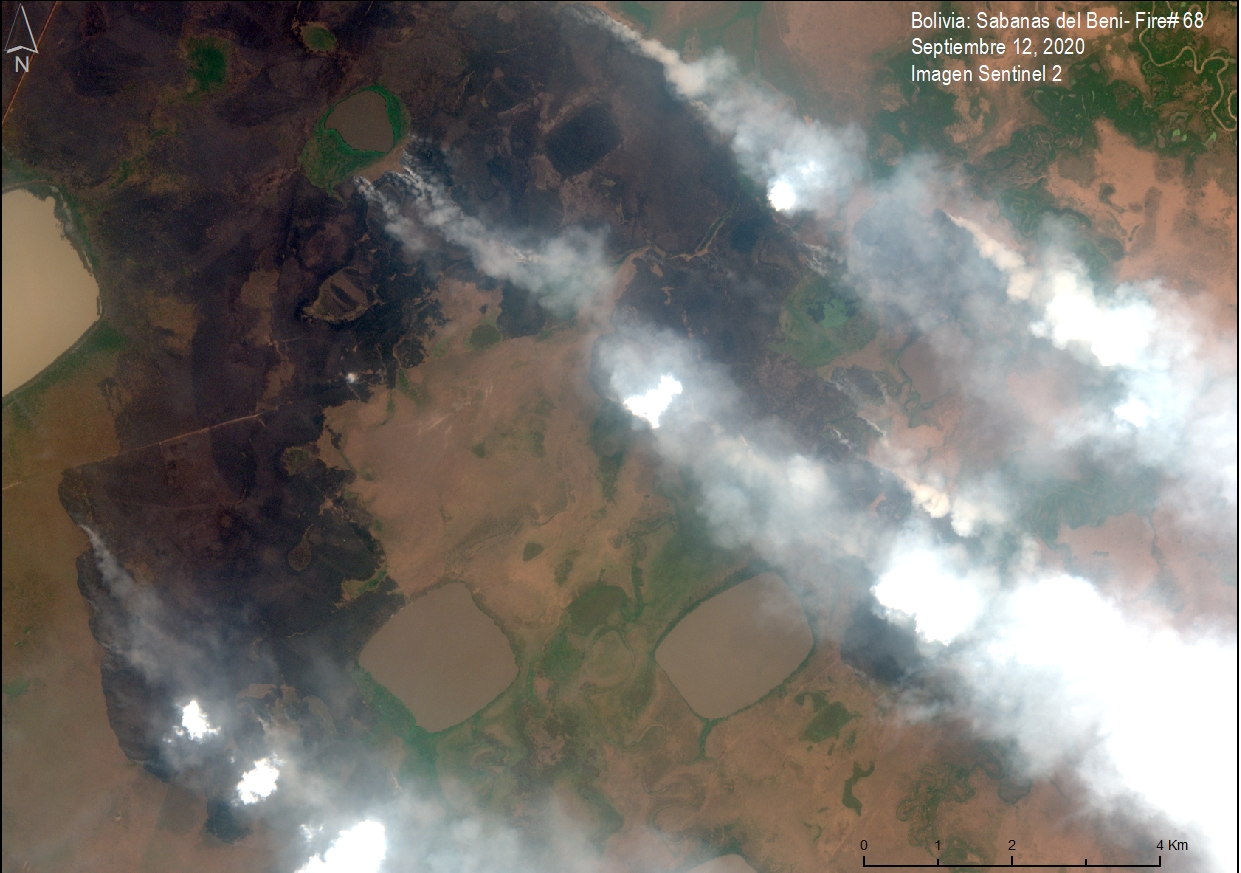
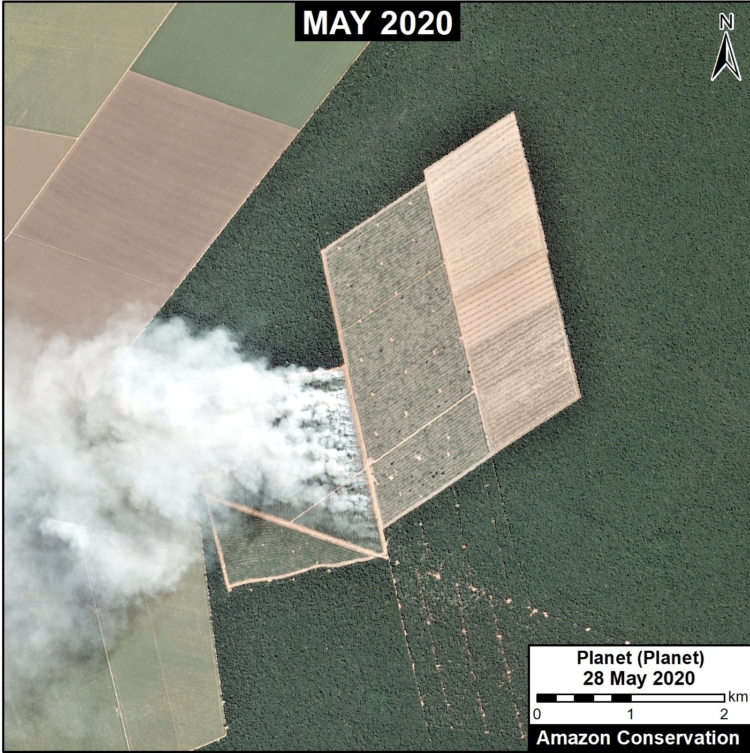
Image 1. Example of a 2019 logging road with signs of illegality. Data: Planet.

In the Peruvian Amazon, the widespread illegal logging is difficult to detect with satellites because it is selective for high-value species (not clearcutting).

It is possible, however, to detect the associated logging roads.

In this report, we present a novel technique to identify illegal logging: analyze new logging roads in relation to detailed land use data available from government agencies.

Thus, our new method detects the crime in real-time and preventive action is still possible. This is important because when an intervention against illegal logging normally occurs, stopping a boat or truck with illegal timber, the damage is done.

This analysis has two parts. First, we identified the new logging roads built in the Peruvian Amazon during 2019, updating our previous work for 2015-18 (see Base Map).

Second, we analyzed the new logging road data in relation to governmental land use information in order to identify possible illegality.

This data is from 2019, but we are now applying this technique in real time during 2020.


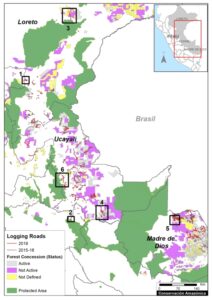
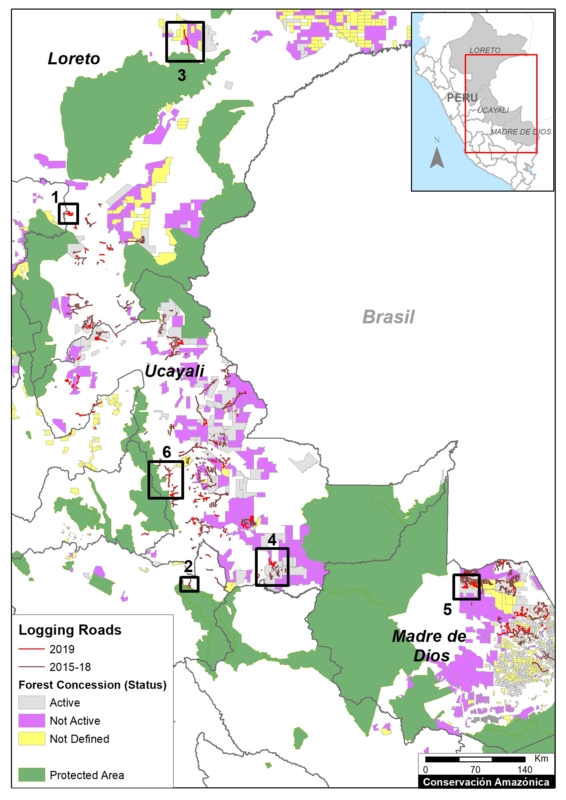
Base Map. 2019 Logging roads, in relation to 2015-18 logging roads. Data: MAAP.

Logging Roads 2019

The Base Map illustrates the location of logging roads built in the Peruvian Amazon during the last 5 years.

Previously (MAAP #99), we documented the construction of 3,300 kilometers of logging roads between 2015 and 2018.

Here, we estimate the construction of an additional 1,500 kilometers in 2019 (see red).

Note that forest roads are mainly concentrated in the Ucayali, Madre de Dios and Loreto regions.

Below, we show three types of possible illegality that detected in 2019:

  • Logging roads in areas without forestry concessions or permits (Cases 1-2).
    .
  • Logging roads in existing forest concessions, but whose current status is defined as “Non-Active or Undefined” (Cases 3-5).
    .
  • Logging roads in Native Communities (Case 6).


Cases of Possible Illegality

Logging roads in areas without forestry concessions or permits

Case 1. We detected the opening of a new logging road network (55 km) in an area without forestry concessions or permits, between the limits of the Loreto and San Martín regions. The image shows the digitized logging roads (red, left panel), and non-digitized satellite image (right panel). The arrows provide reference points between panels.

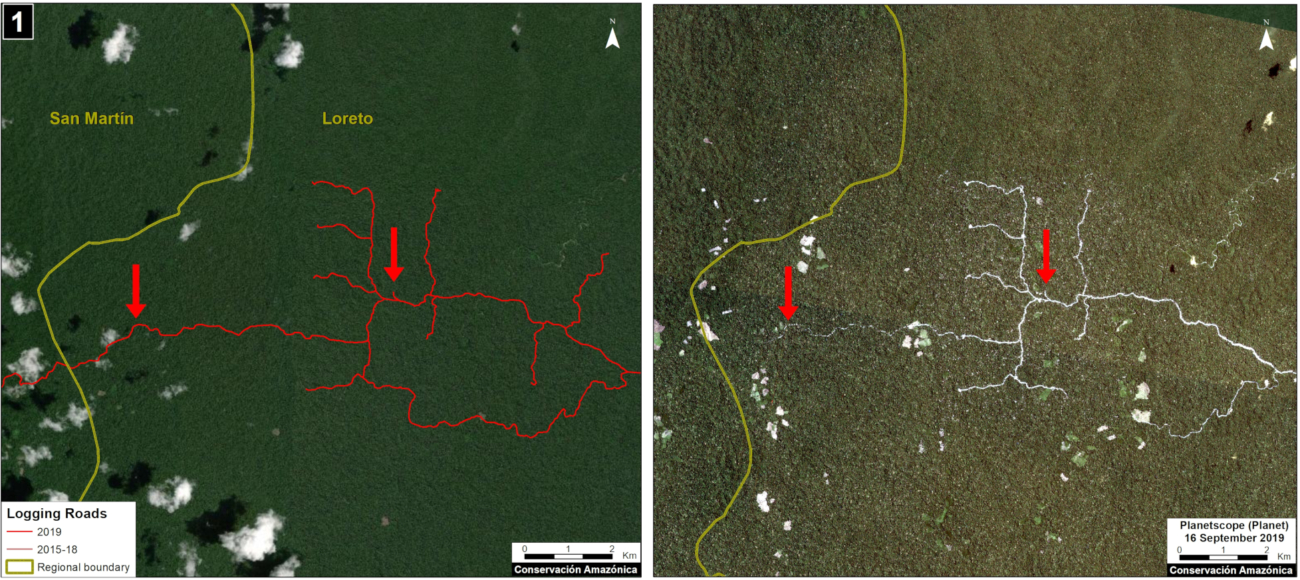
Case 1. Data: MAAP, Planet. Click to enlarge.


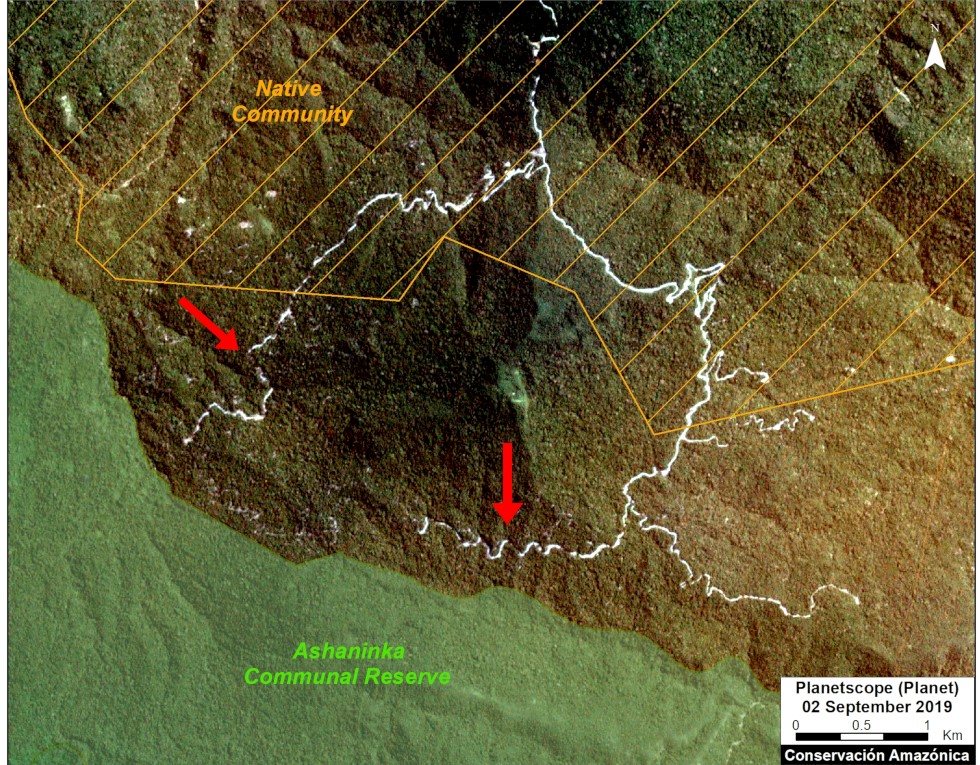
Case 2. We detected the construction of a new logging road network (5.8 km) in the buffer zone of Asháninka Communal Reserve, reaching only 300 meters from the protected area. The image shows the digitized logging roads (red, left panel), and non-digitized satellite image (right panel). The arrows provide reference points between panels.

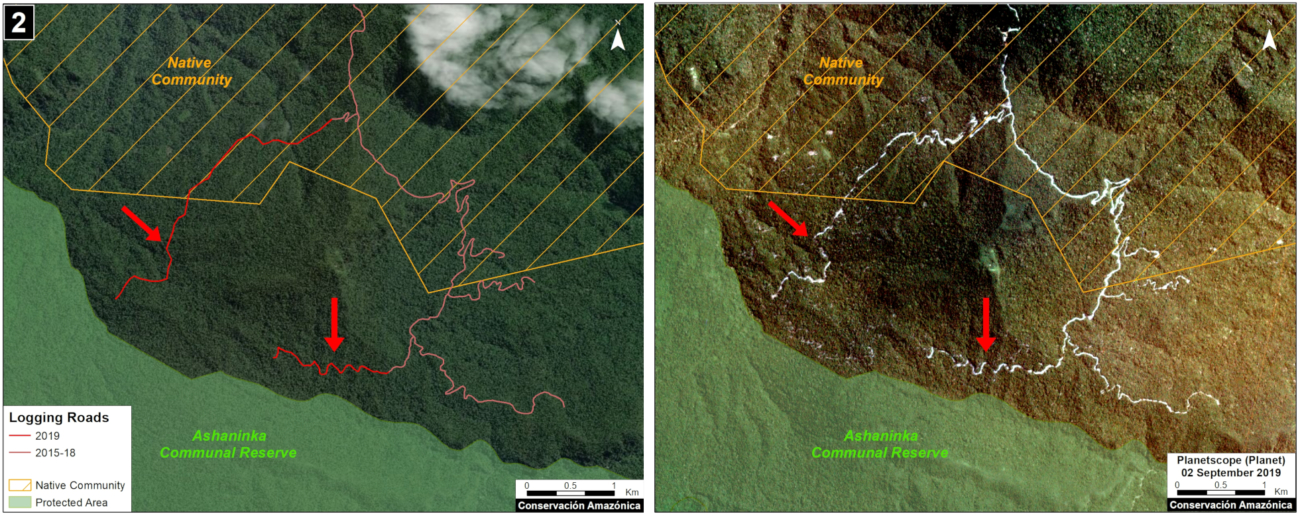
Case 2. Data: MAAP, Planet, IBC, SERNANP. Click to enlarge.


Logging roads in existing forest concessions, but whose current state is labelled as “Non-Active or Undefined” 

Case 3. We detected the construction of a new logging road (45.3 km) that crosses a native community and reaches a forest concession whose status is defined as “Undefined,” in the Loreto region just north of Pacaya Samiria National Reserve. The image shows the digitized logging roads (red, left panel), and non-digitized satellite image (right panel). The arrows provide reference points between panels.

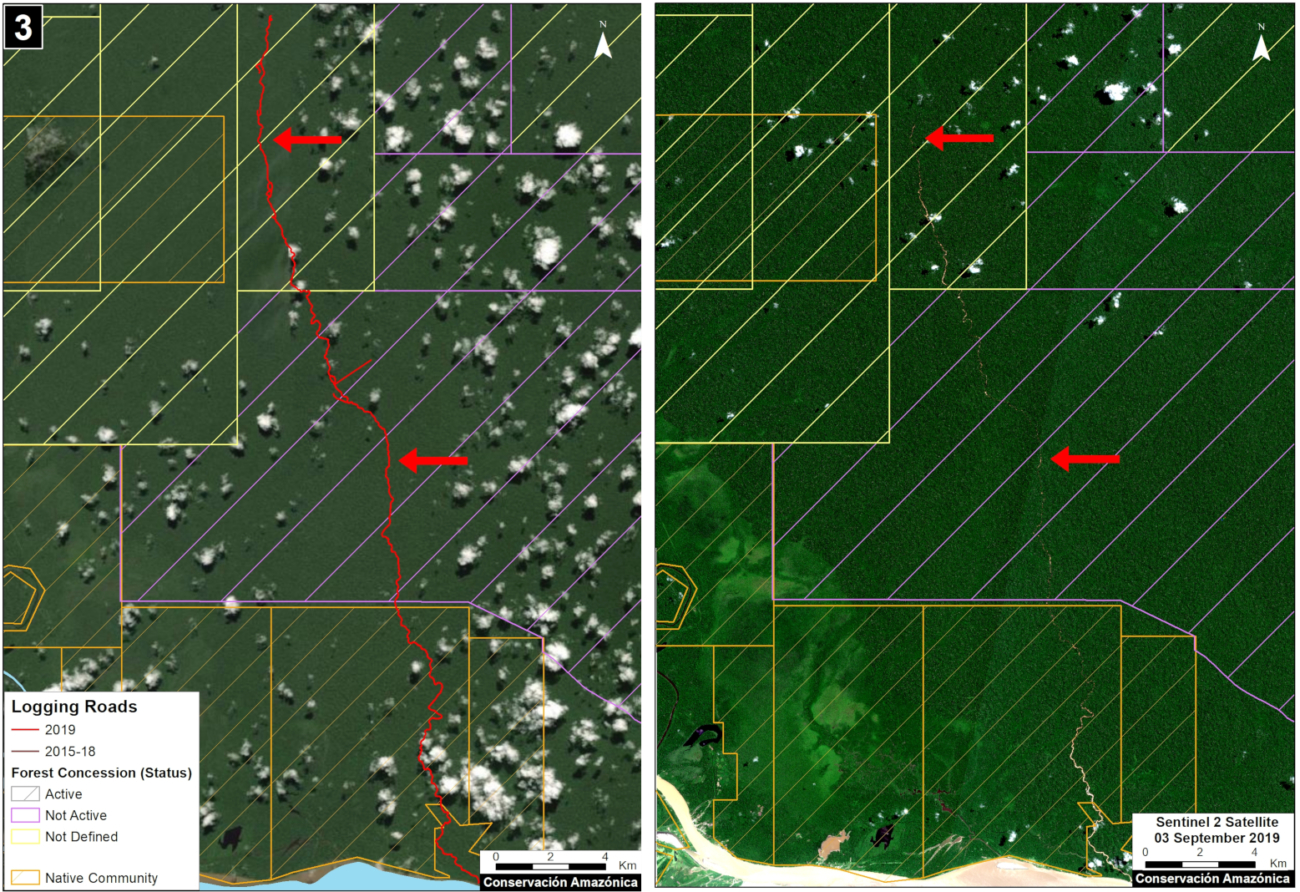
Case 3. Data: MAAP, ESA, IBC, SERFOR. Click to enlarge.


Case 4. We detected the construction of a new logging road network (53.2 km), of which nearly half (21.4 km) crosses a forest concession whose status is defined is “Non Active”, near the town of Sepahua in the Ucayali region. The image shows the digitized logging roads (red, left panel), and non-digitized satellite image (right panel). The arrows provide reference points between panels.

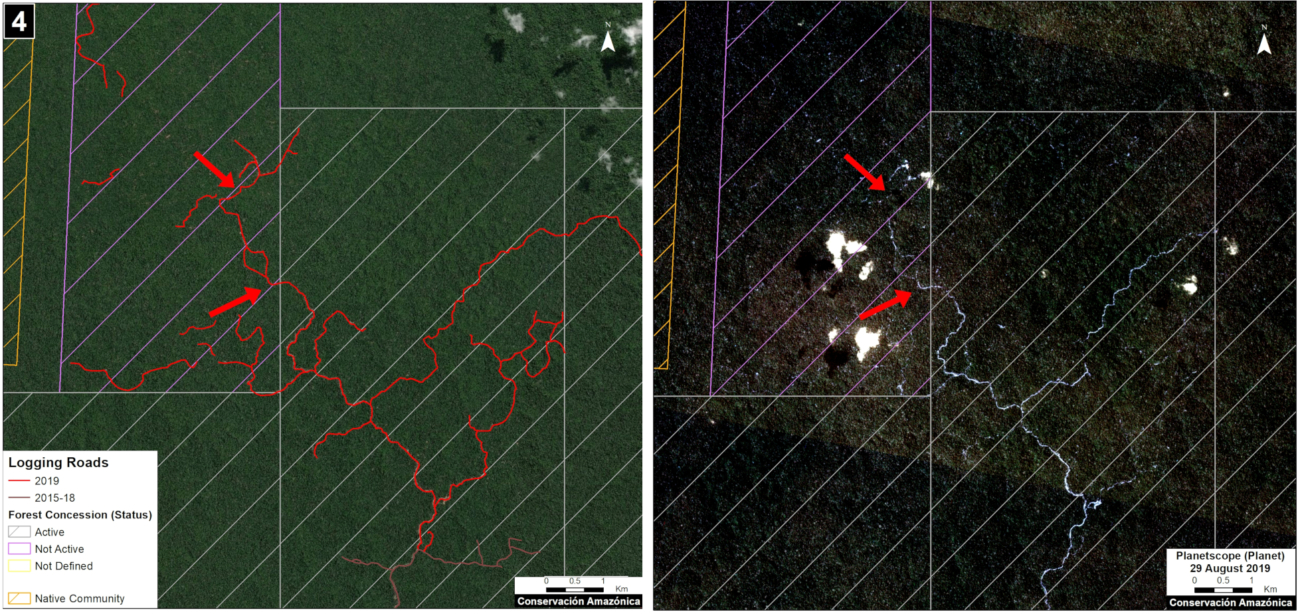
Case 4. Data: MAAP, Planet, IBC, SERFOR. Click to enlarge.


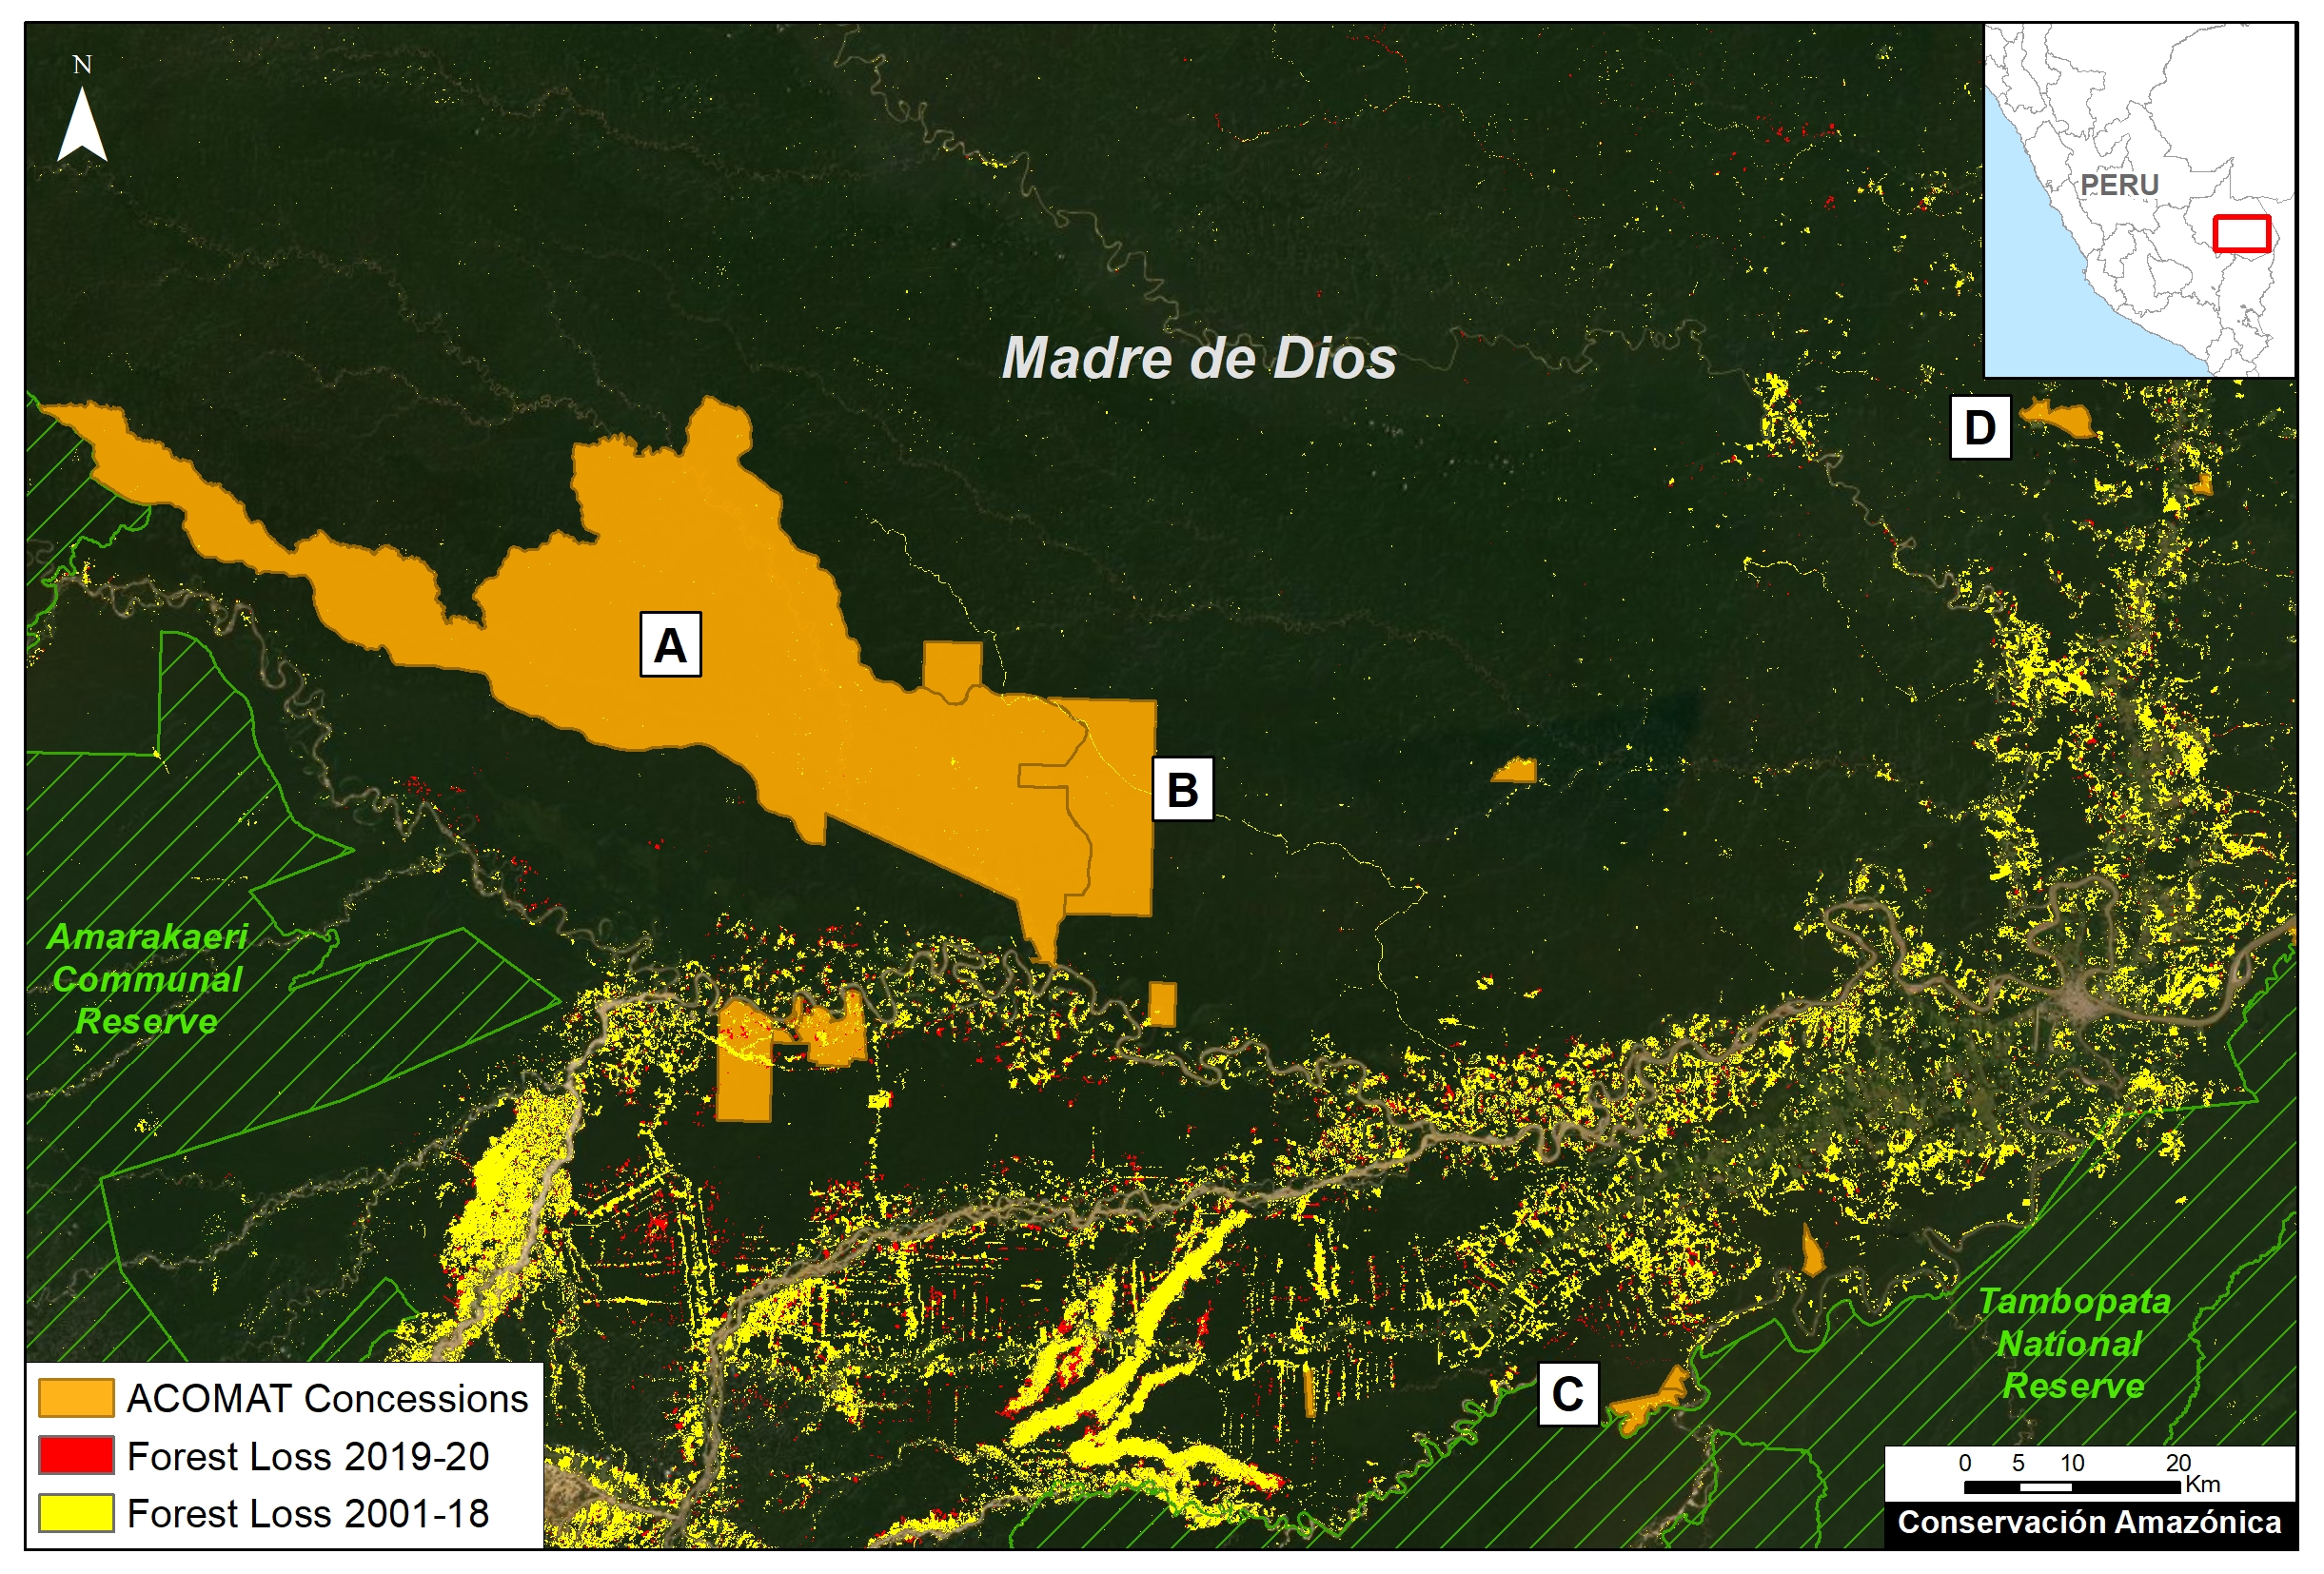
Case 5. We detected the construction of a new logging road (17.7 km) in a forestry concession whose current status is defined as “Non Active,” in the Madre de Dios region. The image shows the digitized logging roads (red, left panel), and non-digitized satellite image (right panel). The arrows provide reference points between panels.

Case 5. Data: MAAP, ESA, IBC, SERFOR. Click to enlarge.


Logging roads in Native Communities

Case 6. We detected the construction of a logging road (23.4 km) within an indigenous community in the Ucayali region. We did not find evidence of a permit for this activity. The image shows the digitized logging roads (red, left panel), and non-digitized satellite image (right panel). The arrows provide reference points between panels.

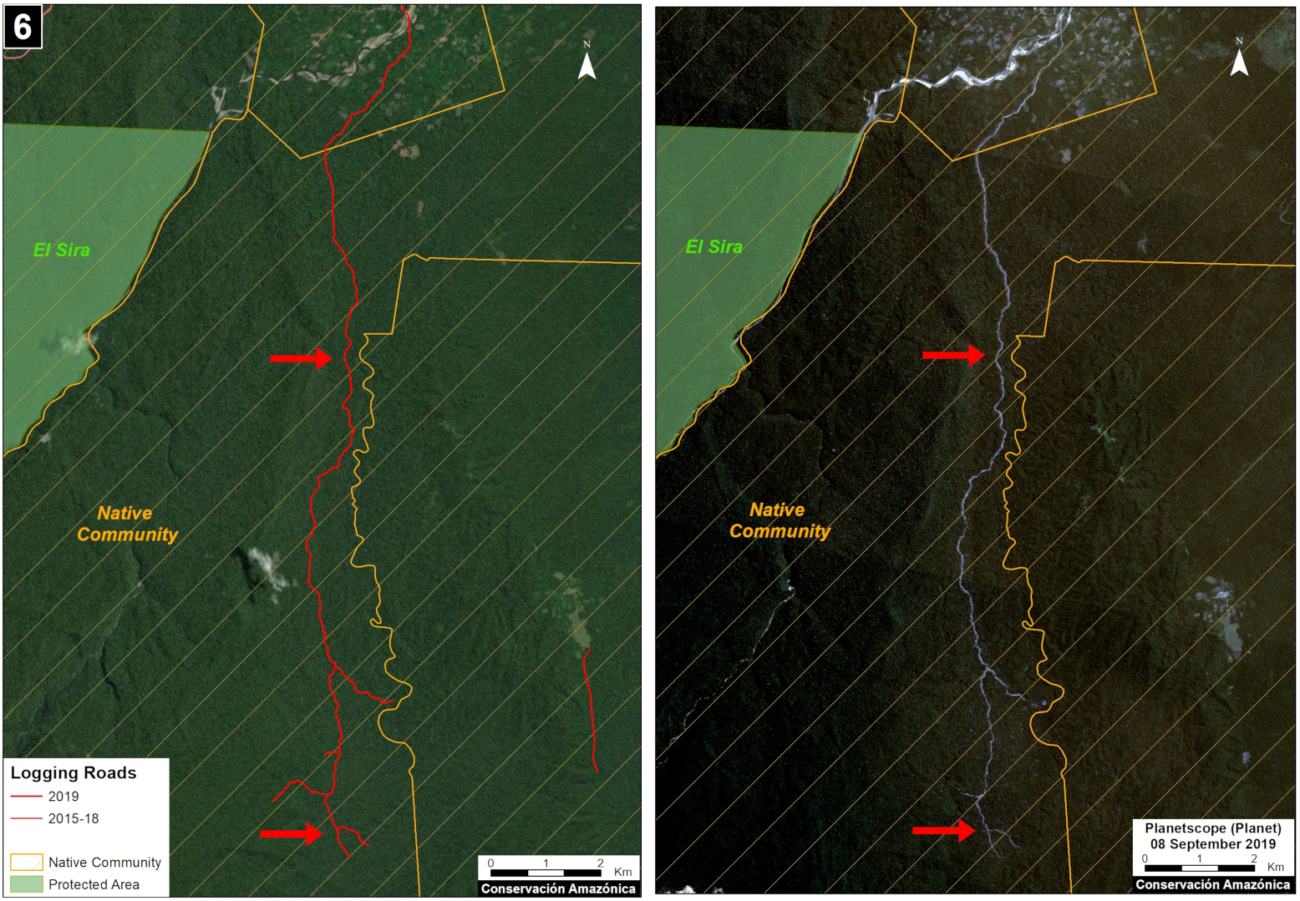
Case 6. Data: MAAP, Planet, SERNANP, IBC, SERFOR. Click to enlarge.


Methodology

Our analysis included two main steps:

The first step consisted of evaluating linear patterns in the 2019 early warning and final forest loss data, available from Global Forest Watch (data from the University of Maryland) and Geobosques (data from the Peruvian Ministry of the Environment). From the linear patterns, we distinguished between logging access roads and other types of roads and highways. Logging roads tend to have linear patterns that branch into the interior of the forest where the commercial timber is found. Other types of roads have a more defined destination, such as towns or farms. Once logging roads were identified, we downloaded the associated high-resolution imagery (3 meters) from Planet Explorer and digitized the roads in ArcGIS. During this process, additional logging roads detected in the high resolution images were also digitized.

The second step focused on the legality analysis. The new logging road data were overlaid with other types of land use information, such as forestry concessions on the GeoSERFOR portal (SERFOR), permits and concessions on the SISFOR portal (OSINFOR), indigenous communities (IBC 2019), protected areas (SERNANP), population centers (INEI 2019), and official road networks (MTC 2018). For example, as shown above, this process identified logging roads near protected areas, within indigenous communities, and within non-active forest concessions.

We analyzed information on several websites now available from national and regional authorities, such as SISFOR (OSINFOR), GEOSERFOR (SERFOR), and IDERs (Spatial Data Infrastructure of Regional governments). These new resources provide valuable information, however may have limitations in ability to constantly update information on the status of concessions and forest permits, especially from regional governments.


References

Planet Team (2017). Planet Application Program Interface: In Space for Life on Earth. San Francisco, CA. https://api.planet.com


Acknowledgments

We thank R. Valle (OSINFOR), A. Felix (DAI), D. Suarez (ACCA), and G. Palacios for their helpful comments on this report.

This report was conducted with technical assistance from USAID, via the Prevent project. Prevent is an initiative that, over the next 5 years, will work with the Government of Peru, civil society, and the private sector to prevent and combat environmental crimes in Loreto, Ucayali and Madre de Dios, in order to conserve the Peruvian Amazon.

This publication is made possible with the support of the American people through USAID. Its content is the sole responsibility of the authors and does not necessarily reflect the views of USAID or the US government.

Citation

Finer M, Paz L, Novoa S, Villa L (2020) Detecting Illegal Logging in the Peruvian Amazon. MAAP: 123.

Fire Alert Vs. Aerosol Emission Data

Fire Alert vs. Aerosol Emission Data

Images 1 and 2 shows us how aerosol emission data allows users to prioritize hundreds (or thousands) of heat-based fire alerts. In other words, the aerosol data indicates just the fires that are  actually burning lots of biomass and putting out abundant smoke.

Image of heat-based fire alerts
Image of aerosol data

MAAP#120: Deforestation In The Colombian Amazon – 2020

Here we present a first look at 2020 deforestation of primary forest in the Colombian Amazon, in relation to the new published annual data for 2019.*

This new data confirms that deforestation decreased in 2019 (91,400 hectares) after a peak in 2018 (153,900 hectares).

Table 1. Deforestation of primary forest in the Colombian Amazon, 2015-20. Data: Hansen/UMD/Google/USGS/NASA, UMD/GLAD. *Until May 2020

Table 1 shows the recent trend: a major deforestation spike following the 2016 peace agreement (between the Colombian government and the FARC) with a peak in 2018, followed by a major decrease in 2019.

In our first look at 2020, we estimate the deforestation of 76,200 hectares (188,295 acres) of primary forest through June.

Note that we have documented the deforestation of 444,000 hectares (over a million acres) of primary forest in the Colombian Amazon in the past four years since the peace agreement.

*Global Forest Watch recently released the annual forest loss data for 2019.


Deforestation Hotspots – 2020

Base Map. 2020 Deforestation hotspots in the Colombian Amazon. Data: UMD/GLAD.

The Base Map shows the 2020 deforestation hotspots.*

As in previous years, they are concentrated in an “arc of deforestation” in the northwest Colombian Amazon.

This arc includes four protected areas (Tinigua, Chiribiquete and Macarena National Parks, and Nukak National Reserve) that lost 0ver 7,700 hectares (19,000 acres) of primary forest in 2020 (see Table 2).

Tinigua National Park is the most impacted protected area with the deforestation of 5,100 hectares (12,600 acres). Note the rare occurrence of a major deforestation hotspot in the middle of a national park.

Chiribiquete National Park lost 510 hectares (1,260 acres) in the recently expanded sections of the park.

The arc of deforestation also includes two Indigenous Reserves (Resguardos Indígenas Nukak-Maku and Llanos del Yari-Yaguara II) that lost 4,000 hectares (9,885 acres) so far in 2020.

*To see detailed map of the 2019-20 primary forest deforestation in the Colombian Amazon, click here.


Deforestation in Protected Areas and Indigenous Lands – 2020

Below, we show 2020 examples within the arc of deforestation in the northwest Colombian Amazon.

Image 1 illustrates the extensive deforestation within Tinigua National Park over the last five years continuing in 2020.

Image 2 shows an example of deforestation within Chiribiquete National Park (western sector) between January (left panel) and April (right panel) of 2020.

Image 3 shows an example of deforestation within the Llanos del Yari-Yaguara II Indigenous Reserve between January (left panel) and April (right panel) of 2020.

Image 1. Extensive deforestation within Tinigua National Park over the last five years, continuing in 2020. Data: Hansen/UMD/Google/USGS/NASA, UMD/GLAD.
Image 2. Deforestation in Chirbiquete National Park (western sector) between January (left panel) and April (right panel) of 2020. Data: ESA, Planet, MAAP.
Image 3. Deforestation in Llanos del Yari-Yaguara II Indigenous Reserve. Data: ESA, Planet, MAAP.


Deforestation in Protected Areas, 2015-20

Table 2 shows the loss of primary forest in four protected areas located in the arc of deforestation arc in the northwestern Colombian Amazon, between 2015 and 2020.

Table 2. Primary forest loss in four protected areas in the northwestern Colombian Amazon, between 2015 and 2020. Data: Hansen/UMD/Google/USGS/NASA, UMD/GLAD.

Methodology

The data presented in this report were generated by the Global Land Analysis and Discovery (GLAD) laboratory at the University of Maryland (Hansen et al 2013) and presented by Global Forest Watch. For the years 2015-18, we used annual forest loss data. For the years 2019-20, we used early warning alerts (GLAD alerts), and thus represent an estimate. Note that some forest loss detected early in the year may include events from late the preceding year.

Our study area is the Amazon biogeographical limit (not strict Amazon watershed) as highlighted in the Base Map.

Specifically, for our estimate of forest cover loss, we multiplied the annual “forest cover loss” data by the density percentage of the “tree cover” from the year 2001 (values >30%).

For our estimate of primary forest loss, we intersected the forest cover loss data with the additional dataset “primary humid tropical forests” as of 2001 (Turubanova et al 2018). For more details on this part of the methodology, see the Technical Blog from Global Forest Watch (Goldman and Weisse 2019).

All data were processed under the geographical coordinate system WGS 1984. To calculate the areas in metric units the UTM (Universal Transversal Mercator) projection was used: Colombia 18 North.

Lastly, to identify the deforestation hotspots, we conducted a kernel density estimate. This type of analysis calculates the magnitude per unit area of a particular phenomenon, in this case forest cover loss. We conducted this analysis using the Kernel Density tool from Spatial Analyst Tool Box of ArcGIS. We used the following parameters:

Search Radius: 15000 layer units (meters)
Kernel Density Function: Quartic kernel function
Cell Size in the map: 200 x 200 meters (4 hectares)
Everything else was left to the default setting.

For the Base Map, we used the following concentration percentages: Medium: 10%-20%; High: 21%-35%; Very High: >35%.

Acknowledgements

We thank R. Botero (FCDS), E. Ortiz (AAF), and G. Palacios for helpful comments to earlier versions of this report.

This work was supported by the following major funders: Norwegian Agency for Development Cooperation (NORAD), Gordon and Betty Moore Foundation, International Conservation Fund of Canada (ICFC), Metabolic Studio, Erol Foundation, MacArthur Foundation, and Global Forest Watch Small Grants Fund (WRI).

Citation

Finer M, Mamani N (2020) Deforestation in the Colombian Amazon – 2020. MAAP #120.

MAAP #118: Real-time Amazon Fire Monitoring App

In time for the next fire season, we are relaunching an improved version of our Amazon real-time fire monitoring app, hosted by Google Earth Engine.

Image 1. First Major Amazon fire of 2020, in Mato Grosso, Brazil. Data: Planet.

When fires burn, they emit gases and aerosols.* A new satellite  (Sentinel-5P from the European Space Agency) detects these aerosol emissions.*

The major feature of the app is user-friendly and real-time identification of major fires across the Amazon, based on the aerosol emissions detected by Sentinel-5P.

The app also contains the commonly-used “fire alerts,” which are satellite-based data of temperature anomalies.*
.
Thus, the user combine data from the atmosphere (aerosol) with data from the ground (temperature) to pinpoint the source of major fires.

Since the data updates daily and is not impacted by clouds, real-time monitoring really is possible. Our goal is to upload each day’s new image by midnight.

Using the app, we recently identified the first major Amazon fire of 2020 on May 28, in the state of Mato Grosso in Brazil. It was burning an area recently deforested in July 2019.

Below, we provide instructions on how to use the app, with the May 28 fire as an example.

Instructions &
How We Identified First Major Brazilian Amazon Fire of 2020

Step 1. Open real-time fire monitoring app, hosted by Google Earth Engine. Scan the Amazon for aerosol emissions of major fires (indicated in yellow, orange, and red). In this case, we spotted elevated emissions in the southeast Brazilian Amazon (on May 28, 2020).

Screenshot of Fire App hosted by Google Earth Engine


Step 2. Click the “Layers” menu in the upper right for more options. For example, clicking “State/Department Boundaries” we see the emissions are coming from Mato Grosso. Note you can also add “Protected Areas” and check the dates of the images and alerts.


Screenshot of Fire App hosted by Google Earth Engine


Step 3. Zoom in on the aerosol emissions.

Screenshot of Fire App hosted by Google Earth Engine


Step 4. Adjust (slide down) the transparency of the emissions layer to see the underlying fire alerts. We use the alerts to pinpoint the source of emissions (see purple circle). Obtain coordinates of the alerts by clicking on the map and then checking the “Coordinates” bar on the left  (below  Instructions).

Screenshot of Fire App hosted by Google Earth Engine


Step 5. We entered the coordinates into Planet Explorer and found a high-resolution image for that same day (May 28), confirming the first major Amazon fire of 2020. The burned area was 357 hectares (882 acres).Planet Explorer Screenshot of Satellite image of fire


Predicting 2020 Brazilian Amazon Fires

Using the  Planet archive, we discovered that this exact area was deforested between July and August 2019, and then burned in May 2020. This fits our recent major finding that many Brazilian Amazon fires are actually burning recently deforested areas (MAAP #113). For more on how to predict upcoming fires based on recent deforestation, see MAAP #119.

Planet Explorer Screenshot of Satellite image of fire


2020 Fire Forecast

The July – September 2020 forecast points to an active fire season in most of the western Amazon – much of central and southern Peru, northern Bolivia and the Brazilian states of Acre and Rondônia. This year’s forecast indicates an active fire season of similar magnitude to those of 2005 and 2010, when widespread fires were observed in the region.

To more information check:https://firecast.cast.uark.edu/


*Notes

  • Aerosol definition: Suspension of fine solid particles or liquid droplets in air or another gas.
  • The high values in the aerosol indices (AI) may also be due to other reasons such as emissions of volcanic ash or desert dust. Hence, some areas, such as the Salar de Uyuni, in western Bolivia, often have orange or red tones.
  • The spatial resolution of the aerosol data is 7.5 sq km
  • The fire alerts are satellite-based data of temperature anomalies on the ground at 375 m resolution.
    .
  • Coordinates of first major 2020 Amazon fire: 11.92° S, 54.06° W
    .
  • Here is link to short story about second major 2020 Amazon fire, also in Mato Grosso, on June 8. It burned an area deforested in 2018. Coordinates: 12.56° S, 54.03° W.

References

Gorelick, N., Hancher, M., Dixon, M., Ilyushchenko, S., Thau, D., & Moore, R. (2017). Google Earth Engine: Planetary-scale geospatial analysis for everyone. Remote Sensing of Environment.”
https://earthengine.google.com/faq/

Acknowledgements

We thank E. Ortiz, S. Novoa, K. Fernandes, G. Palacios for helpful comments to earlier versions of this report.

This work was supported by the following major funders: USAID/NASA (SERVIR), Global Forest Watch Small Grants Fund (WRI), Norwegian Agency for Development Cooperation (NORAD),  International Conservation Fund of Canada (ICFC), Metabolic Studio, and Erol Foundation.

Citation

Finer M, Villa L, Mamani N (2020) Real-time Amazon Fire Monitoring App. MAAP: #118.