Although August was severe, early September saw the Brazilian Amazon fires intensify even more.
September shot up to an average of 53 major fires per day across the Brazilian Amazon, up from 18 in August (and 2 in July).*
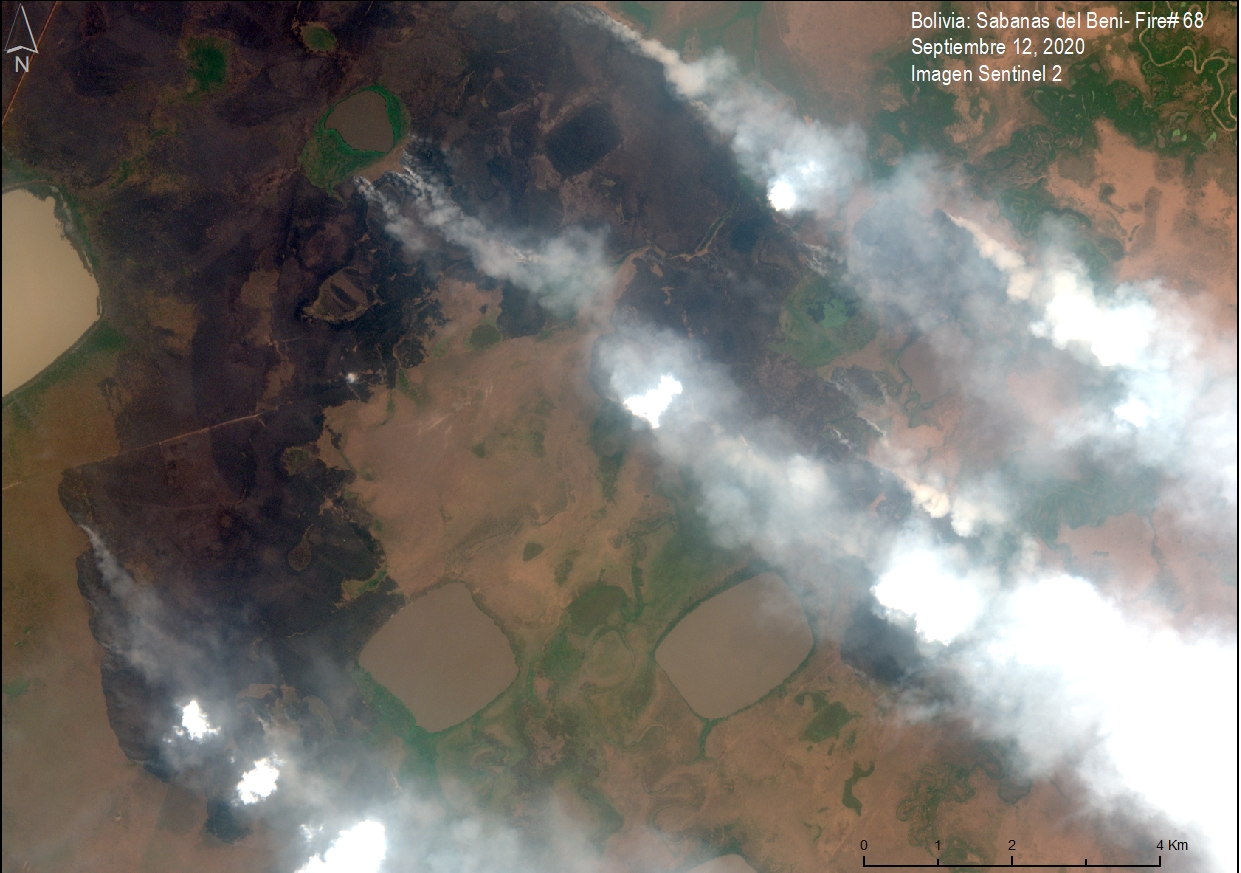
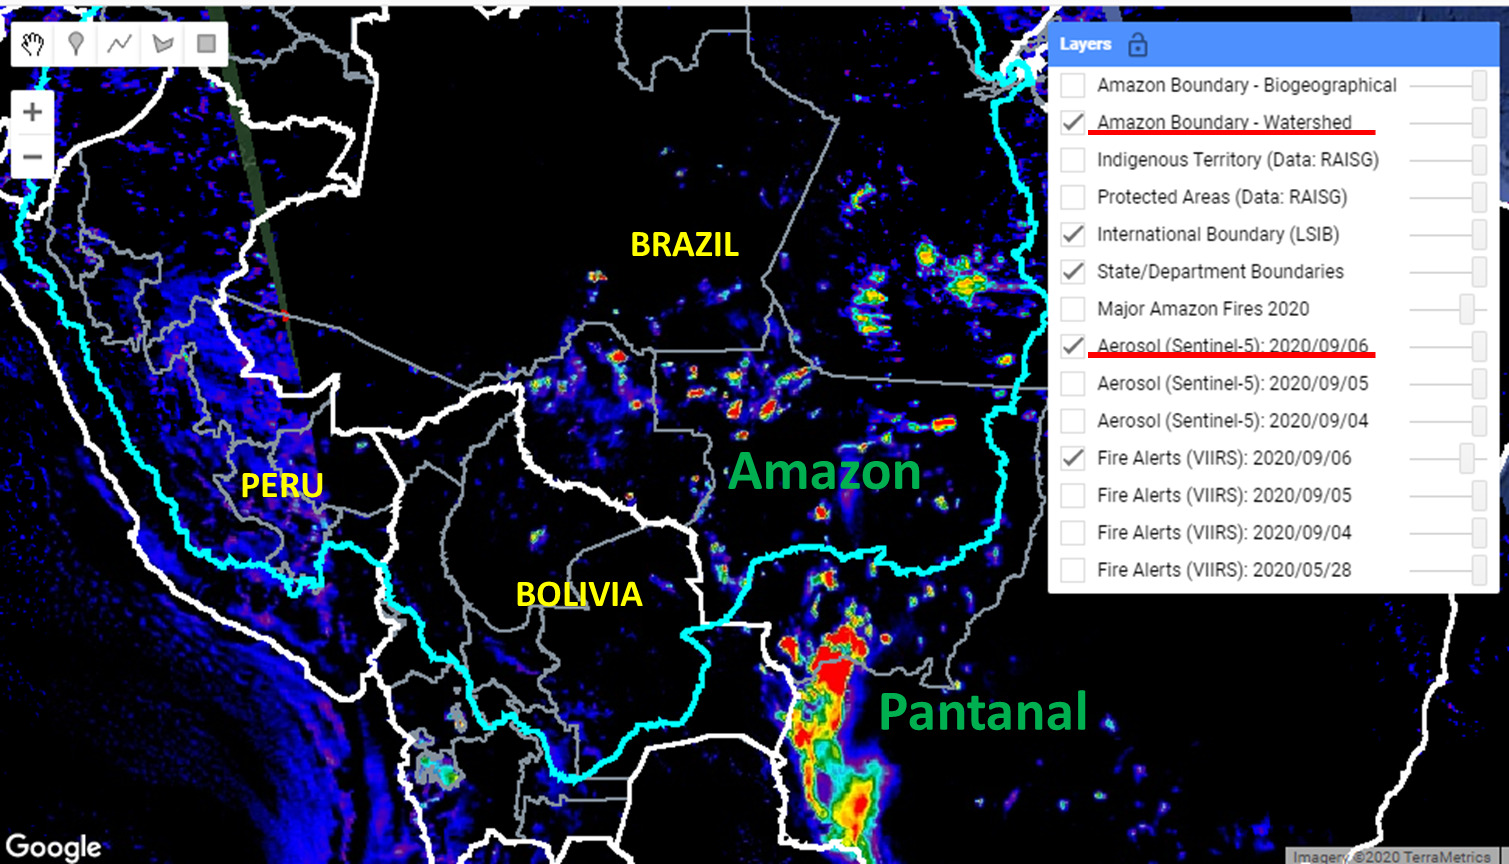
In addition, the surrounding Pantanal, the world’s largest tropical wetlands, is experiencing unprecedented fires.
The Base Map shows major fires scattered across the Brazilian Amazon in relation to the huge fire complex to the south in the Pantanal, as seen in our novel real-time fire monitoring app from early September.

Base Map. Amazon fires in relation to Pantanal fires as seen in our Real-time Amazon Fire Monitoring app (September 6). Red indicates most severa fires. Data: MAAP/ACCA.
Red indicates the most intense fires burning the highest levels of biomass.
Overall, we have now detected 963 major fires this year in the Brazilian Amazon with the app.
*Data updated through September 7, 2020.
Increase in Amazon Forest Fires
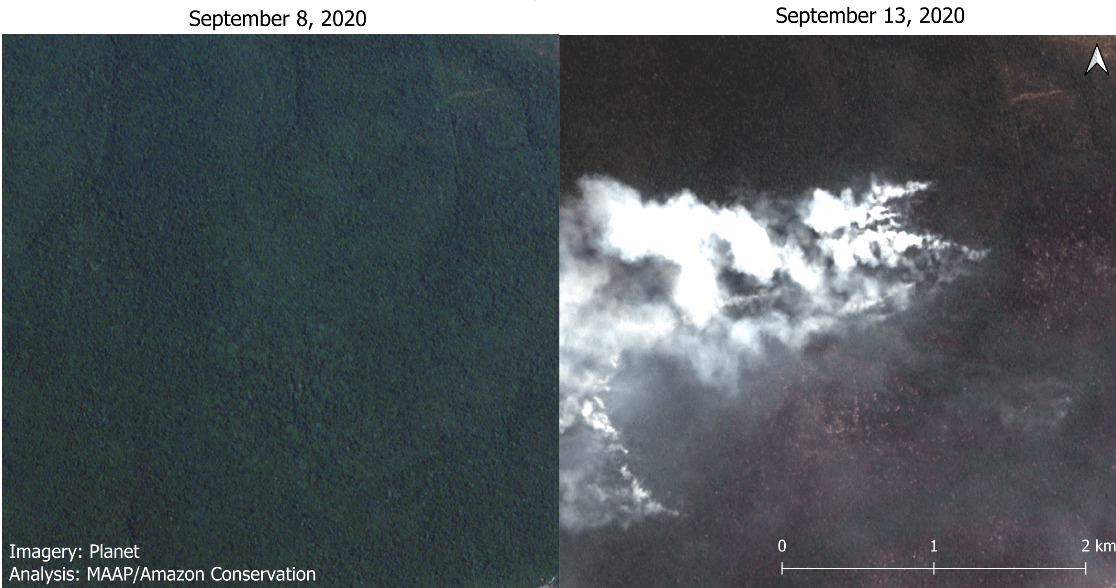
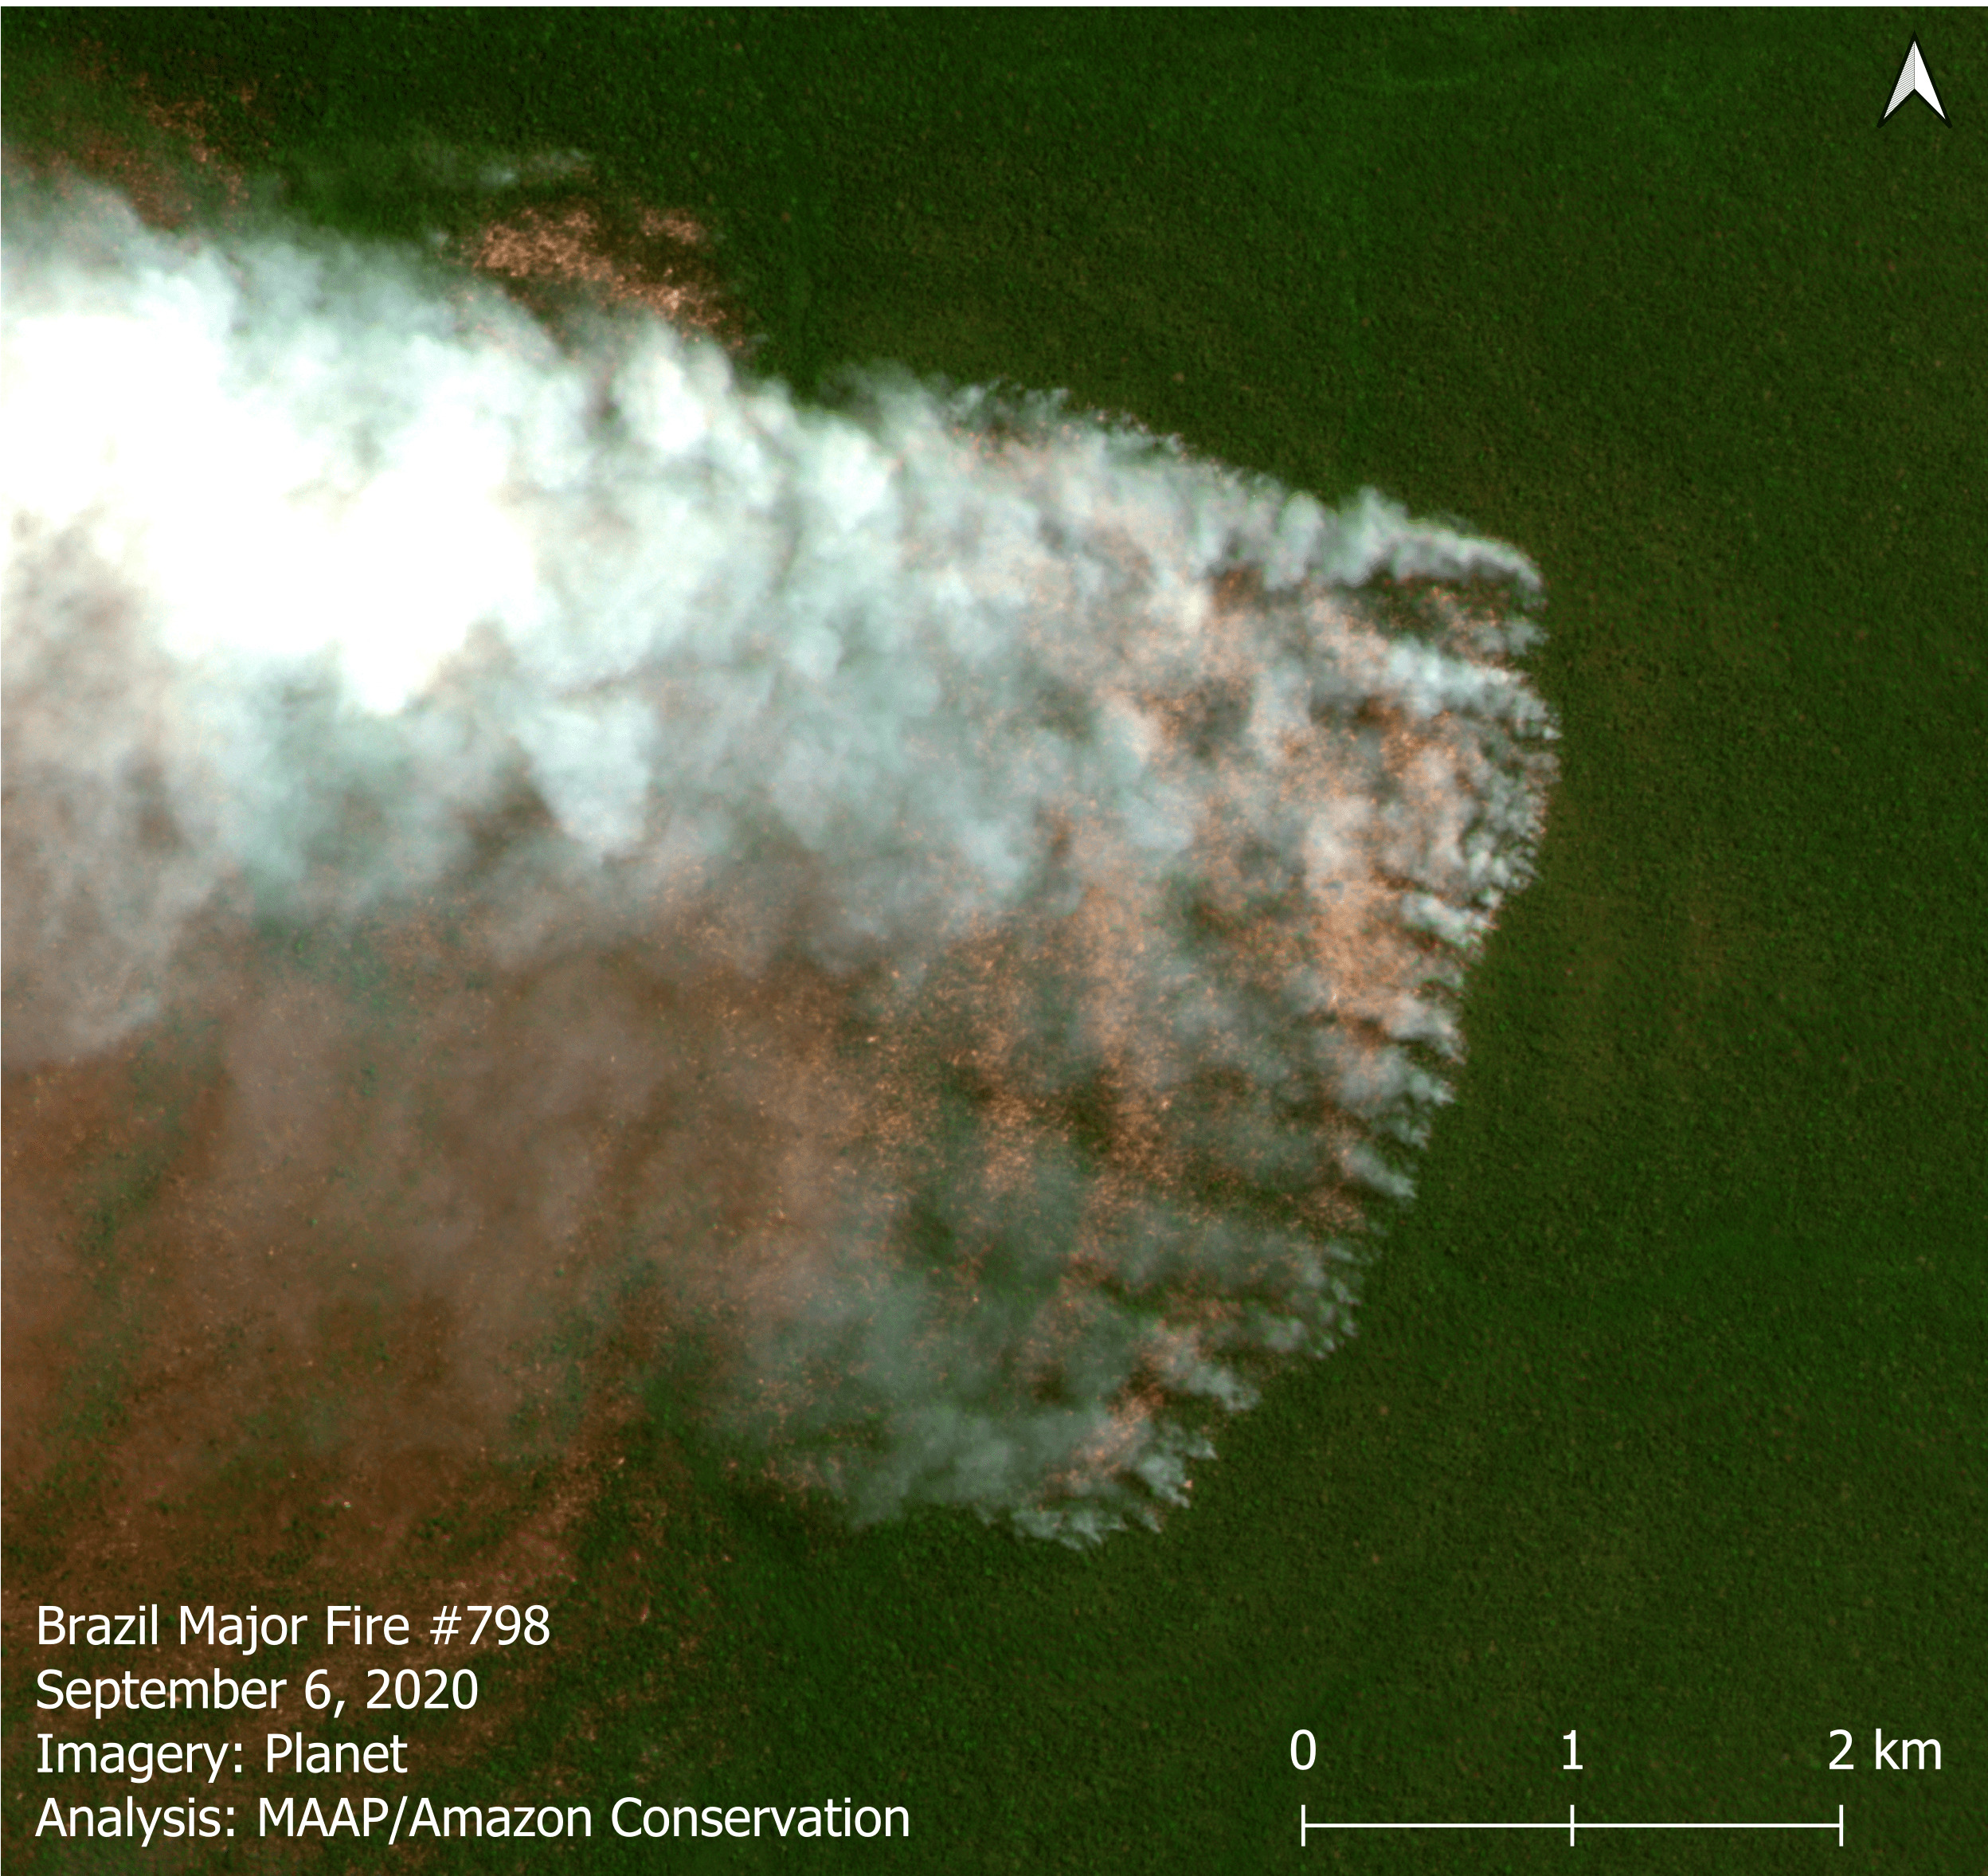
Also noteworthy is the major spike in Amazon forest fires, defined here as human-caused fires in standing forest. Forest fires now account for a striking 27% of all major fires, up from 13% in August (and 1% in July).
An estimated 896,000 acres (362,000 hectares) have been impacted by these Amazon forest fires.
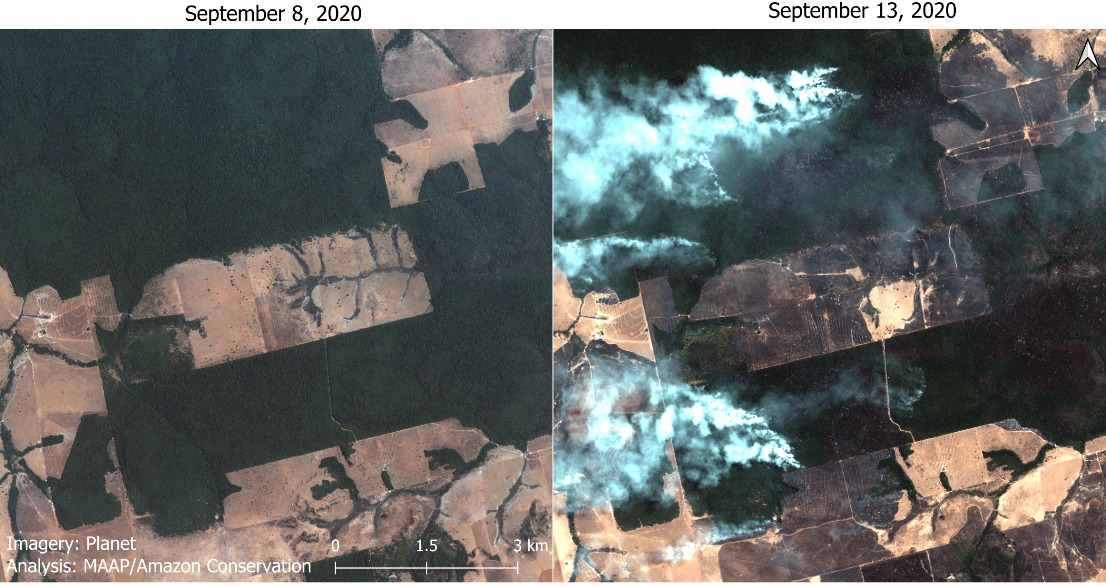
The majority of the major fires (66%) continue to burn recently deforested areas, defined here as areas where the forest was previously and recently cleared (between 2018-20) prior to burning.
In fact, over 1.3 million acres (540,000 hectares) of recently deforested areas has burned in 2020.

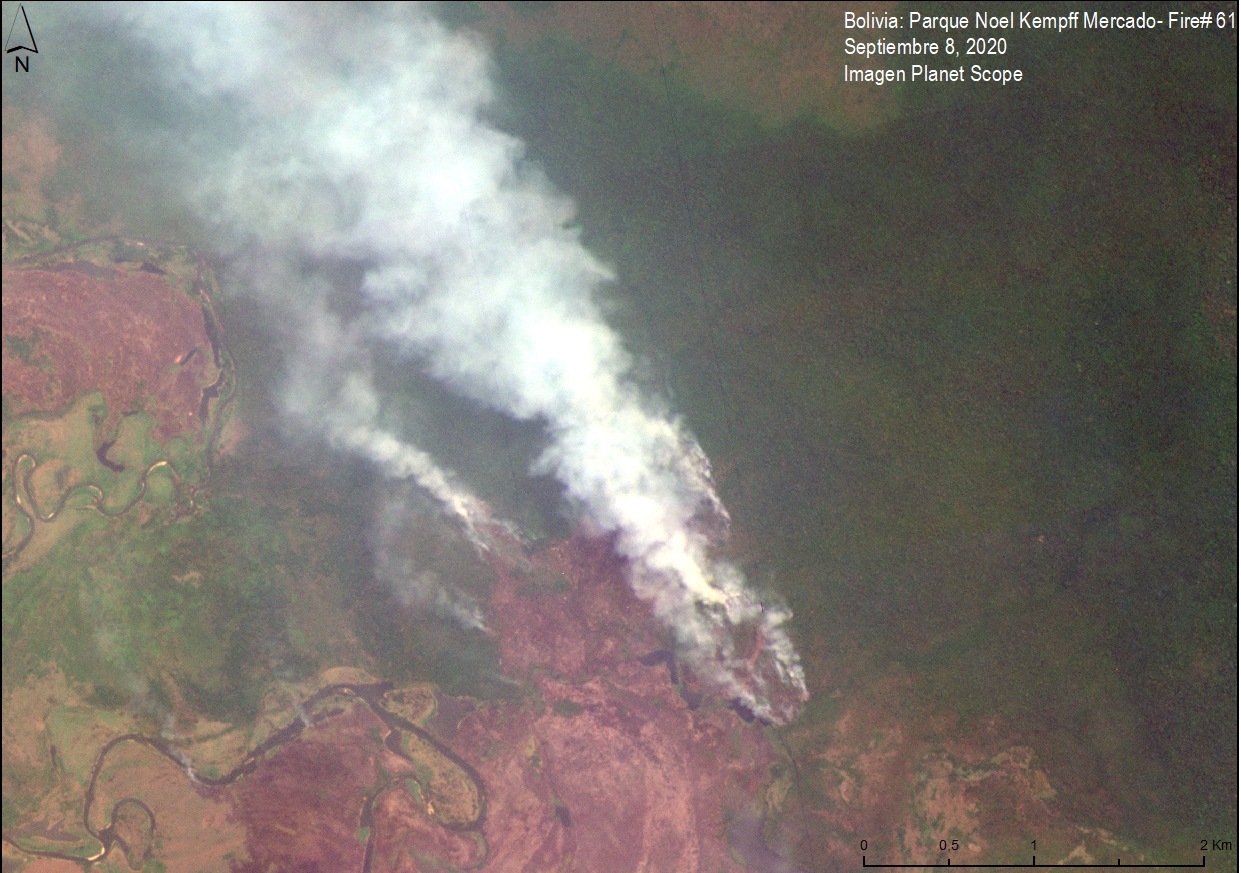
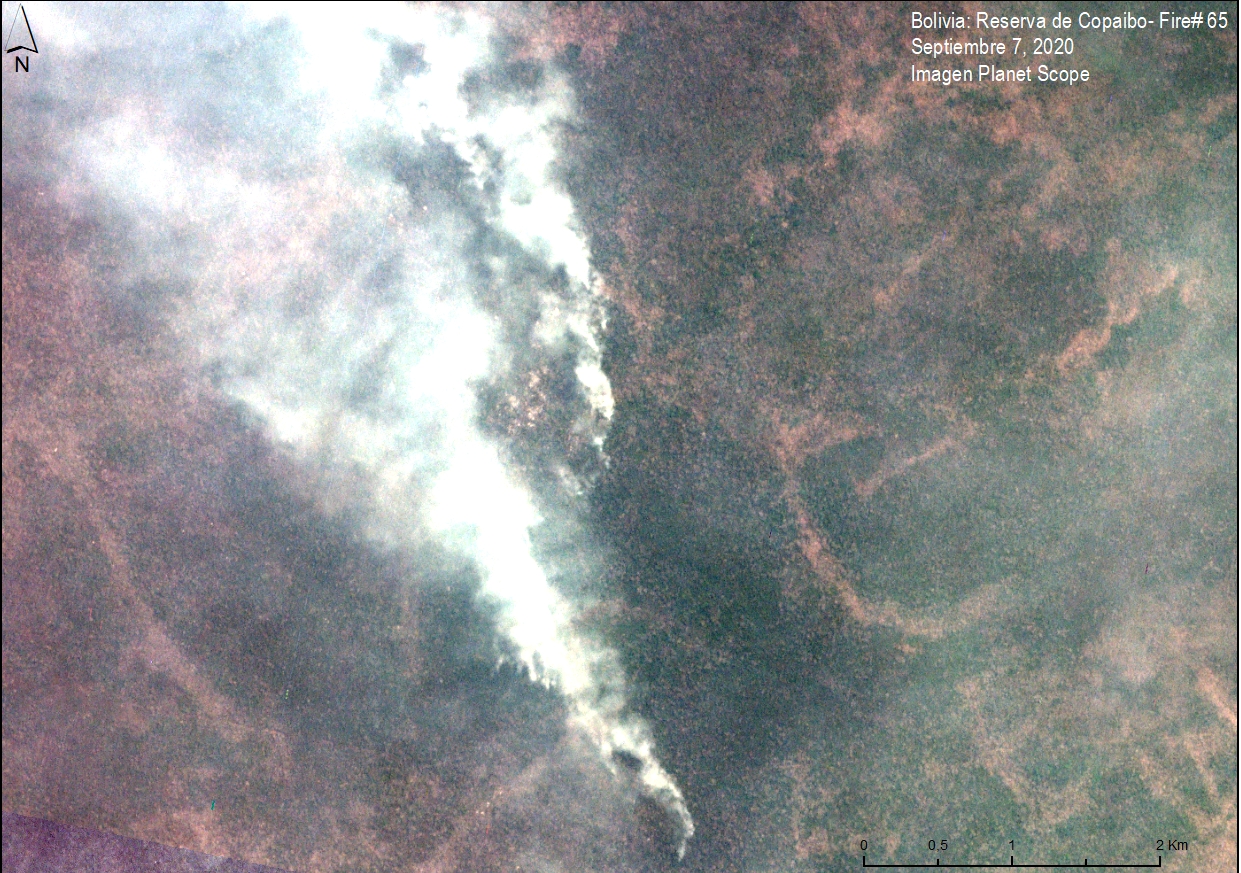
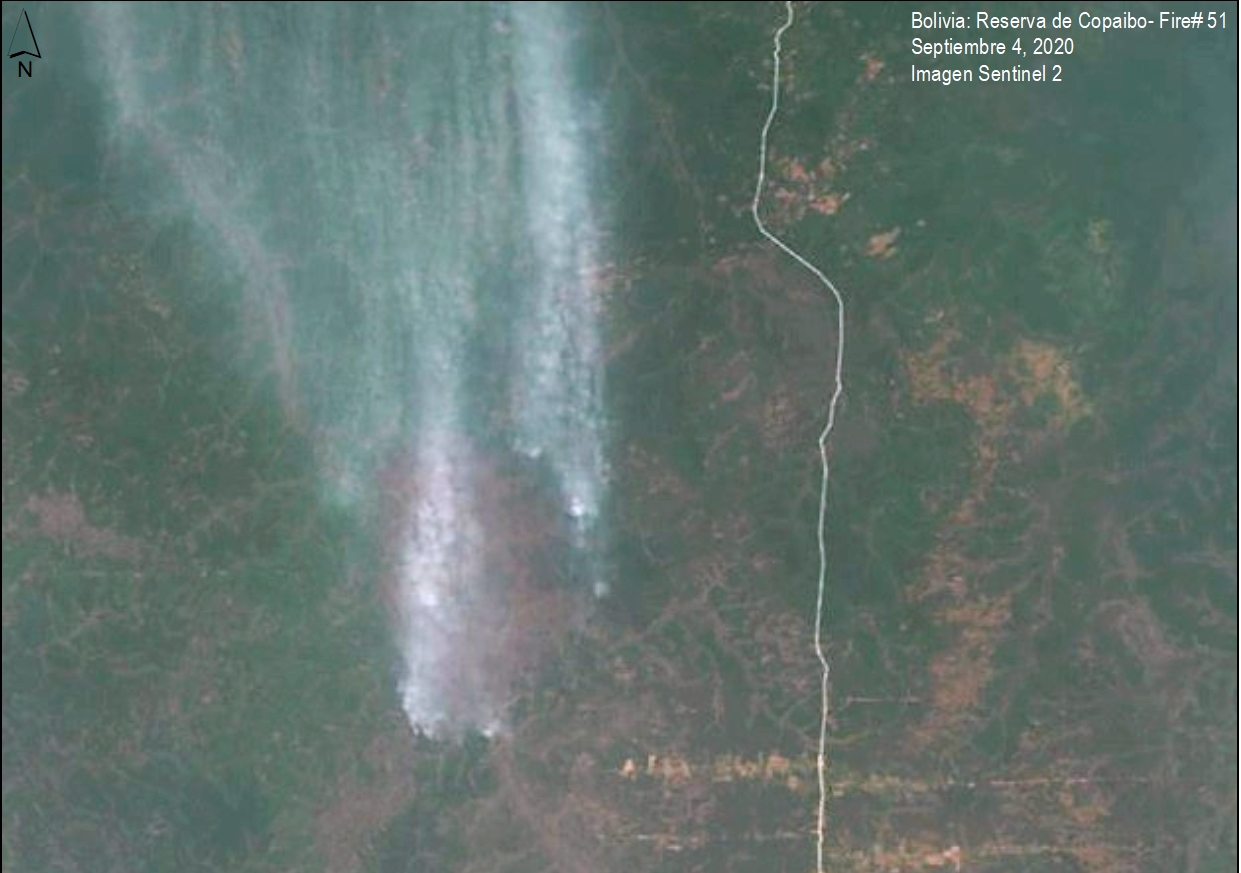
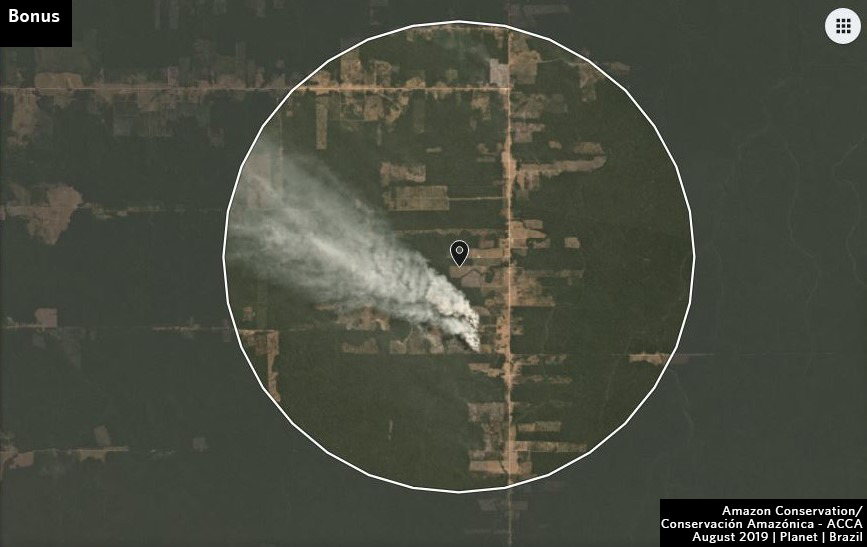
A major forest fire in the Brazilian Amazon (Mato Grosso) on September 6, 2020. Data: Planet. Analysis: MAAP/ACCA, SERVIR.
Thus, most of the fires are actually a smoking indicator of the current rampant deforestation in the Brazilian Amazon.
Protected Areas and Indigenous Territories
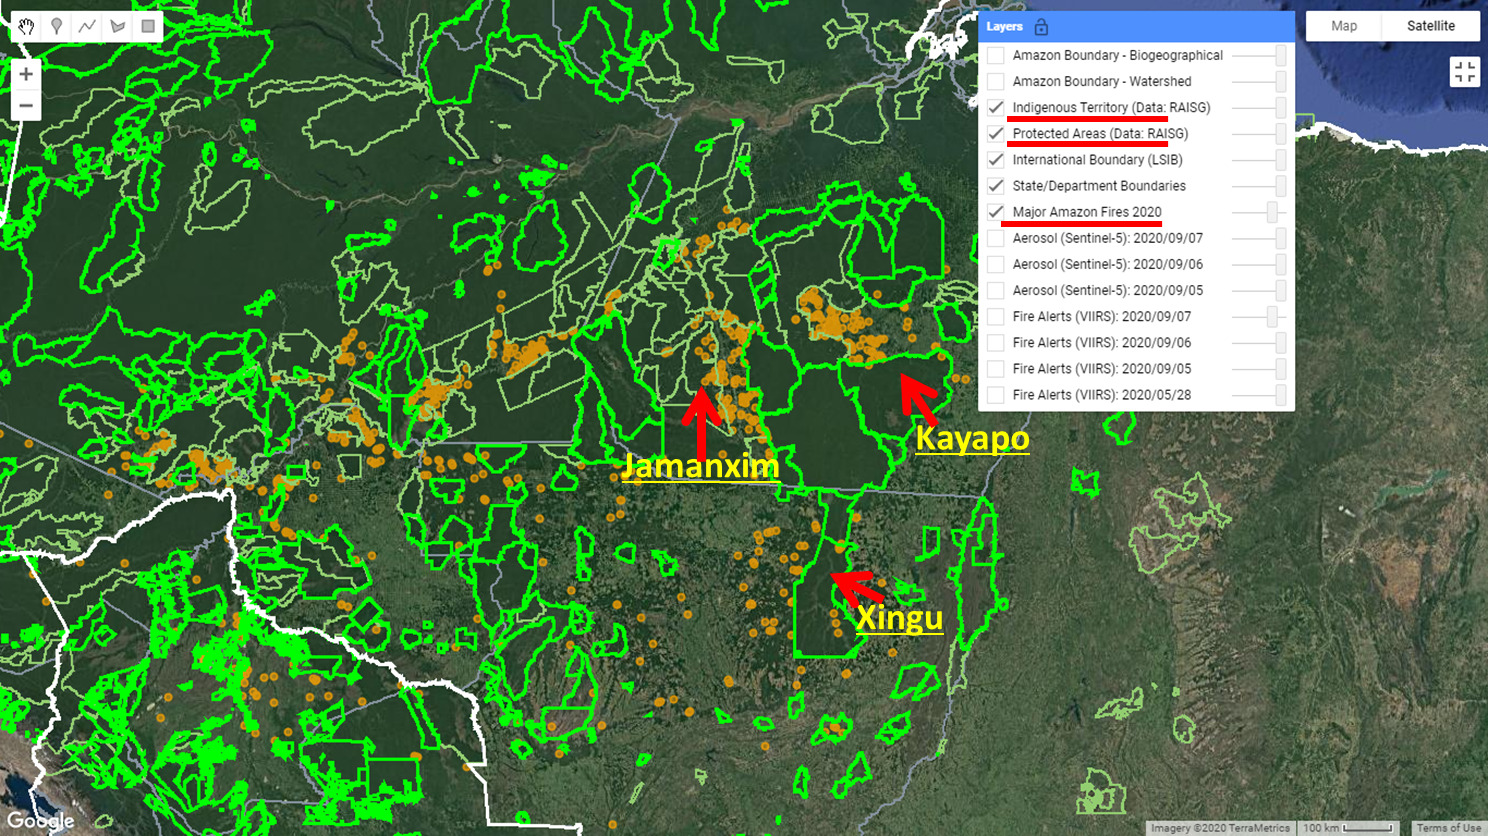
We also must highlight that we have detected 80 major fires in protected areas and indigenous territories of the Brazilian Amazon. The most impacted areas are the Xingu and Kayapó indigenous territories, and Jamanxim National Forest.
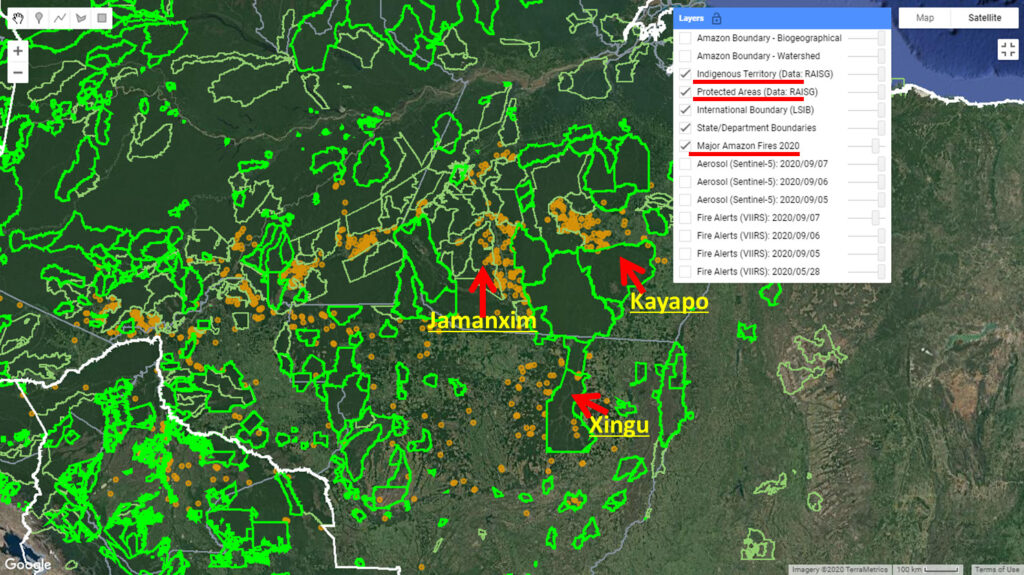
Major Fires (orange dots) within and around indigenous territories (bright green) and protected areas (light green) in the eastern Brazilian Amazon. Data: MAAP.
*Notes and Methodology
Our novel Real-time Amazon Fire Monitoring app
Data updated as of September 7, starting from the first major fire detected on May 28.
We detected 569 major fires during August in the Brazilian Amazon.
Prior to August, we detected only one forest fire, and that was on July 31.
The app specializes in filtering out thousands of the traditional heat-based fire alerts to prioritize only those burning large amounts of biomass (defined here as a major fire).
In a novel approach, the app combines data from the atmosphere (aerosol emissions in smoke) and the ground (heat anomaly alerts) to effectively detect and visualize major Amazon fires.
When fires burn, they emit gases and aerosols. A new satellite (Sentinel-5P from the European Space Agency) detects these aerosol emissions. Thus, the major feature of the app is detecting elevated aerosol emissions which in turn indicate the burning of large amounts of biomass. For example, the app distinguishes small fires clearing old fields (and burning little biomass) from larger fires burning recently deforested areas or standing forest (and burning lots of biomass).
We define “major fire” as one showing elevated aerosol emission levels on the app, thus indicating the burning of elevated levels of biomass. This typically translates to an aerosol index of >1 (or cyan-green to red on the app). To identify the exact source of the elevated emissions, we reduce the intensity of aerosol data in order to see the underlying terrestrial heat-based fire alerts. Typically for major fires, there is a large cluster of alerts. The major fires are then confirmed, and burn areas estimated, using high-resolution satellite imagery from Planet Explorer.
See MAAP #118 for additional details on how to use the app.
No fires permitted in the Brazilian state of Mato Grosso after July 1, 2020. No fires permitted in all of Brazilian Amazon after July 15, 2020. Thus, we defined “illegal” as any major fires detected after these respective dates.
A major fire may be classified as burning across multiple land categories (for example, both recently deforested area and surrounding forest fire) so those percentages do not total 100%.
There was no available Sentinel-5 aerosol data on July 4, 15, and 26.
Acknowledgements
The app was developed and updated daily by Conservación Amazónica (ACCA). The data analysis is led by Amazon Conservation in collaboration with SERVIR Amazonia.
Citation
Finer M, Vale H, Villa L, A. Ariñez, Nicolau A, Walker K (2020) Brazilian Amazon Fires Intensify in September. MAAP.

 We thank A. Felix (USAID Prevent), M.E. Gutierrez (ACCA), and G. Palacios for their helpful comments on this report.
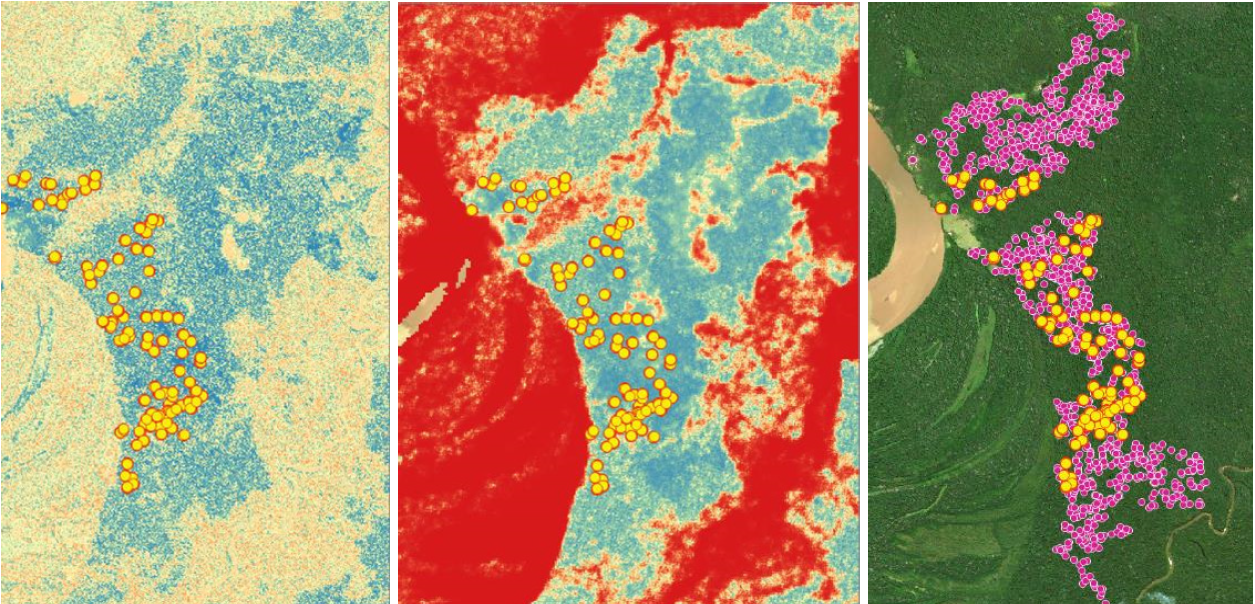

 are cared for by local staff at the station, hatching between 65-80 days after being laid. Once the eggs have hatched, the baby turtles are kept in conditioned water ponds to monitor their growth until they are large enough to be released into their natural habitat. Of this batch, 85% of the eggs were hatched.
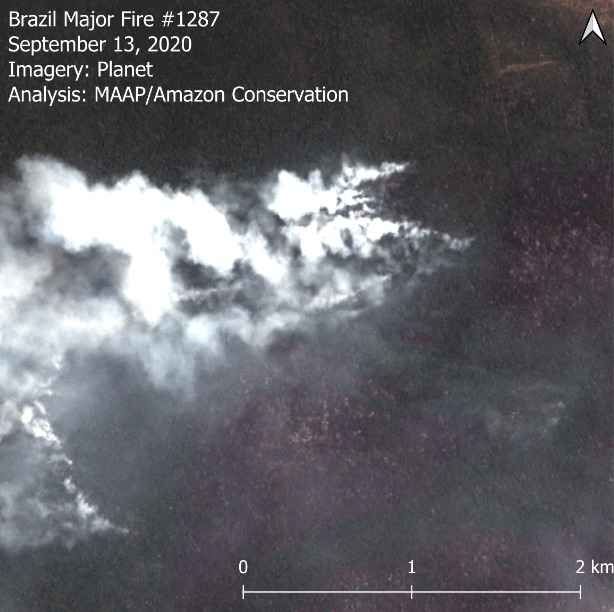


 Loading...