Jaguars are indicative of a healthy forest; as apex predators, they play a significant role in controlling the populations of other species which helps maintain balance in the food chain and environment. However, in many of the communities surrounding the Manuripi National Amazon Wildlife Reserve in the Bolivian Amazon, jaguars were not perceived in a positive light as the communities experienced attacks on some of their livestock. Thus we launched a project to help address these conflicts: “Human-Jaguar Conflict in the Bolivian Amazon: A participatory Approach to Changing Attitudes and Behaviors”, aimed at better understanding and reducing human-jaguar conflicts.
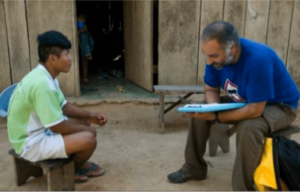 We interviewed 169 people from five communities inside the reserve and 137 people from three communities in the surrounding Tacana II territory to evaluate the level of human-jaguar conflicts. From the information gathered from the interviews, we developed educational activities to increase knowledge and reduce the negative perception of jaguars in adults and children within these communities.
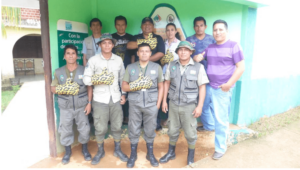
We organized six educational and outreach activities in five targeted communities inside the Manuripi. Around 100 people attended our activities in the communities while activities in the schools educated around 90 children. One of the workshops we organized was “Methods to Reduce Large Cats Attacks on Cattle”, with support from the Cattle Rancher Association of Pando and participation from both the NGO Panthera and a Bolivian veterinary products company, LAFAR. The seminar was well-attended by cattle ranchers, veterinarian students, local university staff, and local Pando Government officials, so much so that the Cattle Ranchers Association subsequently agreed to search for funding to apply 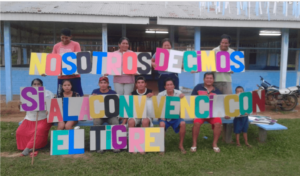 some of the innovative, forest-friendly methods presented there to reduce cattle predation in pilot ranches.
Additionally, Amazon Conservation invited a Brazilian expert in human-wildlife conflict, Dr. Silvio Marchini, to present the course “Human Dimensions of Wildlife Conservation” to the Environmental Agency of Pando and the University of Pando. Those who attended this five-day course left with both theoretical and practical understanding of how to improve the management of natural resources and livestock in a way that alleviated pressure on jaguar populations.
 Our post-events questionnaire revealed improvement in beliefs, perception, attitudes and tolerance. After the community workshops both in schools and the community, the project seemed to have had a significant impact on the project participants. The risk perception towards jaguars reduced by 10%, while the tolerance and positive perceptions have increased in approximately 18% in the communities involved in the project. This is a great first step in changing the long-held beliefs individuals have of jaguars, to help the long-term conservation of this threatened species.
These communities have also agreed on an action to plan to reduce conflicts. Through a framework that encouraged community participation, we developed 3 Action Plans for reducing human-jaguar conflict, and almost % of community members formally committed to implementing them in their forest homes. Both the course and workshop received positive feedback as well as raised awareness and interest among students, government staff, and cattle ranchers, chipping away at myths to help reduce human-jaguar conflicts.
 Carter Cohen is no average fifth grader. At the young age of 10 years old, he already feels a deep connection to nature and all types of creepy-crawlers. His love for bugs started when he was just 4 years old and first saw an insect and noticed all of its intricate features. “Each insect has a specific way of hunting,” he says enthusiastically, “and each one adapts to its surroundings.
 The more you learn about bugs the more interesting they get!”. He often finds himself going on field trips with his friend Sean and his parents to discover new species of insects. “I like bugs, arthropods, insects, arachnids, and most insects,” Carter says. He cites the praying mantis, stick bugs, and leaf bugs among his favorite species.


 Last year, we had the honor of hosting former President Obama’s daughter Malia Obama at our
  As the world’s largest rainforest covering nine countries, the Amazon rainforest has been known as Earth’s lungs for generations. However, as a resource-rich forest, it continues to be deforested at staggering rate. To combat that, our
  Loading...