New UN report shows that protecting and restoring forests and wetlands is a key climate change mitigation strategy

The Intergovernmental Panel on Climate Change (IPCC), the United Nations body for assessing the science related to climate change, has released a new report on the intersection of climate change and land use. 

The report analyzed over 7,000 scientific publications on the topics of land-climate interactions, including land degradation, desertification, and food security. It found that changes in land conditions, either from land-use or climate change, affect global and regional climate, and at the regional scale, these negative conditions can reduce or accentuate warming and affect the intensity, frequency, and duration of extreme climate events.
Manu National Park, Peru – August 06, 2017: Family of Capybara at the shores of the Amazon rainforest in Manu National Park, Peru

The report also found that in order to keep warming to 1.5ºC or well below 2°C as recommended by the Paris Agreement, major changes in how we use land need to take place. Sustainable land management, including sustainable forest use, can prevent and reduce land degradation, maintain land productivity, and sometimes reverse the adverse impacts of climate change on nature and people.

IPCC concluded that one of the central strategies to mitigate climate change is to protect the forests and wetlands that are still standing and to restore as much of the currently degraded land as possible. This is the type of conservation action we are taking in the headwaters of the Amazon – one of the last wild places left on Earth. By creating new conservation areas, empowering forest users and farmers to use land and natural resources sustainably, and reforesting degraded land, we help mitigate the effects of climate change on all of us. 

Read the IPCC full press release here.

MAAP #104: Major Reduction In Illegal Gold Mining From Peru’s Operation Mercury

Graph 1. Illegal gold mining deforestation in La Pampa, 2017-19. Data- ACA, MAAP.

In February 2019, the Peruvian government launched Operation Mercury (Operación Mercurio), a major multi-sectoral crackdown on the illegal gold mining crisis in the area known as La Pampa,* located  in the southern Peruvian Amazon (Madre de Dios region). Note that this area is not within Tambopata National Reserve, but in its buffer zone.

In this report, we present the results of our analysis on the initial impacts of this Operation.

We found a major reduction in gold mining deforestation in La Pampa in 2019, compared to the same time period (February – June) of the previous two years (see Graph 1).

In fact, the gold mining deforestation decreased 92% between 2018 (900 hectares) and 2019 (67 hectares), representing the situation before and after the start of Operation Mercury.

The Base Map illustrates how the expansion of gold mining deforestation greatly dropped in 2019 compared to the two previous years, especially in the eastern front. The letters (A-C) correspond to the location of the Zooms, below.

The analysis also reveals, however, that the gold mining deforestation in La Pampa has not yet been completely eradicated and continues in numerous remote and isolated areas.


Base Map. Illegal gold mining deforestation in La Pampa. Data- ACCA, MAAP, SERNANP

Zoom A1 shows the critical eastern front of the gold mining deforestion between February (left panel) and June (right panel) 2019, the first five months of Operation Mercury. While the rapid eastward expansion of the front has greatly decreased, the red circles indicate areas where we have detected isolated mining activity.

Zoom A1. Eastern front of the gold mining deforestation in La Pampa. Data- ESA, MAAP

High Resolution Zooms


Zoom B shows the eradication of one of the biggest mining camps in La Pampa between 2018 (left panel) and 2019 (right panel).

Zoom B. Eradication of major gold mining camp. Data- Maxar

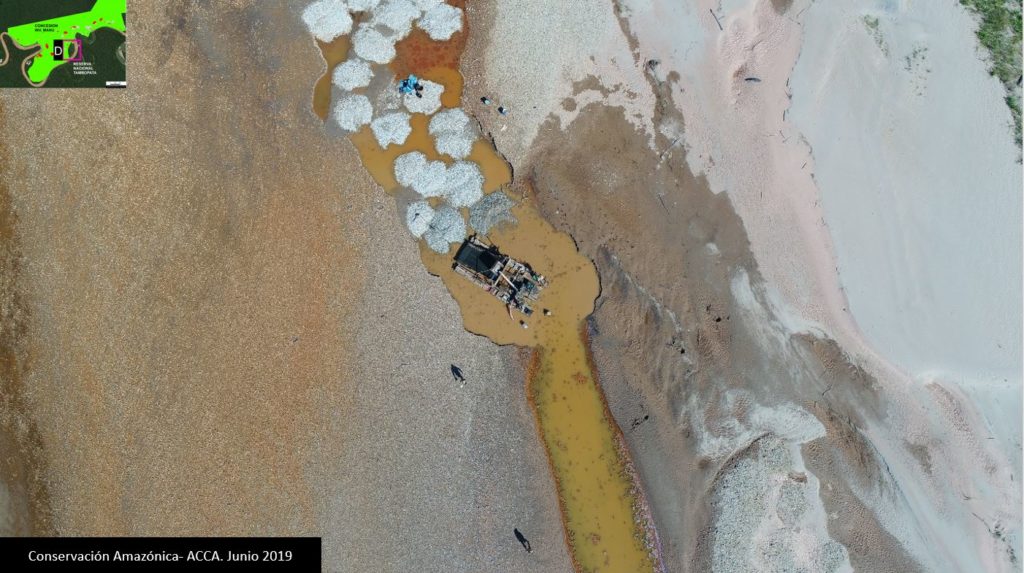
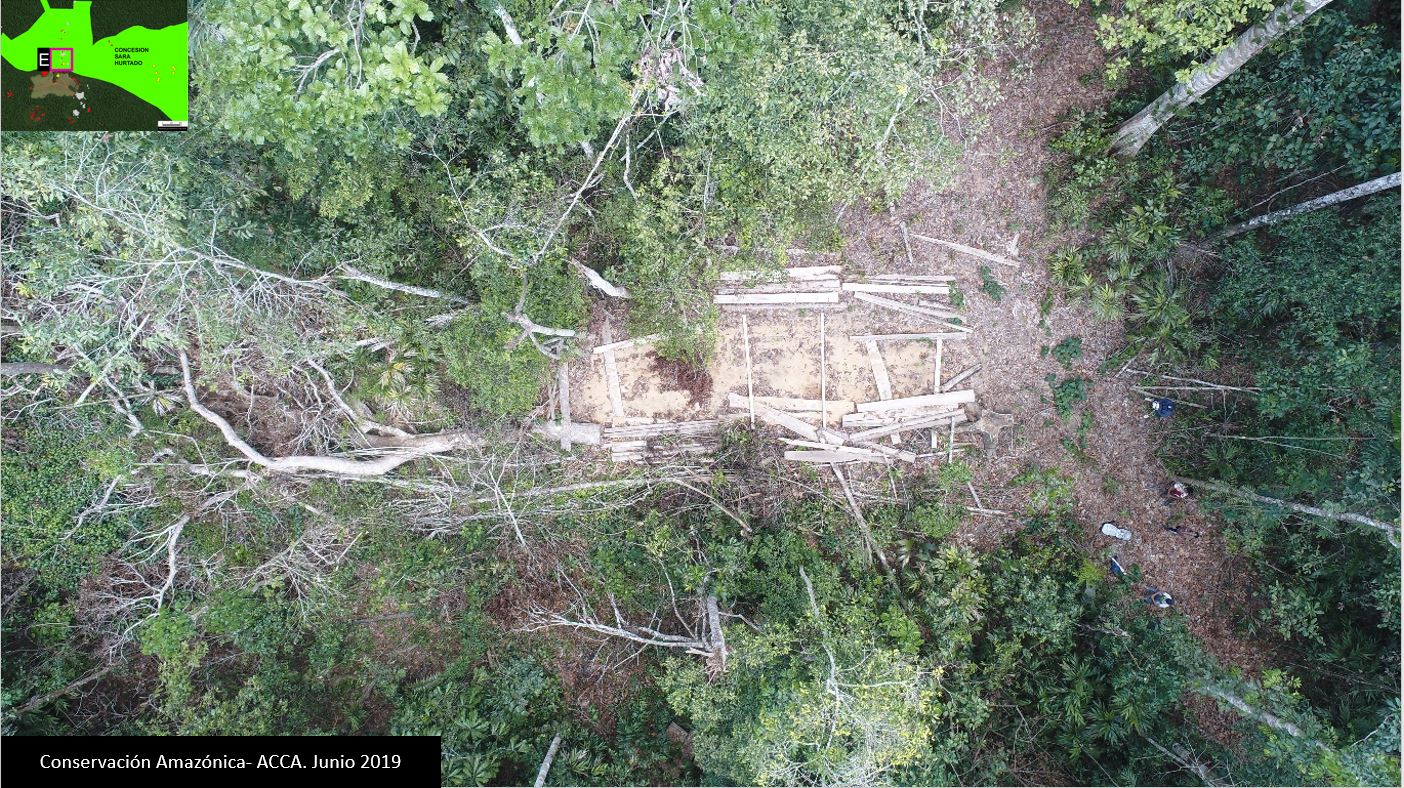
The following Zooms show examples of the persistence of isolated illegal gold mining activity and infrastructure in La Pampa, with recent (June 2019) high resolution satellite and drone images. The letters (A2, C1, C2) correspoind to the Base Map, above.

Zoom A2. Data- Maxar, MAAP

Zoom C1. Data- ACCA
Zoom C1. Data- ACCA

Zoom C2. Data- ACCA.


Google Earth Engine App

We present a new app, developed with Google Earth Engine, that allows an interactive visualization of the evolution of gold mining deforestation in La Pampa. The app allows the user to take advantage of Google’s powerful computers to compare (with a slider) different dates from a large archive of Sentinel-1 satellite images (see screenshot, below). Sentinel-1 is radar, so there are no clouds in the images.

https://luciovilla.users.earthengine.app/view/mining-monitoring-by-sar-sentinel-1

Screen shot of the app. Data- ESA, MAAP


Notes 

*La Pampa is the sector located in the buffer zone of Tambopata National Reserve, delimited by the northern boundary of the reserve, the Malinowski River and the Interoceanic Highway.

Full study area of La Pampa (shaded). Data: ACCA, MAAP.

Acknowledgements

We thank S. Novoa (ACCA), H. Balbuena (ACCA), E. Ortiz (AAF), T. Souto (ACA), P. Rengifo (ACCA), A. Condor (ACCA), y G. Palacios for helpful comments on earlier drafts of this report.

This work supprted by the following funders:  Norwegian Agency for Development Cooperation (NORAD), International Conservation Fund of Canada (ICFC), MacArthur Foundation, Metabolic Studio, and Global Forest Watch Small Grants Fund (WRI).

Citation

Villa L, Finer M (2019) Major Reduction in Illegal Gold Mining from Peru’s Operation Mercury. MAAP: 104.

Peru’s Operation Mercury, a win for forests: We observed a 92% decrease in deforestation

Peru's Operation Mercury, a win for forests- We observed a 92% decrease in deforestationEarlier this year, the government of Peru launched a multi-sectoral and comprehensive mega-operation aimed at eradicating illegal mining and associated crime in La Pampa, Peru, called Operation Mercury. The operation came about in part after Amazon Conservation, through our real-time monitoring program, provided the Peruvian government with key information on the location of illegal mining camps that enabled the government to take coordinated action.

The operation, named after the mercury contaminant that is released into the water as a byproduct of the mining process, took the information we provided and began major efforts to stop the widespread deforestation in the area caused by illegal miners, improve development in the region, and deter other illicit activities such as sex trafficking and child labor that take place in mining camps.

Using our real-time satellite technology and drone overflights, we have been assessing the success of the operation in stopping illegal gold mining. To date, we have found a major reduction in deforestation from gold mining in La Pampa due to the operation. Gold mining-based deforestation has decreased by 92% between 2018 (2,200 acres) and 2019 (165 acres), comparing the situation before and after the start of Operation Mercury.

Despite its significant success, the gold mining deforestation in La Pampa has not yet been completely eradicated and continues in numerous remote and isolated areas, as we show in our latest MAAP report. However, the results of the operation are a big win for conservation, as they show that strong government action can help curb illegal deforestation. And when action does take place, we have seen that forests begin to recover and grow back.  

Amazon Conservation will continue to assess the progress of the operation, and work closely with the government to produce fact-based reports that can be turned into action on the ground.

New York Times Op-Ed: Our Co-Founder Enrique Ortiz comments on how to save the Amazon 

Our Co-Founder and Ecologist Enrique Ortiz made the news recently through an opinion piece on what can be done to reverse current trends in deforestation and ensure that economic development in the Amazon is not at odds with conservation.

Although deforestation in the Amazon is on the rise, Ortiz highlights that recent success stories show that policies could be established to reverse the trend, at a relatively low cost compared with other climate change mitigation strategies. Incentives for small- and large-scale producers can promote sustainable agricultural practices when farmers tap into underutilized land and improve efficiencies, and economic incentives could encourage reforestation.

Amazon Conservation is implementing many of these conservation solutions on the ground right now, including training farmers and forest users on how to conserve their land and showing them the economic benefits of conservation. Forest users working with Amazon Conservation have seen significant increases in their income because the forest products they harvest are coming from healthier forests. 

Read the full article at The New York Times.

MAAP #102: Saving The Ecuadorian Chocó

Chocó endemic, Long-wattled Umbrellabird. ©Stephen Davies

Chocó endemic, Long-wattled Umbrellabird. ©Stephen Davies

The Ecuadorian Chocó, located on the other (western) side of the Andes Mountains from its Amazonian neighbor, is renowned for its high levels of endemic species (those that live nowhere else on Earth).

It is part of the “Tumbes-Chocó-Magdalena” Biodiversity Hotspot, home to numerous endemic plants, mammals, and birds (1,2), such as the Long-wattled Umbrellabird.

It is also one of the most threatened tropical forests in the world (1).

Here, we conduct a deforestation analysis for the northern Ecuadorian Chocó (see Base Map below) to better understand the current conservation scenario. Importantly, we compare the original forest extent (left panel) to the actual forest cover (right panel).

We document the loss of over 60% (1.8 million hectares) of low, mid, and upper elevation forest (compare the three tones of green between panels).

See our other Key Results below.


Base Map

Base Map. Ecuadorian Chocó, original forest extent (left panel) vs. actual forest cover (right panel). Data- MAE, Hansen:UMD:Google:USGS:NASA


Key Results

Our key results include:*


Key Results, Ecuadorian Chocó. Data- MAAP, MAE, Hansen:UMD:Google:USGS:NASA
  • 61% forest loss (1.8 million hectares) across all three elevations.
    • 68% loss (1.2 million ha) of lowland rainforest,
    • 50% loss (611,200 ha) of mid and upper elevation forests.
      .
  • 20% of the forest loss (365,000 ha) occurred after 2000.
    • 4,650 ha lost during most recent 2017-18 period (mostly in lowlands).
  • 39% total forest remaining (1.17 million ha) across all three elevations.
    • Just 32% (569,000 ha) lowland rainforest remaining.
  • 99% of Cotacachi-Cayapas Ecological Reserve remaining.
  • 61% of Mache-Chindul Ecological Reserve remaining.

*Forest loss data corresponds to the study area indicated in the Base Map. Data sources: pre-2017 from Ecuadorian Environment Ministry; 2017-18 from University of Maryland (Hansen 2013). Elevation definitions: Lowland forest <400 meters (dark green), mid-elevation forest 400-1000 m (olive green), and upper elevation forest >1000 m (bright green).


High Resolution Zooms

In the Base Map, we indicate two areas (insets A and B) where we zoom in with high-resolution satellite imagery to see what recent deforestation looks like in the region.

Zoom A shows the deforestation of 380 hectares directly to the north of an oil palm plantation, possibly for an expansion.

Zoom B shows the deforestation of 50 hectares with the Chachi Indigenous Reserve.

Zoom A. Data- Planet, ESA, MAAP
Zoom B. Data- Planet, MAAP


Conservation Opportunity

Efforts are underway to protect a critical stretch of low to mid elevation Chocó forest to the west of Cotacachi-Cayapas Ecological Reserve.

Chocó Conservation Opportunity. Data- Jocotoco Foundation, MAE, Hansen:UMD:Google:USGS:NASA.

It involves the unique opportunity to acquire over 22,000 hectares of forest that would help safeguard connectivity between public and private conservation and indigenous areas. Connecting these areas provides the only opportunity to protect the entire altitudinal gradient from 100-4900 m on the western slope of the tropical Andes. It will also establish an effective buffer zone for governmental reserves and reduce the socio-economic vulnerability of local communities.

To support this effort, please contact the Jocotoco Foundation (Martin.Schaefer@jocotoco.org) or the International Conservation Fund of Canada (carlos@ICFCanada.org).


References

1) Critical Ecosystem Partnership Fund (2005) Ecosystem Profile: Tumbes-Chocó-Magdalena. Link: https://www.cepf.net/our-work/biodiversity-hotspots/tumbes-choco-magdalena

2) Mittermeier RA et al (2011) Global Biodiversity Conservation: The Critical Role of Hotspots. Biodiversity Hotspots, 3-22.


Acknowledgements

We thank M. Schaefer (Jocotoco), C. Garcia (ICFC), D. Pogliani (ACCA), S. Novoa (ACCA), R. Catpo (ACCA), H. Balbuena (ACCA) y T. Souto (ACA) for helpful comments on earlier versions of this report.


Citation

Finer M, Mamani N (2019) Saving the Ecuadorian Chocó. MAAP: 102.

Deforestation update: Our analysis of deforestation hotspots in the western Amazon

Through Amazon Conservation’s Monitoring of the Andean Amazon Project (MAAP), we identify, analyze, track, and publicize deforestation taking place in the Amazon in real-time using high-tech, satellite imagery. We use this information to make local authorities, policymakers, and the general public aware of what is happening on the ground.

Deforestation update- Our analysis of deforestation hotspots in the western AmazonRecently, we conducted an in-depth analysis of 2018 data on forest cover loss and found that 2.5 million acres were deforested in the western Amazon (Colombia, Peru, Ecuador, Bolivia, and western Brazil) last year. An average of 5 acres was lost per minute to deforestation last year. Our additional analysis indicated that, of this total, 1.9 million acres were primary forests, which play a vital role as carbon sinks, mediators of the global water cycle and cradles of biodiversity. 

The combination of forces driving deforestation varies in each country. Land grabbing, unsustainable agricultural activities and expansion, and gold mining were among the key drivers of deforestation that we identified in this region.  

Read more on our 100th MAAP Report.

MAAP #100: Western Amazon – Deforestation Hotspots 2018 (A Regional Perspective)

For the 100th MAAP report, we present our first large-scale western Amazon analysis: Colombia, Peru, Ecuador, Bolivia, and western Brazil (see Base Map).

We use the new 2018 data for forest cover loss, generated by the  University of Maryland (Hansen et al 2013) and presented by Global Forest Watch.

These data indicate 2.5 million acres of forest cover loss in the western Amazon in 2018.*

We conducted an additional analysis that indicates, of this total, 1.9 million acres were primary forest.*

Base Map. Deforestation Hotspots in the western Amazon. Data: Hansen/UMD/Google/USGS/NASA, GFW, SERNANP, SNAP, SINAP, SERNAP, RAISG

To identify deforestation hotspots consistently across this vast landscape, we conducted a kernel density analysis (see Methodology).

The Base Map shows the hotspots in yellow, orange and red, indicating areas with medium, high, and very high forest loss concentrations, respectively.

Next, we focus on five zones of interest (Zooms A-E) in Colombia, Brazil, Bolivia, and Peru. For all images, please click to enlarge.

*Forest Cover Loss: 5 acres per minute. Almost half (49%) occurred in Brazil, followed by Peru (20%), Colombia (20%), Bolivia (8%), and Ecuador (3%). see Annex.

**Primary Forest Loss: 3.5 acres per minute. Over half (53%) occurred in Brazil, followed by Peru (20%), Colombia (18%), Bolivia (7%), and Ecuador (2%). see Annex.


Colombia

The largest concentration of 2018 forest loss is in the northeast Colombian Amazon (494,000 acres). Out of this total, 11% (56,800 acres) occurred in national parks. National experts indicate that land grabbing has emerged as a leading direct driver of deforestation (Arenas 2018). See MAAP #97 for more information.

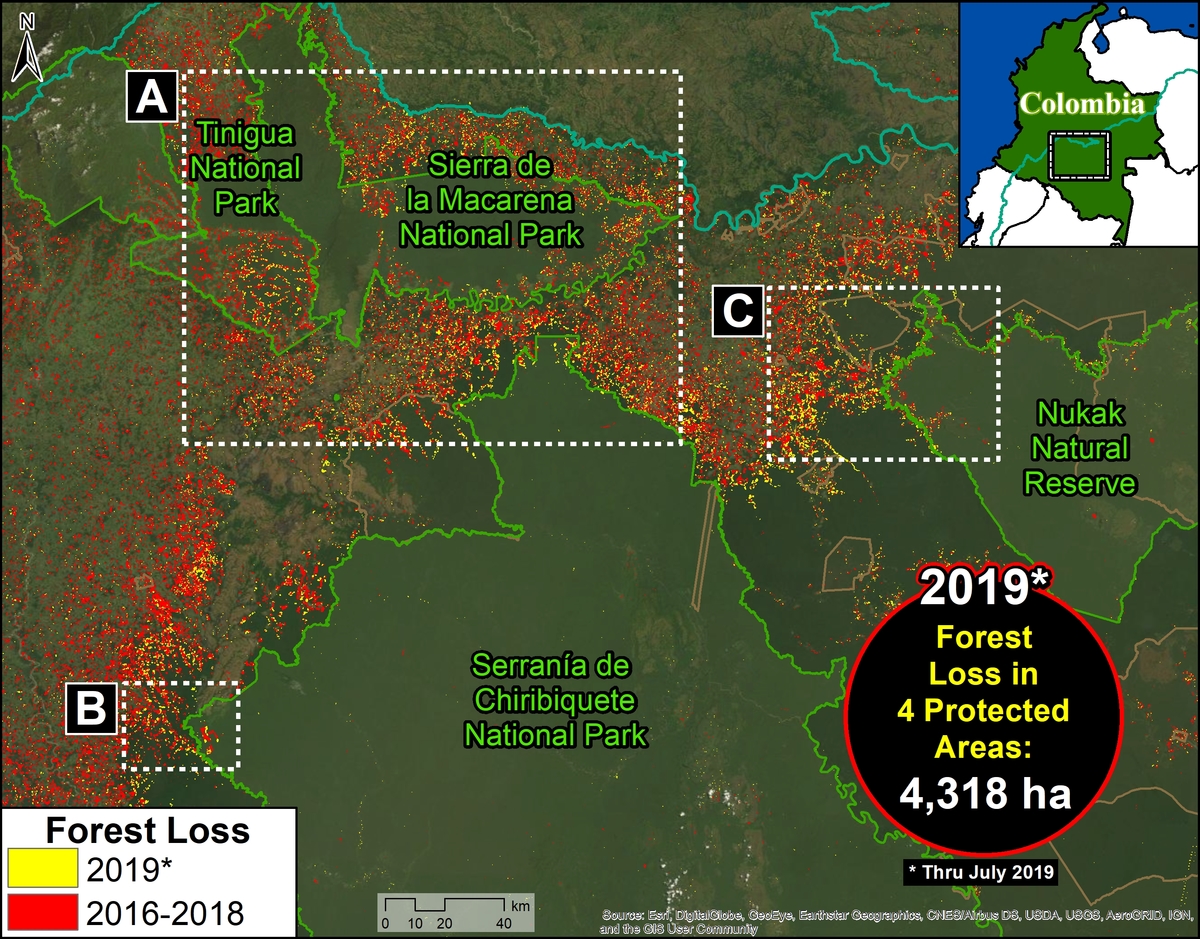
Zoom A shows the forest loss expanding towards western Chiribiquete National Park, including distinct deforestation in this protected area during 2018.

Zoom B shows the extensive 2018 deforestation (30,000 acres) within Tinigua National Park. A recent news report indicates that cattle ranching is one of the factors related to this deforestation.

Zoom A. Colombia-Chiribiquete. Data: Hansen/UMD/Google/USGS/NASA, SINAP, Planet, ESA
Zoom B. Colombia – Tinigua. Data: Hansen/UMD/Google/USGS/NASA, SINAP, Planet, ESA


Brazil (border with Bolivia)

Another important result is the contrast between northern Bolivia (Pando department) and adjacent side Brazil (states of Acre, Amazonas, and Rondônia). Zoom C shows several deforestation hotspots on the Brazilian side, while the Bolivian side is much more intact.

Zoom C. Brazil, Bolivia border. Data: Hansen/UMD/Google/USGS/NASA, ESA, RAISG


Bolivia

In Bolivia, the major forest loss hotspots are further south. Zoom D shows the recent deforestation (5,000 acres in 2018) due to agricultural activity associated with one of the first major Mennonite settlements in Beni department (Kopp 2015). The other Mennonite settlements are located further south.

Zoom D. Bolivia, Black River Mennonite settlement. Data: Hansen/UMD/Google/USGS/NASA, SERNAP, Planet

Peru

The Hansen data indicates over 200,000 acres of forest loss during 2018 in the Peruvian Amazon. One of the most important deforestation drivers, especially in southern Peru, is gold mining. We estimate 23,000 acres of gold mining deforestation during 2018 in the southern Peruvian Amazon (see MAAP #96).

Zoom E shows the most emblematic case of gold mining deforestation: the area known as La Pampa.

It is important to emphasize, however, that in February 2019 the Peruvian government launched “Operation Mercury 2019” (Operación Mercurio 2019), a multi-sectoral and comprehensive mega-operation aimed at eradicating illegal mining and associated crime in La Pampa, as well as promote development in the region.

Zoom D. Peru – La Pampa. Data: Hansen/UMD/Google/USGS/NASA, SERNAP, Planet

Annex

Annex. Forest cover and primary forest loss in the western Amazon.  Data: Hansen/UMD/Google/USGS/NASA, Global Forest Watch.

Methods

The 2018 forest loss data presented in this report were generated by the Global Land Analysis and Discovery (GLAD) laboratory at the University of Maryland (Hansen et al 2013) and presented by Global Forest Watch. Our study area is strictly what is presented in the Base Map: the areas within the Amazonian biogeographic boundary of the western Amazon.

Specifically, for our estimate of forest cover loss, we multiplied the annual “forest cover loss” data by the density percentage of the “tree cover” from the year 2000 (values >30%).

For our estimate of primary forest loss, we intersected the forest cover loss data with the additional dataset “primary humid tropical forests” as of 2001 (Turubanova et al 2018). For more details on this part of the methodology, see the Technical Blog from Global Forest Watch (Goldman and Weisse 2019).

All data were processed under the geographical coordinate system WGS 1984. To calculate the areas in metric units the UTM (Universal Transversal Mercator) projection was used: Peru and Ecuador 18 South, Colombia 18 North, Western Brazil 19 South and Bolivia 20 South.

Lastly, to identify the deforestation hotspots, we conducted a kernel density estimate. This type of analysis calculates the magnitude per unit area of a particular phenomenon, in this case forest cover loss. We conducted this analysis using the Kernel Density tool from Spatial Analyst Tool Box of ArcGIS. We used the following parameters:

Search Radius: 15000 layer units (meters)

Kernel Density Function: Quartic kernel function

Cell Size in the map: 200 x 200 meters (4 hectares / 9.88 acres)

Everything else was left to the default setting.

For the Base Map, we used the following concentration percentages: Medium: 10%-20%; High: 21%-35%; Very High: >35%.


References

Arenas M (2018) Acaparamiento de tierras: la herencia que recibe el nuevo gobierno de Colombia. Mongabay, 2 AGOSTO 2018. https://es.mongabay.com/2018/08/acaparamiento-de-tierras-colombia-estrategias-gobierno/

Goldman L, Weisse M (2019) Technical Blog: Global Forest Watch’s 2018 Data Update Explained. https://blog.globalforestwatch.org/data-and-research/blog-tecnico-explicacion-de-la-actualizacion-de-datos-de-2018-de-global-forest-watch

Hansen, M. C., P. V. Potapov, R. Moore, M. Hancher, S. A. Turubanova, A. Tyukavina, D. Thau, S. V. Stehman, S. J. Goetz, T. R. Loveland, A. Kommareddy, A. Egorov, L. Chini, C. O. Justice, and J. R. G. Townshend. 2013. “High-Resolution Global Maps of 21st-Century Forest Cover Change.” Science 342 (15 November): 850–53. Data available on-line from: http://earthenginepartners.appspot.com/science-2013-global-forest.

Kopp Ad (2015) Las colonias menonitas en Bolivia. Tierra. http://www.ftierra.org/index.php/publicacion/libro/147-las-colonias-menonitas-en-bolivia

Planet Team (2017). Planet Application Program Interface: In Space for Life on Earth. San Francisco, CA. https://api.planet.com

Turubanova S., Potapov P., Tyukavina, A., and Hansen M. (2018) Ongoing primary forest loss in Brazil, Democratic Republic of the Congo, and Indonesia. Environmental Research Letters  https://doi.org/10.1088/1748-9326/aacd1c 


Acknowledgements

We thank M. Terán (ACEAA), M. Weisse (GFW/WRI), A. Thieme (UMD), R. Catpo (ACCA) and A. Cóndor (ACCA) for helpful comments to this report.


Citation

Finer M, Mamani N (2019) Western Amazon – Deforestation Hotspots 2018 (a regional perspective). MAAP: 100.

MAAP #98: Deforestation Hotspots In The Peruvian Amazon, 2018

Base Map. 2018 Deforestation Hotspots. Data: PNCB/MINAM, SERNANP

Thanks to early warning forest loss alerts,* we are able to make an initial assessment of the 2018 deforestation hotspots in the Peruvian Amazon.

The Base Map highlights the medium (yellow) to high (red) hotspots. In this context, hotspots are the areas with the highest density of forest loss alerts.

Note that the most intense hotspots are concentrated in the southern Peruvian Amazon, particularly the Madre de Dios region. In previous years, intense hotspots were also concentrated in the central Peruvian Amazon.

Next, we focus on 5 hotspots of interest (Zooms A-E).

A. La Pampa (Madre de Dios)
B. Bahuaja Sonene National Park (surroundings) (Madre de Dios, Puno)
C. Iberia (Madre de Dios)
D. Organized Deforestation (Ucayali, Loreto)
E. Central Amazon (Ucayali, Huánuco)

*The data presented in this report is an estimate based on early warning data generated by the National Program of Forest Conservation for the Mitigation of Climate Change of the Ministry of the Environment of Peru (PNCB/MINAM). We also analyzed University of Maryland GLAD alerts, obtained from Global Forest Watch.

A. La Pampa (Madre de Dios)

Zoom A shows two important cases in the southern Peruvian Amazon (Madre de Dios region). First, gold mining deforestation south of the Interoceanic Highway in the area known as La Pampa. It is important to emphasize that the Peruvian government just started “Operation Mercury 2019” (Operación Mercurio 2019), a multi-sectoral and comprehensive mega-operation aimed at eradicating illegal mining and associated crime in La Pampa, as well as promote development in the region. Second, deforestation due to agricultural activity north of the highway. As in all the zoom maps below, pink indicates forest loss in 2018.

Zoom A. La Pampa. Data- PNCB:MINAM, SERNANP, ACCA, ESA

B. Bahuaja Sonene National Park (surroundings) (Madre de Dios, Puno)

Zoom B also shows two important cases in the southern Peruvian Amazon (regions of Madre de Dios and Puno), surrounding Bahuaja Sonone National Park. First, to the north of the park, is gold mining deforestation along the upper Malinowski River. The Peruvian protected areas agency (SERNANP) points out that they have limited the deforestation south of the river (direction towards the national park) due to their intensified patrols on that side. Second, to the south of the park, is non-mining (partly agricultural) deforestation.

Zoom B. Bahuaja Sonene (surroundings). Data- PNCB:MINAM, SERNANP, Planet


C. Iberia (Madre de Dios)

Zoom C takes us to the other side of Madre de Dios, around the town of Iberia, near the border with Brazil and Bolivia. This area is experiencing extensive deforestation due to agricultural activity. There most intense deforestation is just of Iberia, where a religious community of farmers (Arca Pacahuara) is reportedly establishing large corn plantations (References 1-2). Much of the 2018 (and 2017) deforestation is occurring within forest concessions, where agriculture is not permitted.

Zoom C. Iberia. Data- PNCB:MINAM, SERNANP, Planet


D. Organized Deforestation (Ucayali, Loreto)

In 2018 we documented two similar cases in the central Peruvian Amazon. Both have similar forms of organized deforestation, characterized by what seems to be agricultural plots arranged along new access roads. Zoom D shows the Masisea case (left panel, zoom D1) and the Sarayaku case (right panel, zoom D2). See MAAP #92 for more information.

Zoom D. Organized deforestation. Data- PNCB:MINAM, SERNANP, ESA


E. Central Amazon (Ucayali, Huánuco)

As in previous years, there was extensive deforestation in the central Peruvian Amazon (Ucayali and Huánuco regions). Zoom E shows an example: small and medium-scale deforestation surrounding a pair of large-scale oil palm plantations. Some of the recent deforestation is occurring within “Permanent Production Forests,” forestry-zoned areas where agriculture is not permitted. This area also corresponds to the proposed territorial title of the indigenous Shipibo community of Santa Clara de Uchunya (see here for more information).

Zoom E. Central Amazon. Data- PNCB:MINAM, SERNANP, ESA


Methodology

We conducted this analysis using the Kernel Density tool from Spatial Analyst Tool Box of ArcGIS, using the following parameters:

Search Radius: 15000 layer units (meters)
Kernel Density Function: Quartic kernel function
Cell Size in the map: 200 x 200 meters (4 hectares)
Everything else was left to the default setting.

The data presented in this report is an estimate based on early warning data generated by the National Program of Forest Conservation for the Mitigation of Climate Change of the Ministry of the Environment of Peru (PNCB/MINAM). We also analyzed University of Maryland GLAD alerts, obtained from Global Forest Watch.


References

1. CIFOR 2016

2. GOREMAD 2016

Planet Team (2017). Planet Application Program Interface: In Space for Life on Earth. San Francisco, CA. https://api.planet.com


Citation

Finer M, Mamani N (2018) Deforestation Hotspots in the Peruvian Amazon, 2018. MAAP: 98.

MAAP #97: Deforestation Surge In The Colombian Amazon, 2018 Update

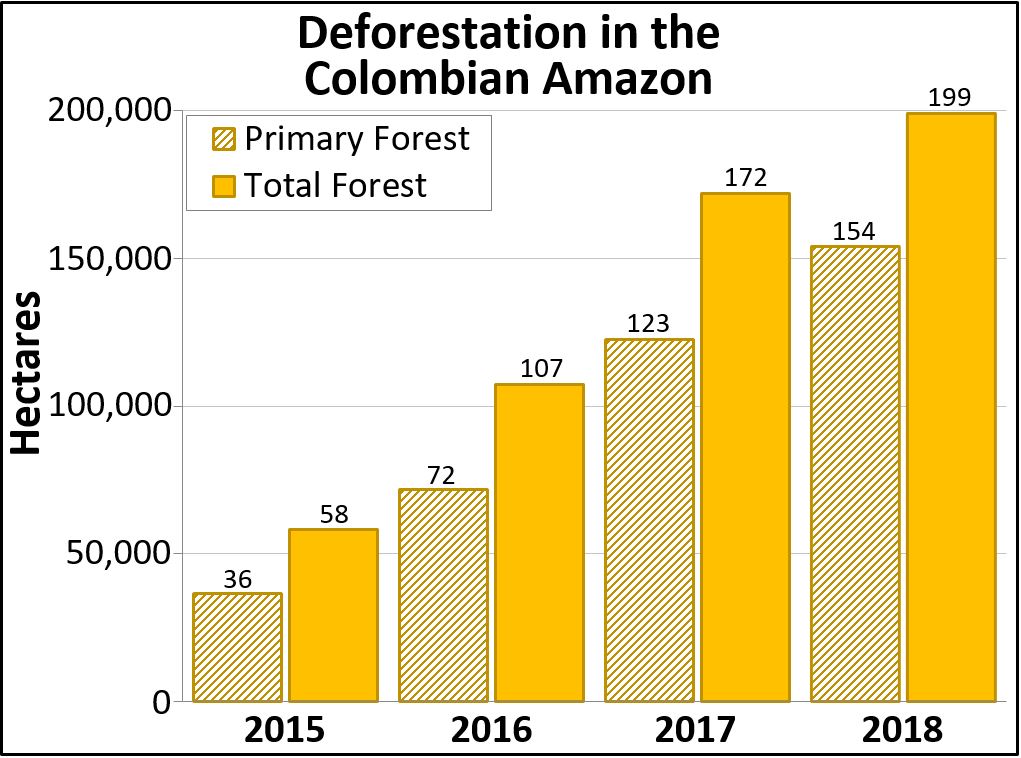
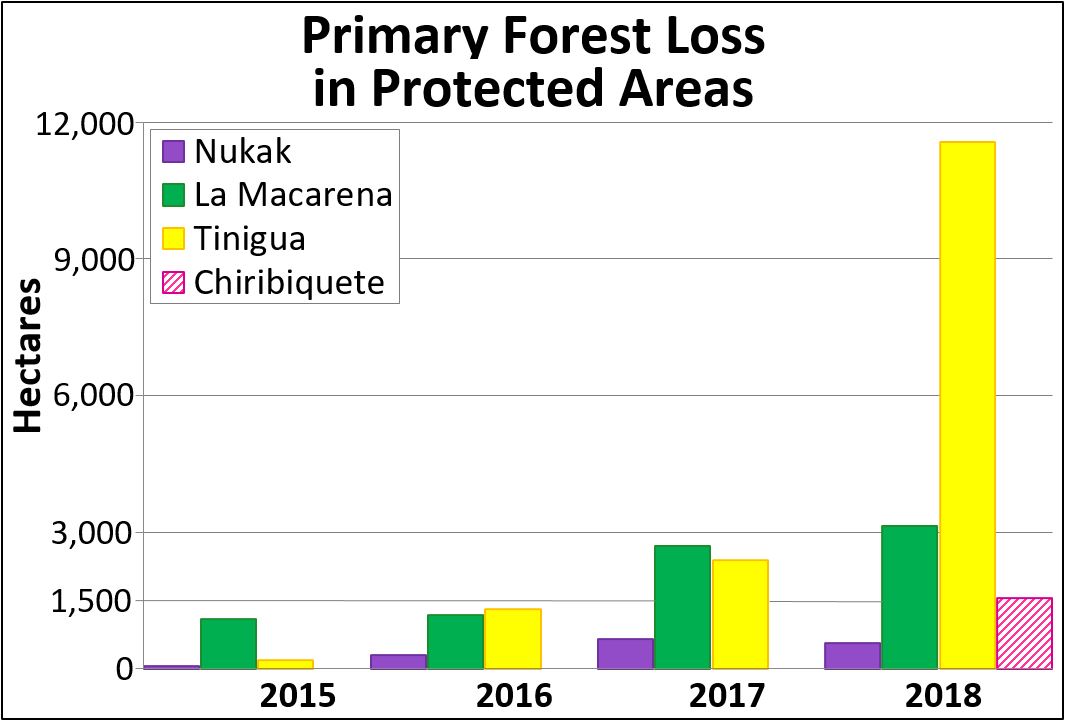
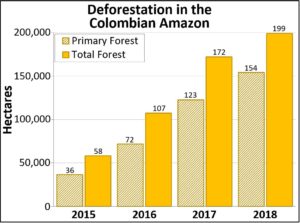
The Colombian Amazon is currently experiencing a deforestation surge (see graph).

The surge started three years ago (2016) and peaked in 2017 with the highest annual deforestation on record (214,744 hectares).*

Deforestation remains high in 2018: 156,722 hectares (based on early warning alert data).* If this estimate is confirmed, it would be the second highest on record (behind just 2017).

National experts indicate that land grabbing (acaparamiento de tierras) is an increasingly dominant direct driver of deforestation.

*Data from the University of Maryland. Annual data from Hansen et al (2013) [citation below] and 2018 data from GLAD alerts.

MAAP Colombia is a collaboration between Amazon Conservation and Amazon Conservation Team., funded by the MacArthur Foundation.

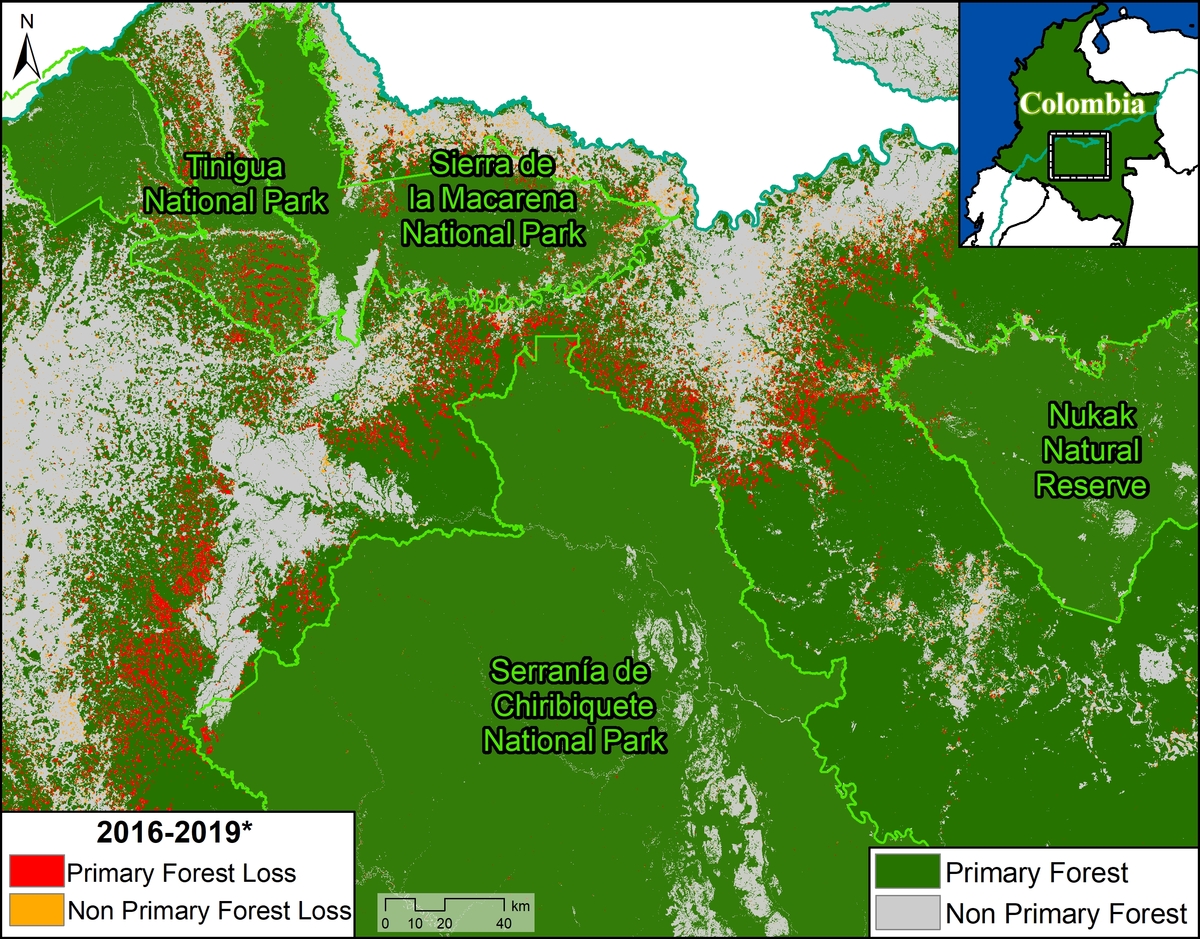
We also present a Base Map that shows the 2018 deforestation hotspots. Note that the deforestation is concentrated in three departments located in the transition area between the Amazon and Andes: Guaviare, Caqueta, and Meta.

We highlight the location of three critical areas that are examined in greater detail below: 1) Llanos de Yari, 2) Chiribiquete- La Macarena, and 3) Tinigua National Park.

For the Base Map and Zooms below, please click on the image to enlarge or download.

Base Map. Deforestation hotspots in the Colombian Amazon. Click to enlarge. Data- UMD:GLAD, Hansen:UMD:Google:USGS:NASA, PNN, SIAC, RAISG

Zoom 1: Llanos de Yari

Zoom 1 shows deforestation expanding towards western Chiribiquete National Park. In fact, in 2017-18 (purple and pink on map), deforestation has occurred well within the park. 

Zoom 1. Llanos de Yari. Click to enlarge. Data- DigitalGlobe, UMD:GLAD, Hansen:UMD:Google:USGS:NASA, PNN, SIAC, RAISG

Zoom 2: Chiribiquete – La Macarena

As we first reported in MAAP #86, the area between Chiribiquete and La Macarena National Parks is currently experiencing one of the most intense deforestation surges. Zoom 2 shows the most recent deforestation (indicated in red and pink) is entering the newly expanded section of Chiribiquete National Park. 

Zoom 2. Chiribiquete – La Macarena. Click to enlarge. Data- Planet, UMD:GLAD, Hansen:UMD:Google:USGS:NASA, PNN, SIAC, RAISG.

Zoom 3: Tinigua National Park

Zoom 3 shows how 2018 has seen a surge of deforestation deep within Tinigua National Park (see pink). 

Zoom 3. Tinigua National Park. Click to enlarge. Data- Planet, UMD:GLAD, Hansen:UMD:Google:USGS:NASA, PNN, SIAC, RAISG

References

Planet Team (2017). Planet Application Program Interface: In Space for Life on Earth. San Francisco, CA. https://api.planet.com

Hansen, M. C., P. V. Potapov, R. Moore, M. Hancher, S. A. Turubanova, A. Tyukavina, D. Thau, S. V. Stehman, S. J. Goetz, T. R. Loveland, A. Kommareddy, A. Egorov, L. Chini, C. O. Justice, and J. R. G. Townshend. 2013. “High-Resolution Global Maps of 21st-Century Forest Cover Change.” Science 342 (15 November): 850–53. Data available on-line from:http://earthenginepartners.appspot.com/science-2013-global-forest.


Citation

Hettler B, Thieme A, Finer M (2018) Deforestation Surge in the Colombian Amazon: 2018 update. MAAP: #96.

MAAP #96: Gold Mining Deforestation At Record High Levels In Southern Peruvian Amazon

Gold mining deforestation has been at record high levels in both 2017 and 2018 in the southern Peruvian Amazon.

Based on an analysis of nearly 500 high-resolution satellite images (from Planet and DigitalGlobe), we estimate the deforestation of 18,440 hectares across southern Peru during these last two years. That is equivalent to 45,560 acres (or 34,400 American football fields) in just two years.

The Base Map highlights this recent deforestation, with 2017 in red and 2018 in pink. The Reference Map in Annex 1 shows our full study area.

Base Map. Gold mining deforestation in southern Peruvian Amazon. Data- USGS/NASA, MAAP, SERNANP

2017 had the highest gold mining deforestation on record at the time: 9,160 hectares (22,635 acres). According to recent research led by CINCIA (Centro de Innovación Científica Amazónica), this was the highest annual total on record dating back to 1985*.

In 2018, we found the gold mining deforestation was even higher: 9,280 hectares (22,930 acres).

Thus, combined, 2017-18 had the highest two-year deforestation total on record: 18,440 hectares (45,565 acres).

Note the location of Zooms (A-C) shown in greater detail below. These zooms represent three of the most threatened areas: A) La Pampa, B) Upper Malinowski, and C) Camanti.

Click (or right click) to enlarge (or download) images.

*CINCIA reports 9,860 hectares of gold mining deforestation in 2017 (CINCIA 2018, Caballero Espejo et al 2018), an estimate even higher than ours.


Zoom A: La Pampa

Image A shows the gold mining deforestation of 1,685 hectares (4,164 acres) between 2017 (left panel) and 2018 (right panel) in an area known as La Pampa (Madre de Dios region). Red indicates the major deforestation fronts.
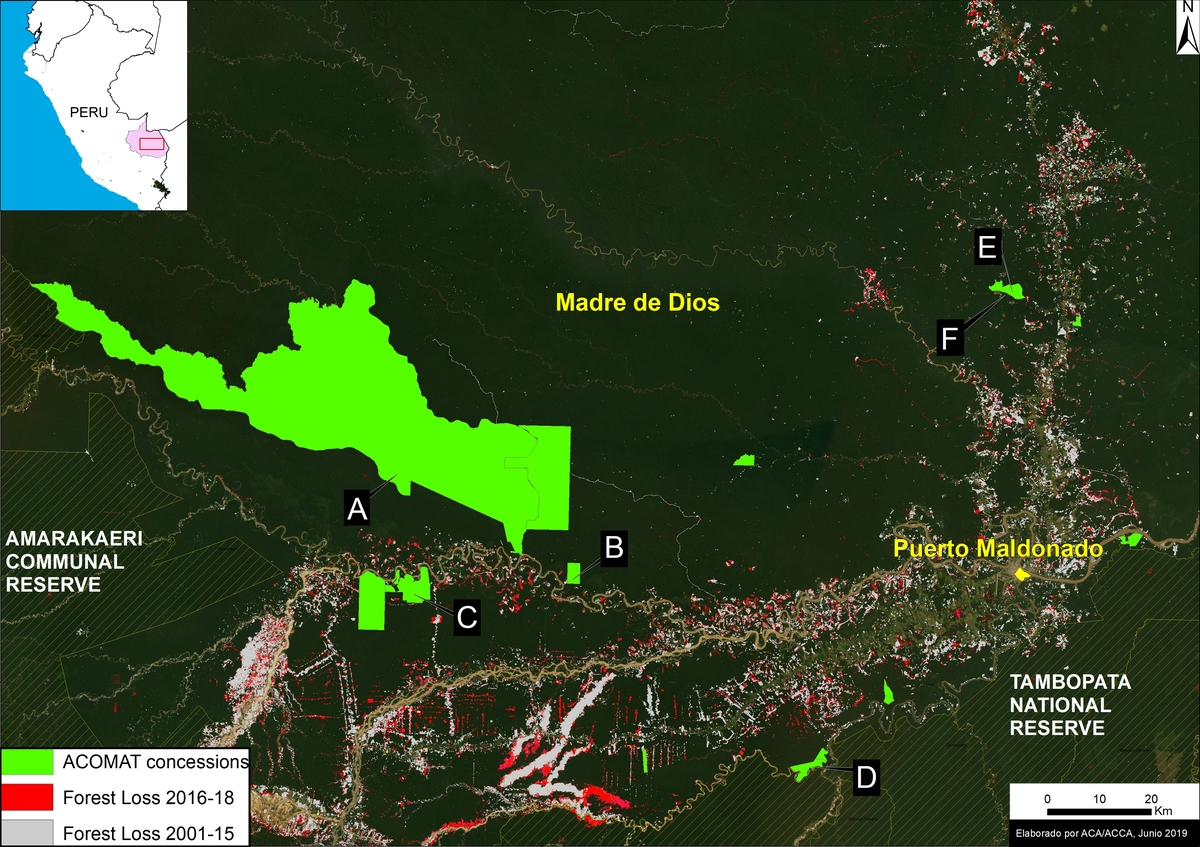
MAAP96Image A. La Pampa. Data- Planet, MAAP

As seen in the Land Use Map below (Annex 2), most of the recent mining deforestation in La Pampa is clearly illegal, concentrated in reforestation concessions and the buffer zone of Tambopata National Reserve.

According to the web portal GEOCATMIN (Geological Information System and Mining Register), developed by INGEMMET (Geological Mining and Metallurgical Institute of Peru), all titled mining concessions in the area are currently “without mining activity.” None are in authorized Exploration or Exploitation phase. Most of the mining activity is outside these concessions and in areas not authorized for mining.


Zoom B: Upper Malinowski

Image B shows the gold mining deforestation of 760 hectares (1,878 acres) between 2017 (left panel) and 2018 (right panel) along the upper stretches of the Malinowski River in the Madre de Dios region. Red indicates the major deforestation fronts.
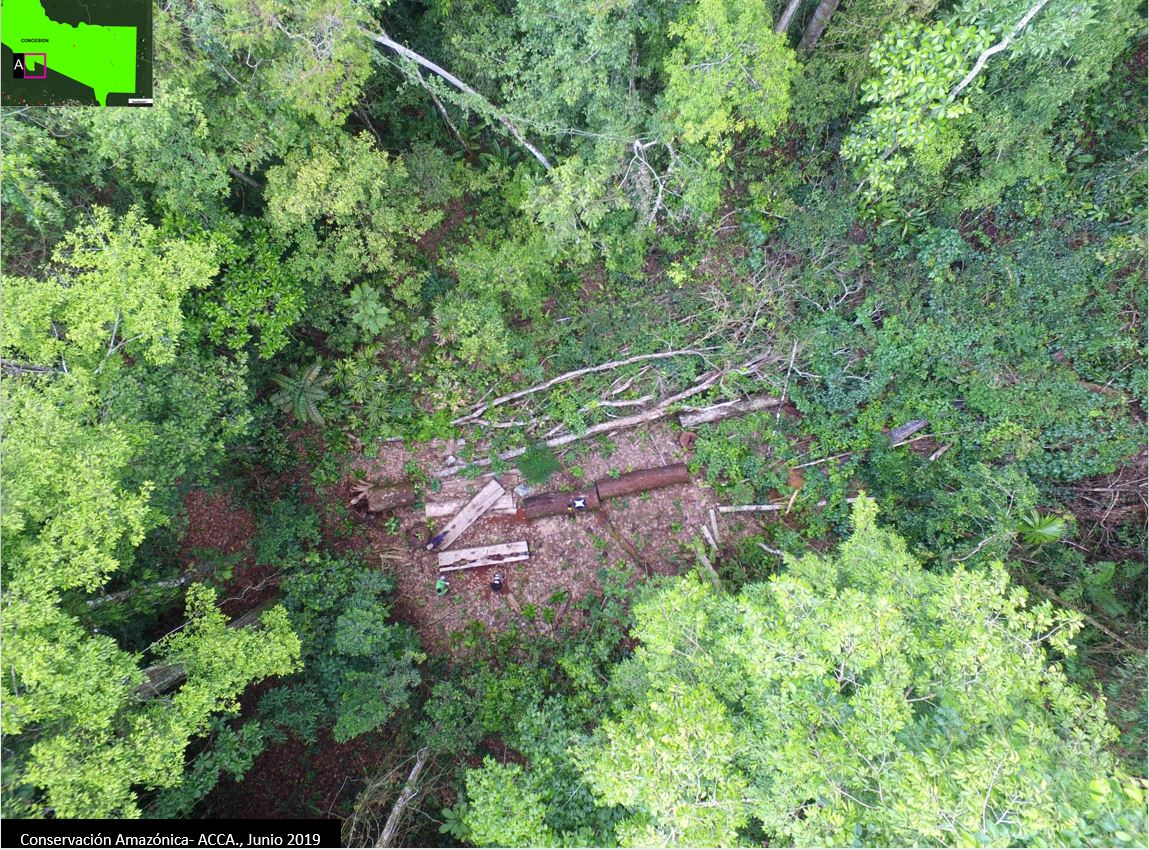
Image B. Upper Malinowski. Data- Planet, MAAP.jpg

As seen in the Land Use Map below (Annex 2), the recent gold mining deforestation along the Upper Malinowski is advancing in the Kotsimba Native Community and within the buffer zone of Bahuaja Sonene National Park.

According to GEOCATMIN, all titled mining concessions in the area are currently “without mining activity.” None are in authorized Exploration or Exploitation phase. Most of the mining activity is outside these concessions and in areas not authorized for mining.


Zoom C: Camanti

Image 4 shows the gold mining deforestation of 335 hectares (828 acres) between 2016 (left panel) and 2018 (right panel) in the Camanti area of the Cusco region. Red indicates the major deforestation fronts. Note the increasing proximity of the mining to Amarakaeri Communal Reserve.
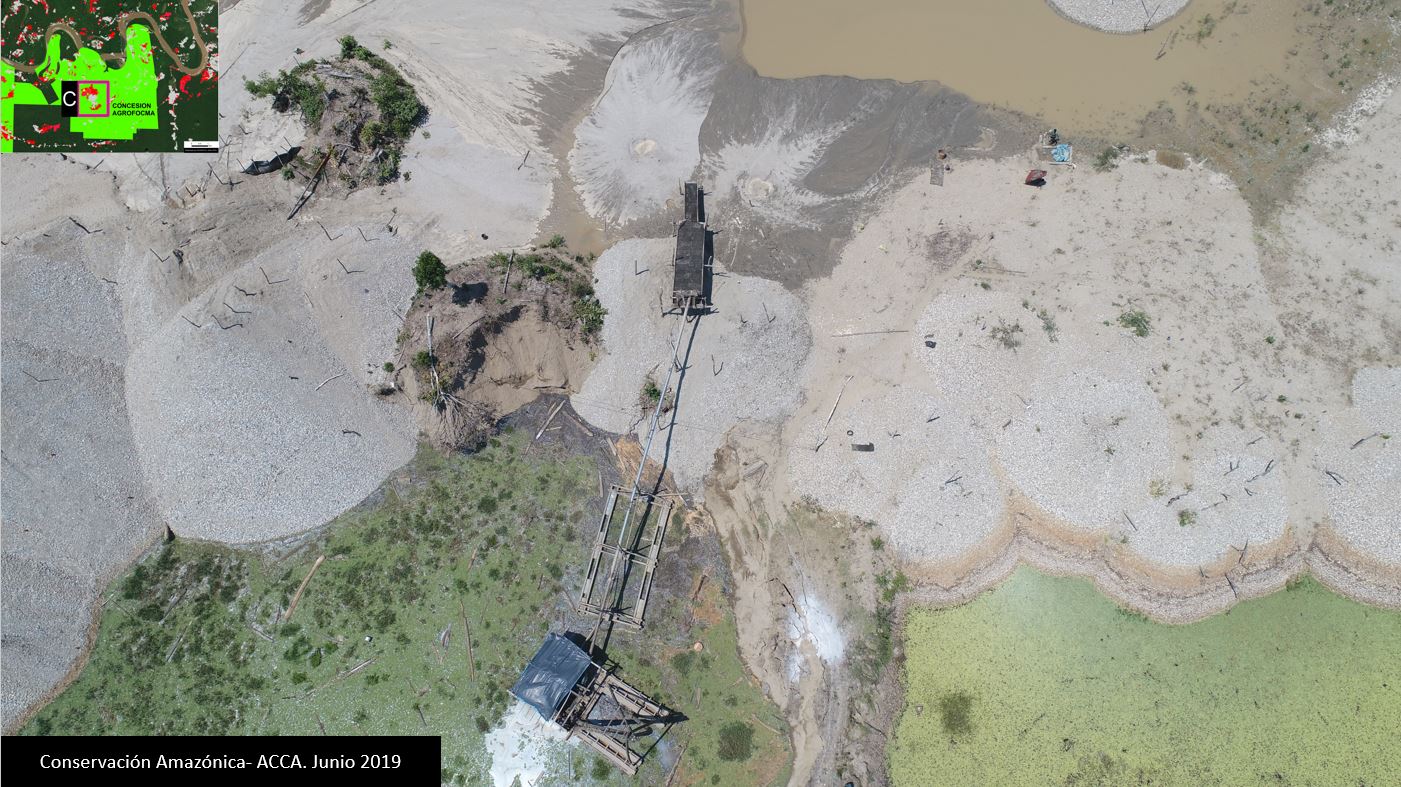
Image C. Camanti. Data- Planet, MAAP

As seen in the Land Use Map below (Annex 2), the recent gold mining in the Camanti area is advancing in mining concessions that are “in process” of titling. According to GEOCATMIN, there are no titled concessions in the area that are in Exploration or Exploitation phase.


Annex 1: Reference Map

Annex 1 features a Reference Map of our full study area. The background is white to better indicate the mining deforestation areas. It also serves as a reference map with additional labels.

Reference Map. Gold mining deforestation in southern Peruvian Amazon. Data- MAAP, SERNANP

Annex 2: Land Use Map

Annex 2 features a Land Use Map with detailed data on mining concessions and other important land designations. The mining concession data comes from the web portal GEOCATMIN (Geological Information System and Mining Register), developed by INGEMMET (Geological Mining and Metallurgical Institute of Peru). We downloaded the data on January 2, 2019.

Land use Map. Data- INGEMMET, IBC, MINAGRI, SERNANP, Planet, UMD:GLAD, MINAM:PNCB

Methodology

We analyzed high-resolution satellite imagery (DigitalGlobe and Planet) for both 2017 and 2018 and digitized all new gold mining deforestation. Given the widespread mining across a large area, we also used automated forest loss alerts based on medium resolution Landsat imagery (PNCB/MINAM) to guide our analysis.

References

Centro de Innovación Científica Amazónica (CINCIA) (2018) Tres décadas de deforestación por minería aurífera en la Amazonía suroriental peruana. Resumen de Investigación No. 1.

Caballero Espejo et al. (2018) Deforestation and Forest Degradation Due to Gold Mining in the Peruvian Amazon: A 34-Year Perspective.  Remote Sens. 2018, 10 (12), 1903; https://doi.org/10.3390/rs10121903

Asner GP and Tupayachi R (2016) Environ. Res. Lett. 12 094004.

Planet Team (2017). Planet Application Program Interface: In Space for Life on Earth. San Francisco, CA. https://api.planet.com

Acknowledgements

We thank the following colleagues for helpful comments: Miles Silman (Wake Forest Univ), Sidney Novoa (ACCA), Ronald Catpo (ACCA), Efrain Samochuallpa (ACCA), Daniela Pogliani (ACCA), Alfredo Cóndor (ACCA), and Lorena Durand (ACCA).

Citation

Finer M, Mamani N (2018) Gold Mining Deforestation at Record High Levels in Southern Peruvian Amazon. MAAP: 96.