Maap #90: Using Drones To Monitor Deforestation And Illegal Logging

Drone types- helicopter and fixed-wing (plane)

For the past three years, the organization Amazon Conservation has been working to establish a sustainable, local-based drones program for environmental monitoring in the southern Peruvian Amazon (Madre de Dios region).

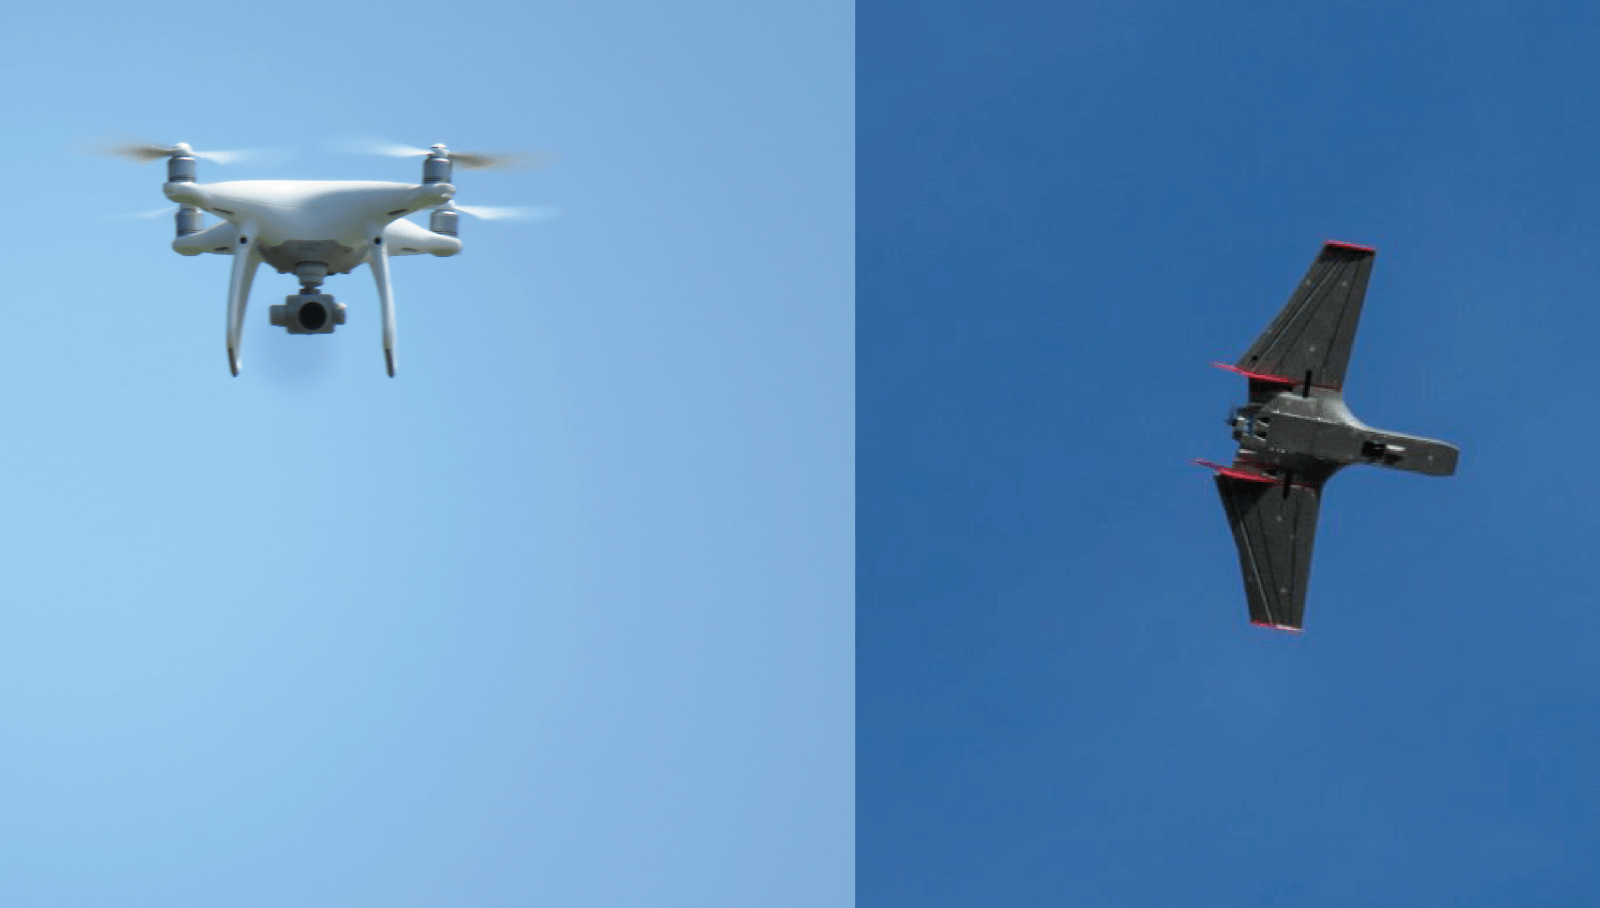
This program is based on two types of drones, multi-rotor (helicopter style) and fixed-wing (airplane style).

One of the main objectives is to improve the near real-time monitoring of deforestation and illegal logging.

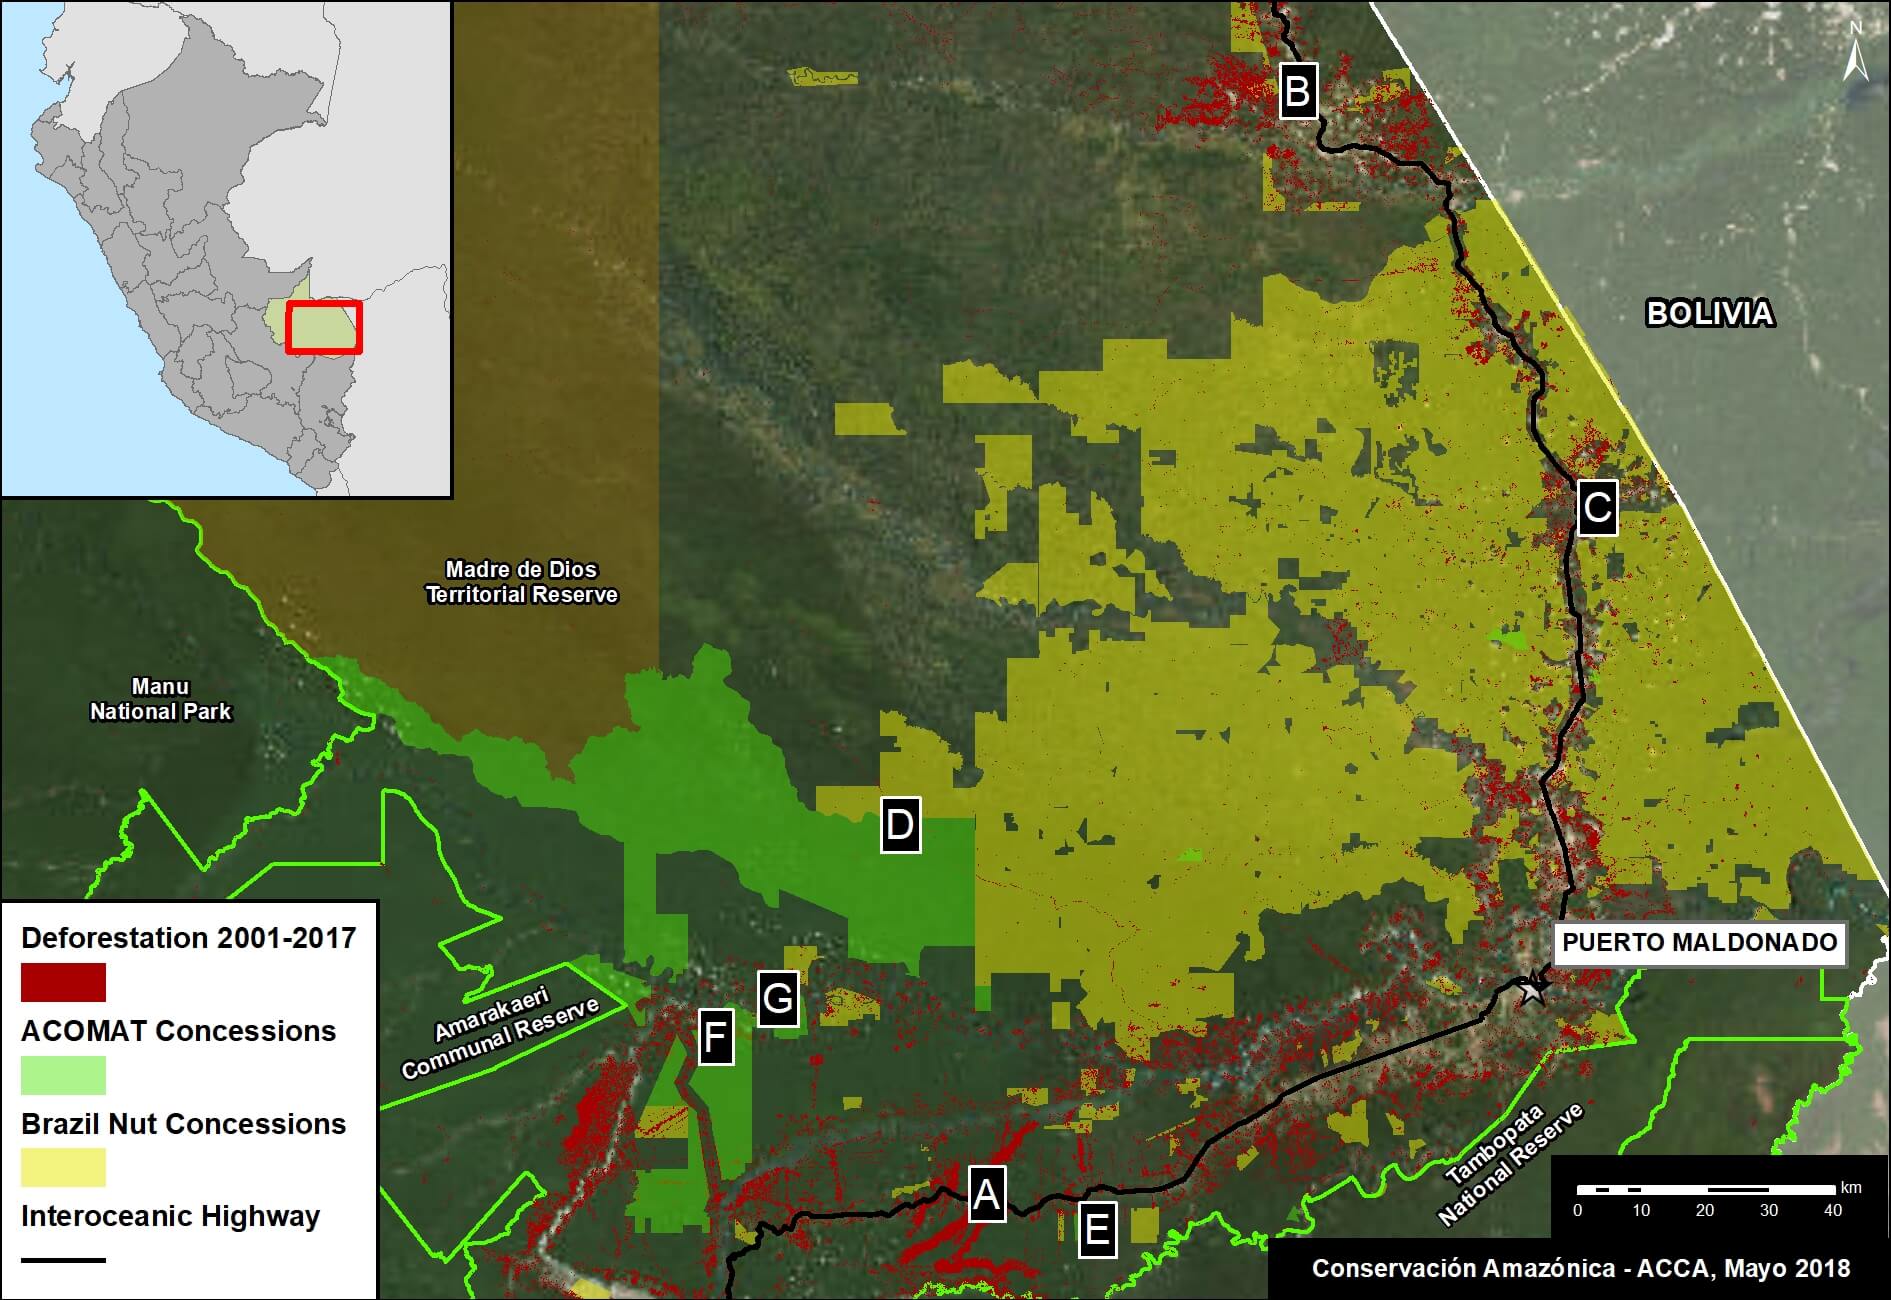
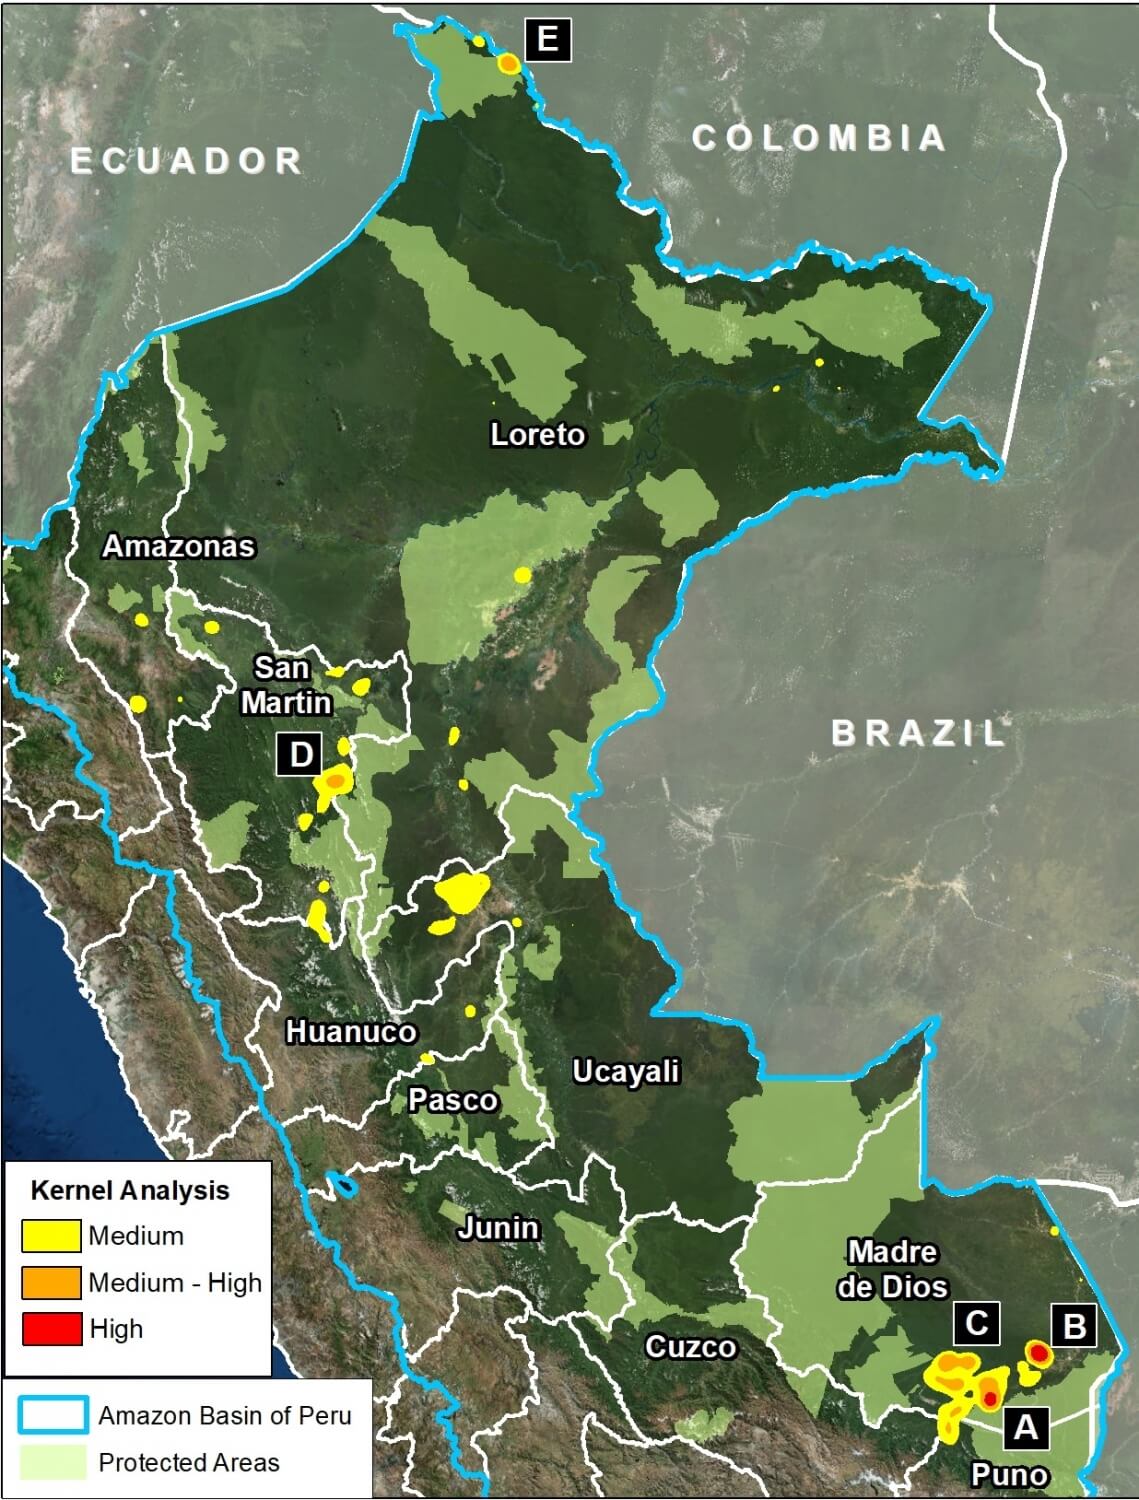
The monitoring is currently focused on three priority areas: 1) Brazil nut concessions, 2) forestry concessions of the local association ACOMAT, and 3) along the Interoceanic Highway (see Base Map).

Below, we show a series of drone images that we have used to identify the drivers of recent deforestation events. These drivers include gold mining, agriculture, illegal logging, cattle pasture, and natural forest loss.

Base Map. Priority areas of the Amazon Conservation drones initiative.

Interoceanic Highway

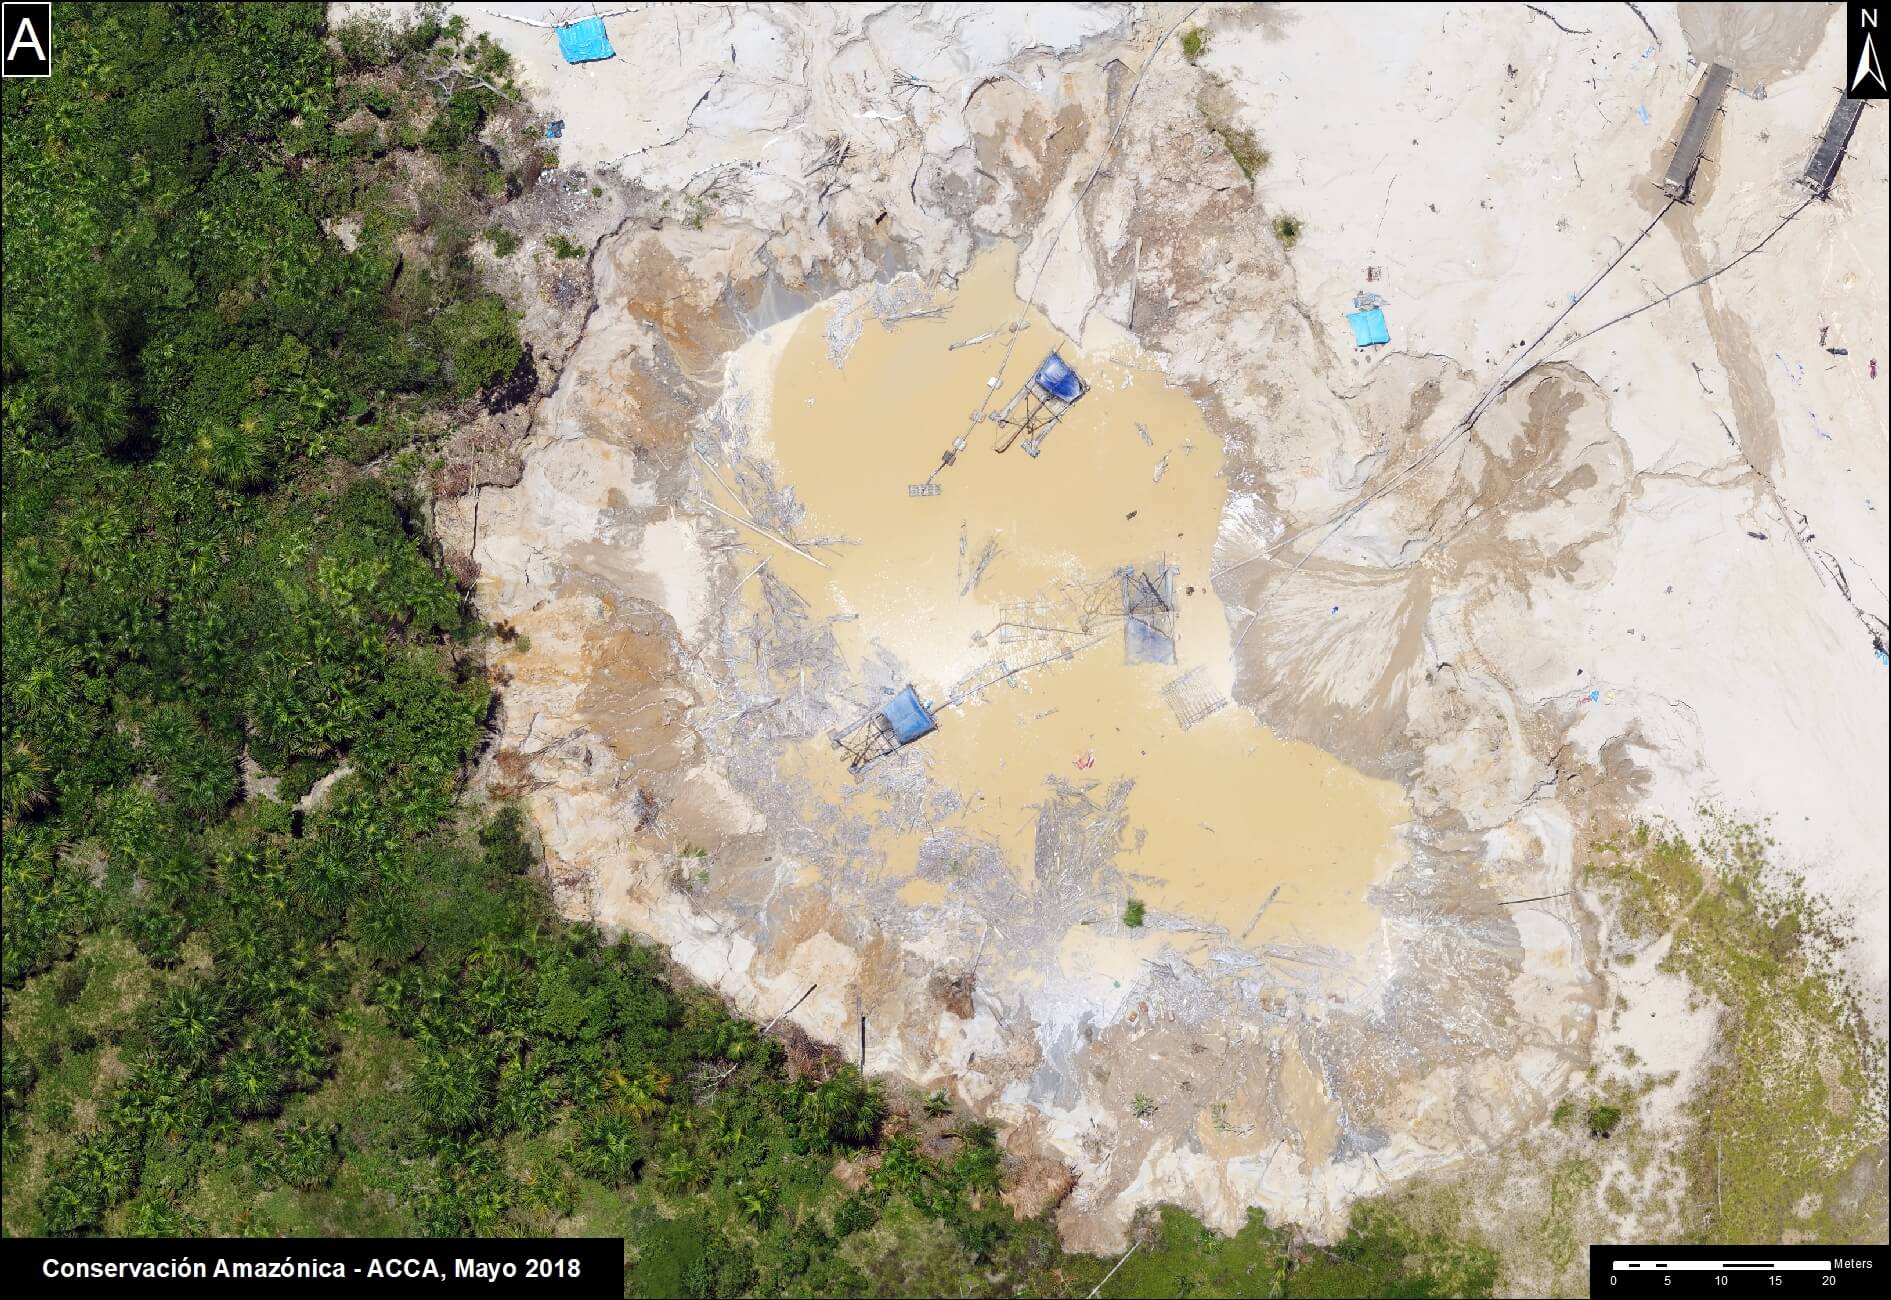
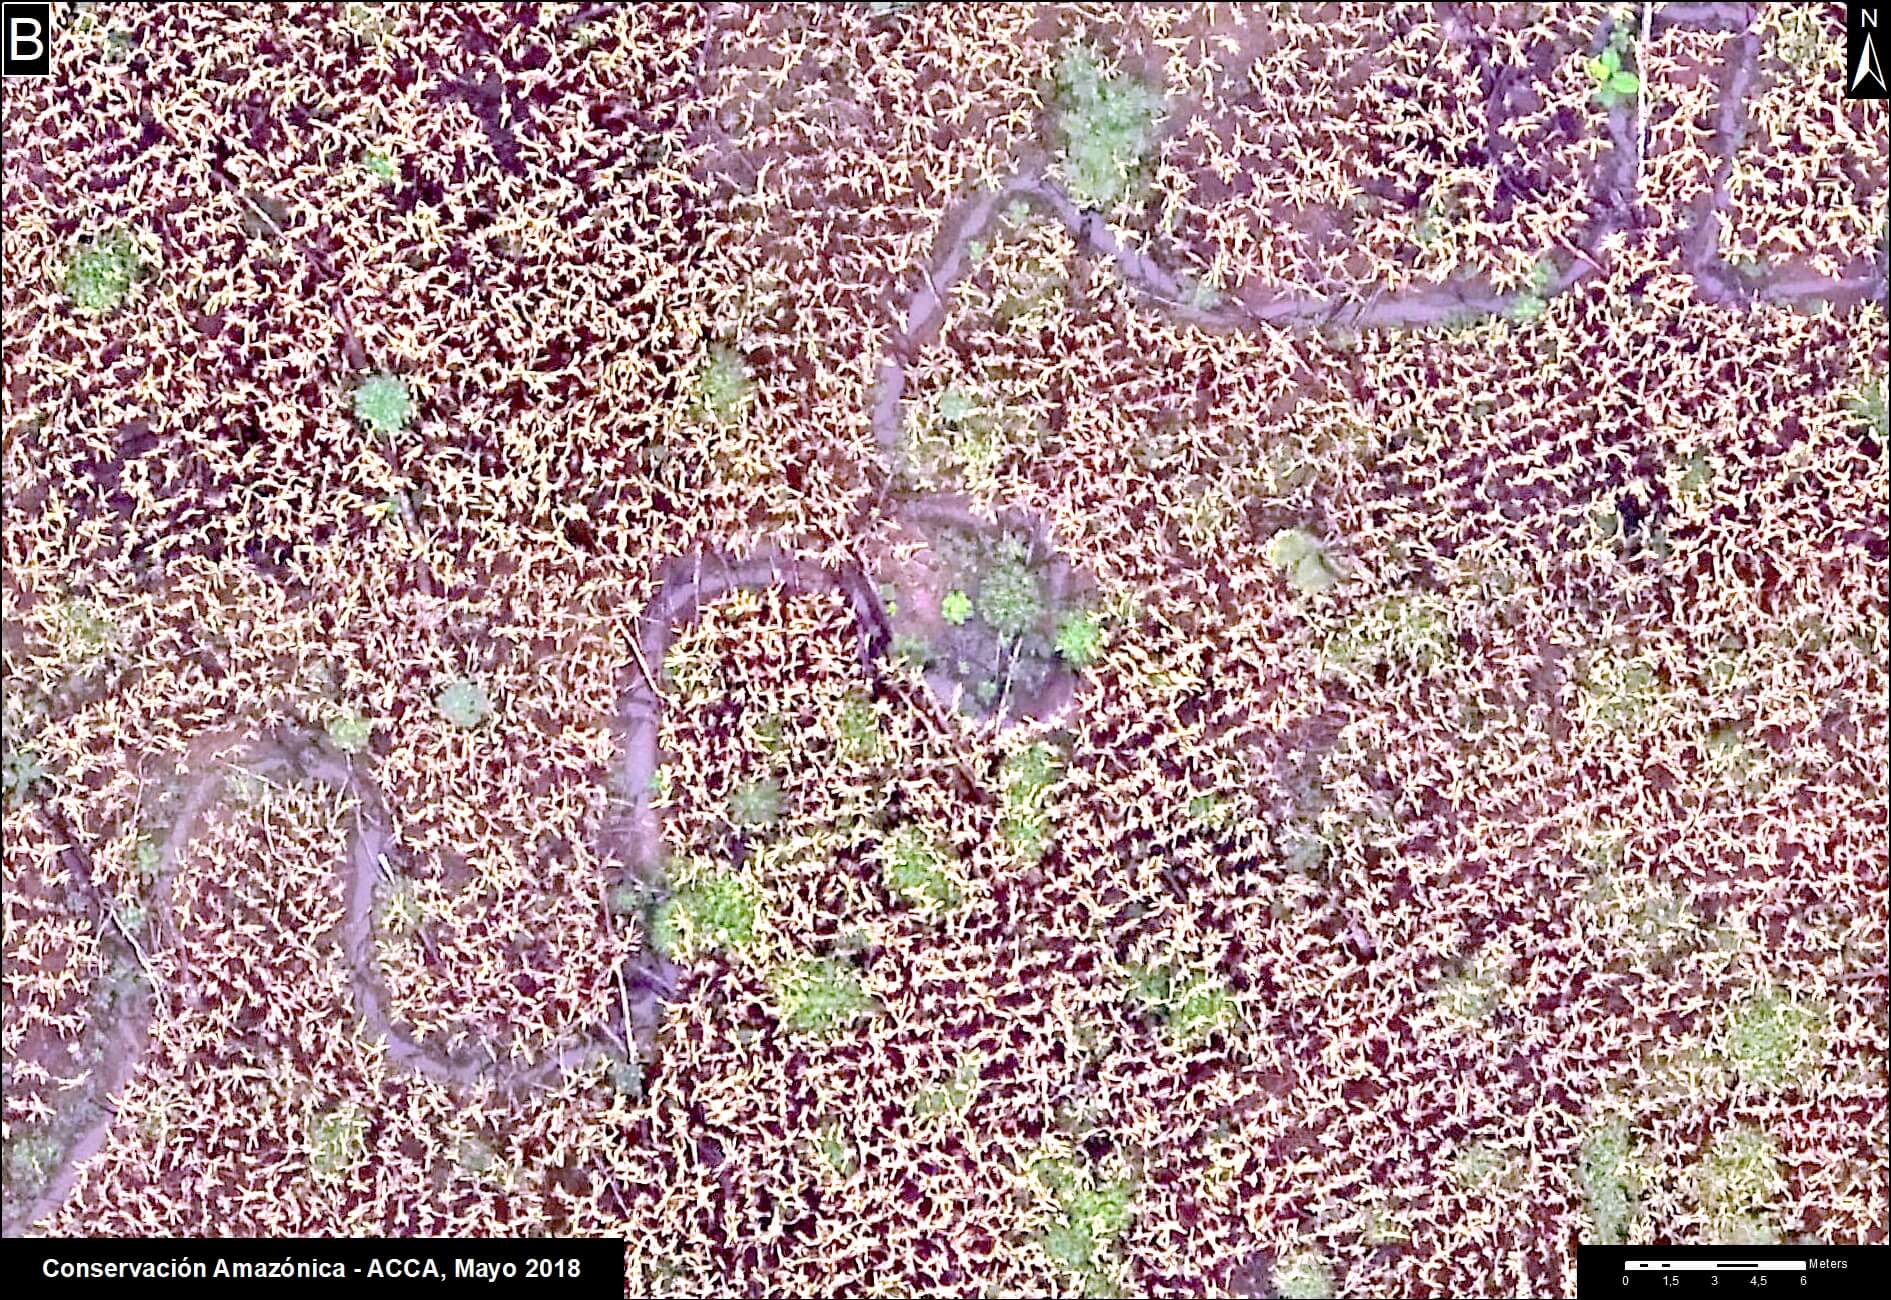
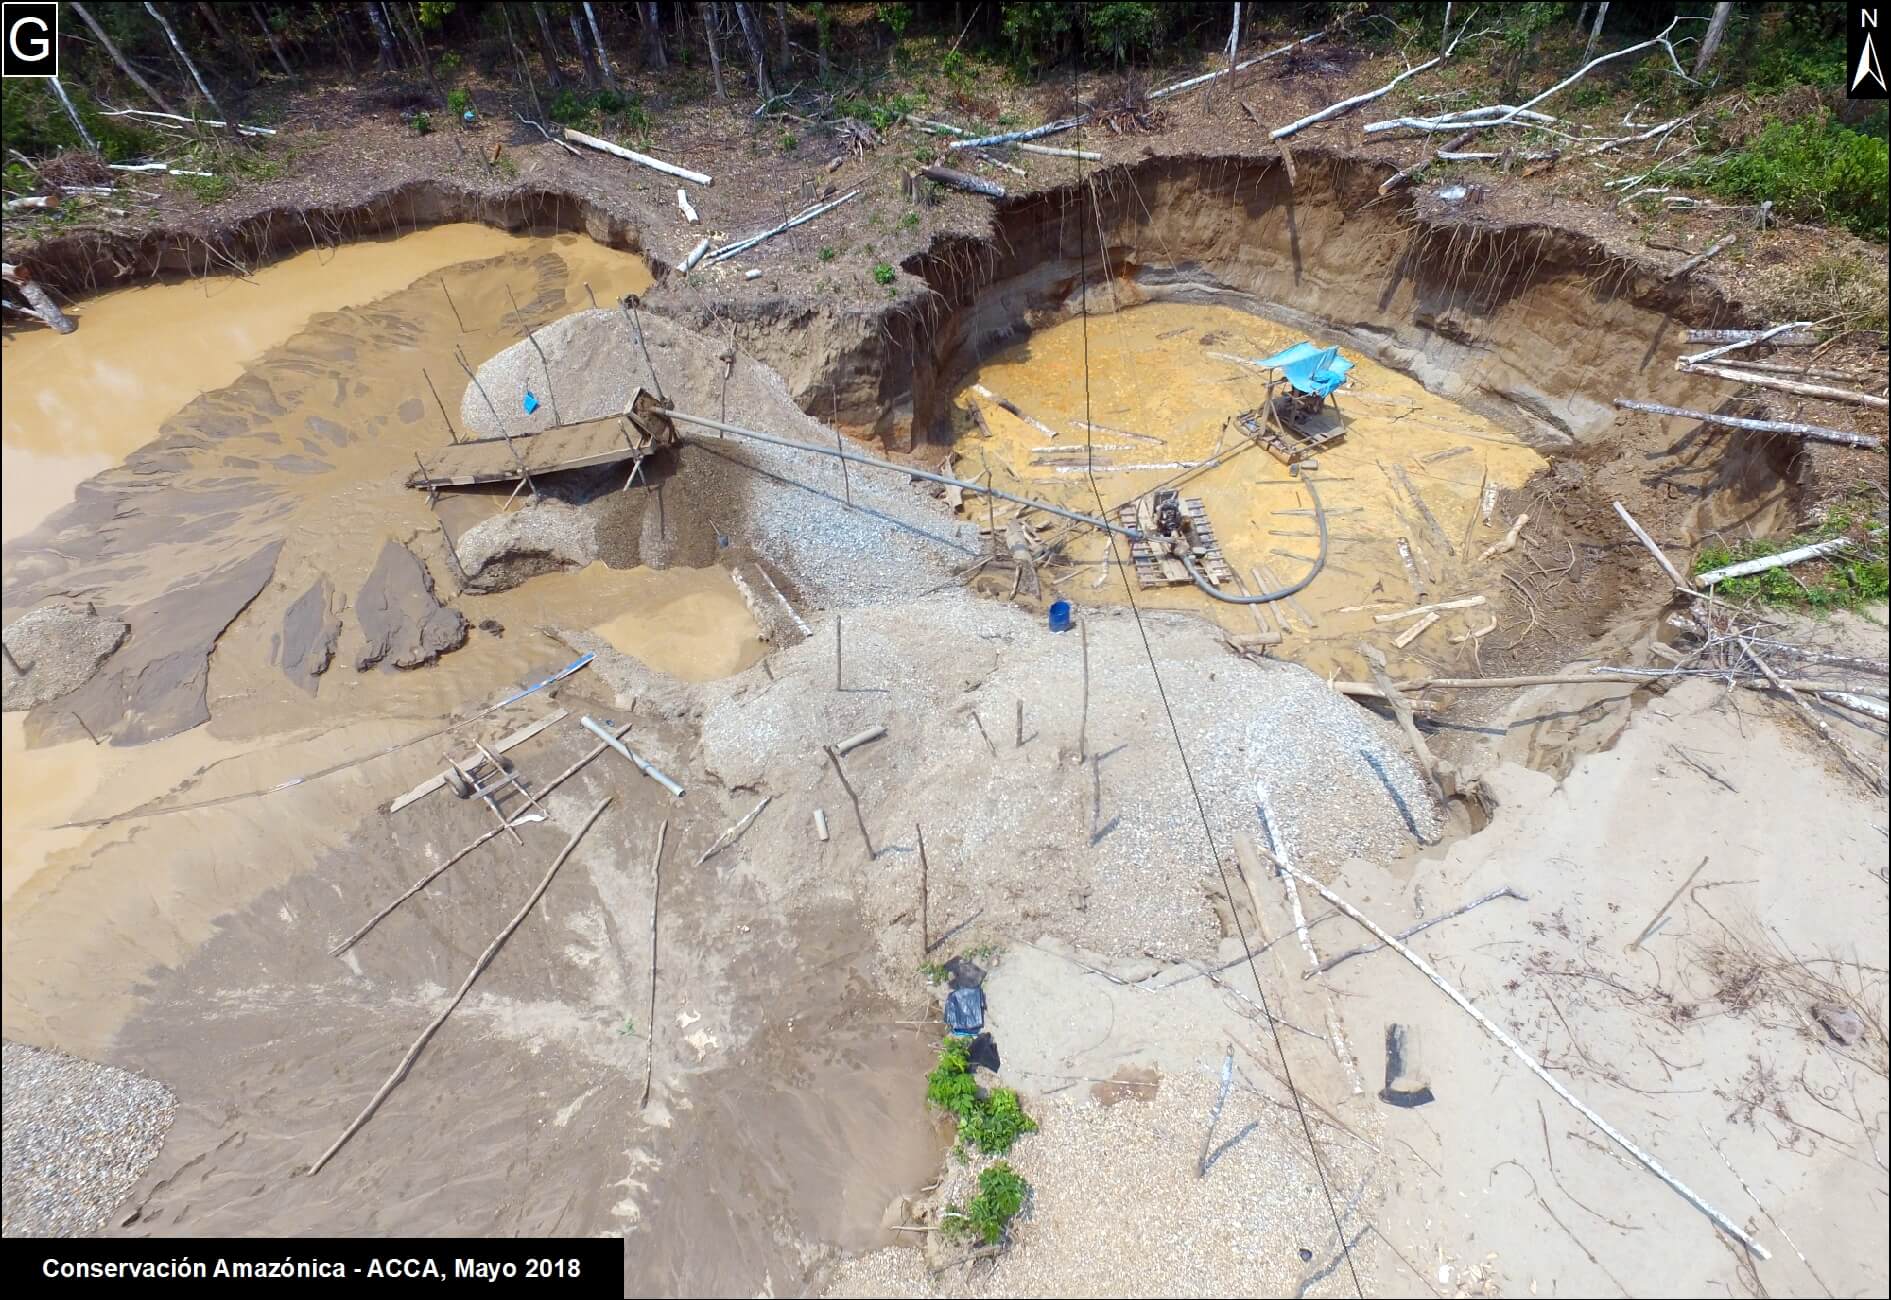
In March 2018, in collaboration with the organization ProPurús, we realized drone flights along the Interoceanic Highway in an effort to demonstrate the possible threats of building a new road along the border with Brazil (see MAAP #76). The following images show the two main threats to the area: gold mining and small/medium-scale agriculture (<50 hectares).

Image A. Drone image- gold mining.
B. Drone image- Deforestation from agriculture (corn)

Brazil Nut Concessions

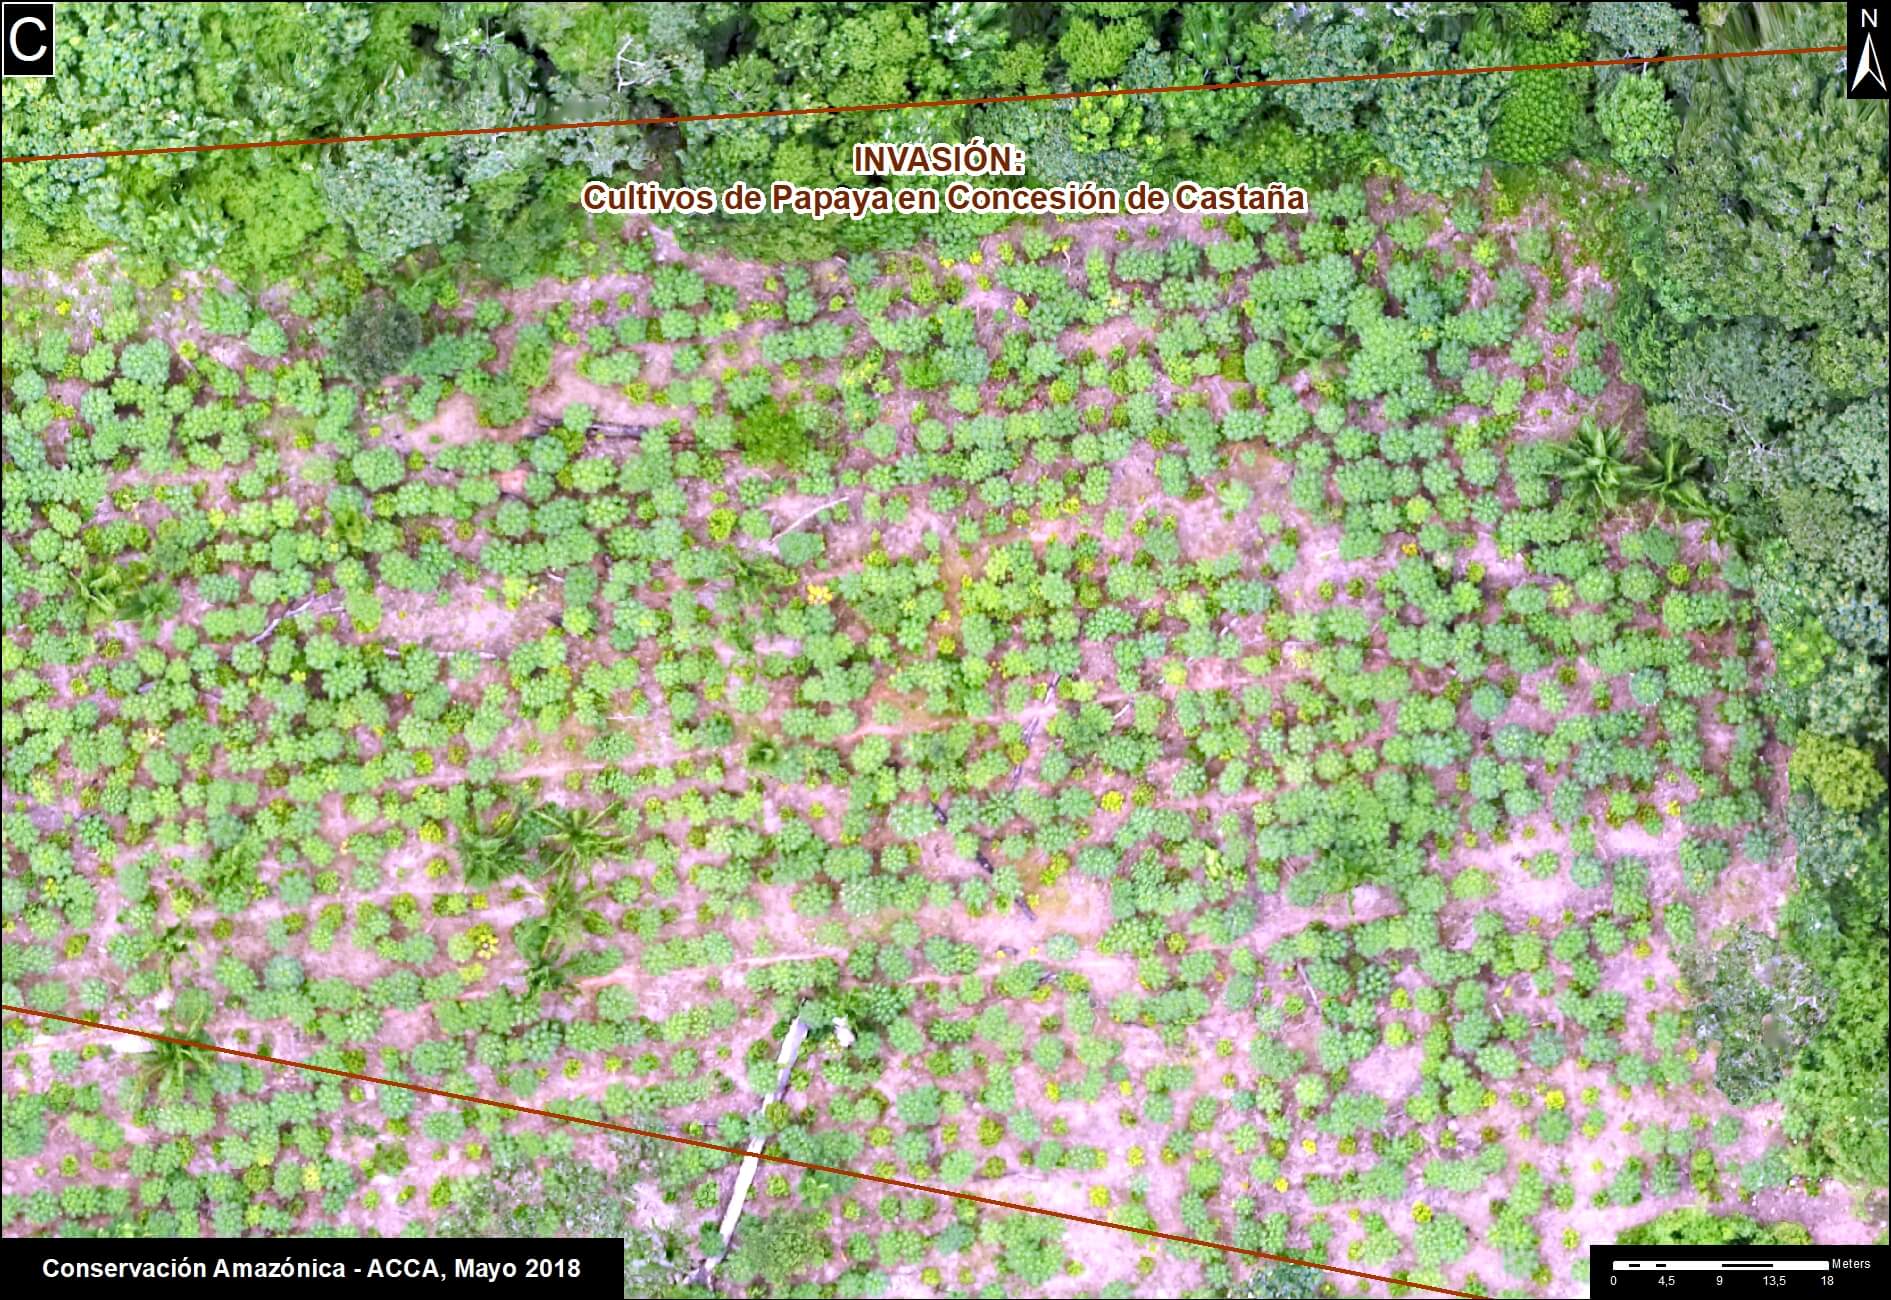
In 2018, Amazon Conservation launched a new project, funded by Google Challenge, to develop a monitoring program for Brazil nut concessions covering a million hectares (2.47 million acres) in southern Peru. For example, the following image shows the invasion of a papaya plantation that caused the recent deforestation of five acres inside a concession.

C. Drone image- Invasion of papaya in Brazil nut concession.

ACOMAT Forestry Concessions

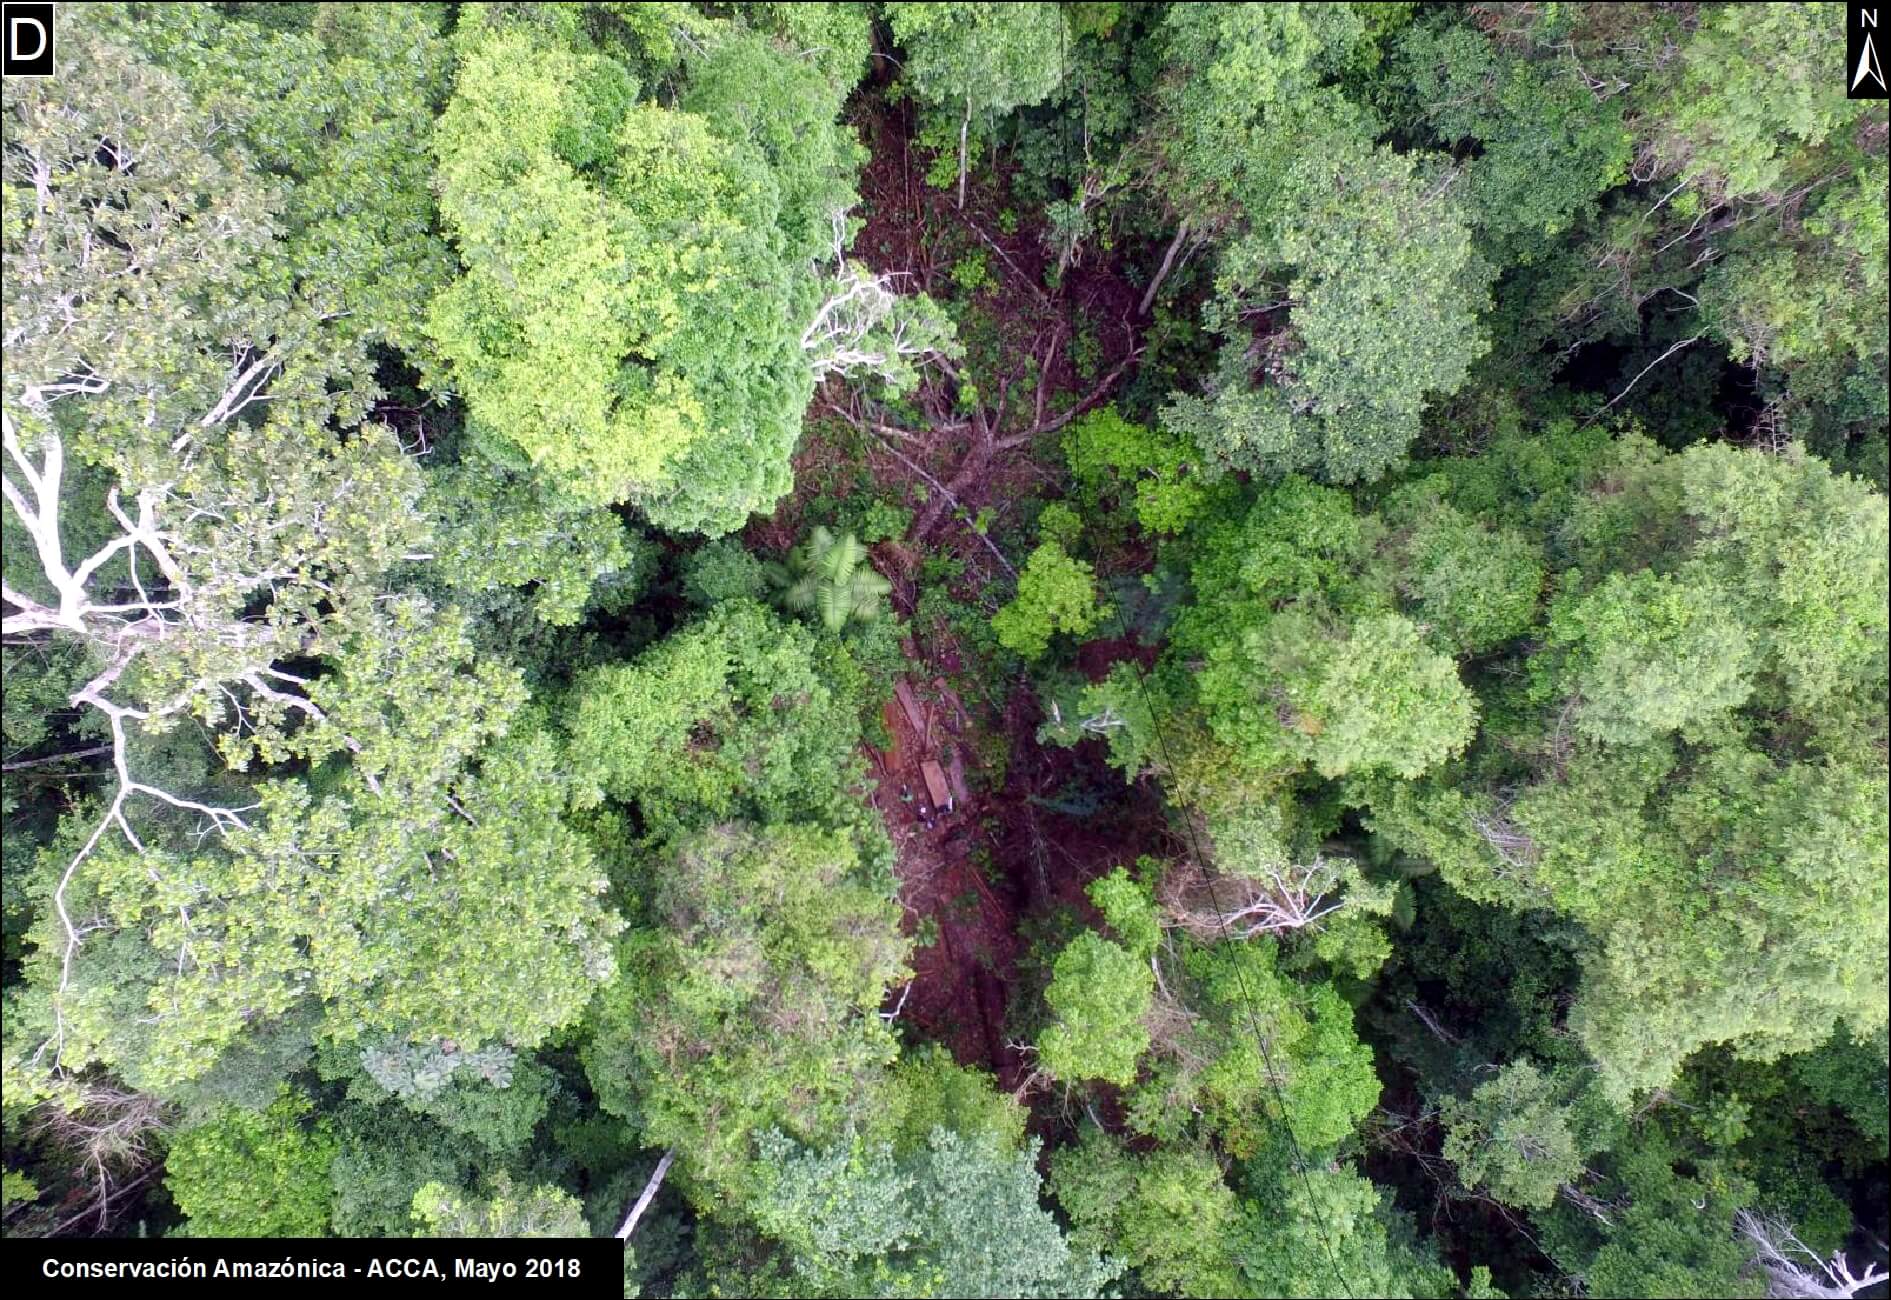
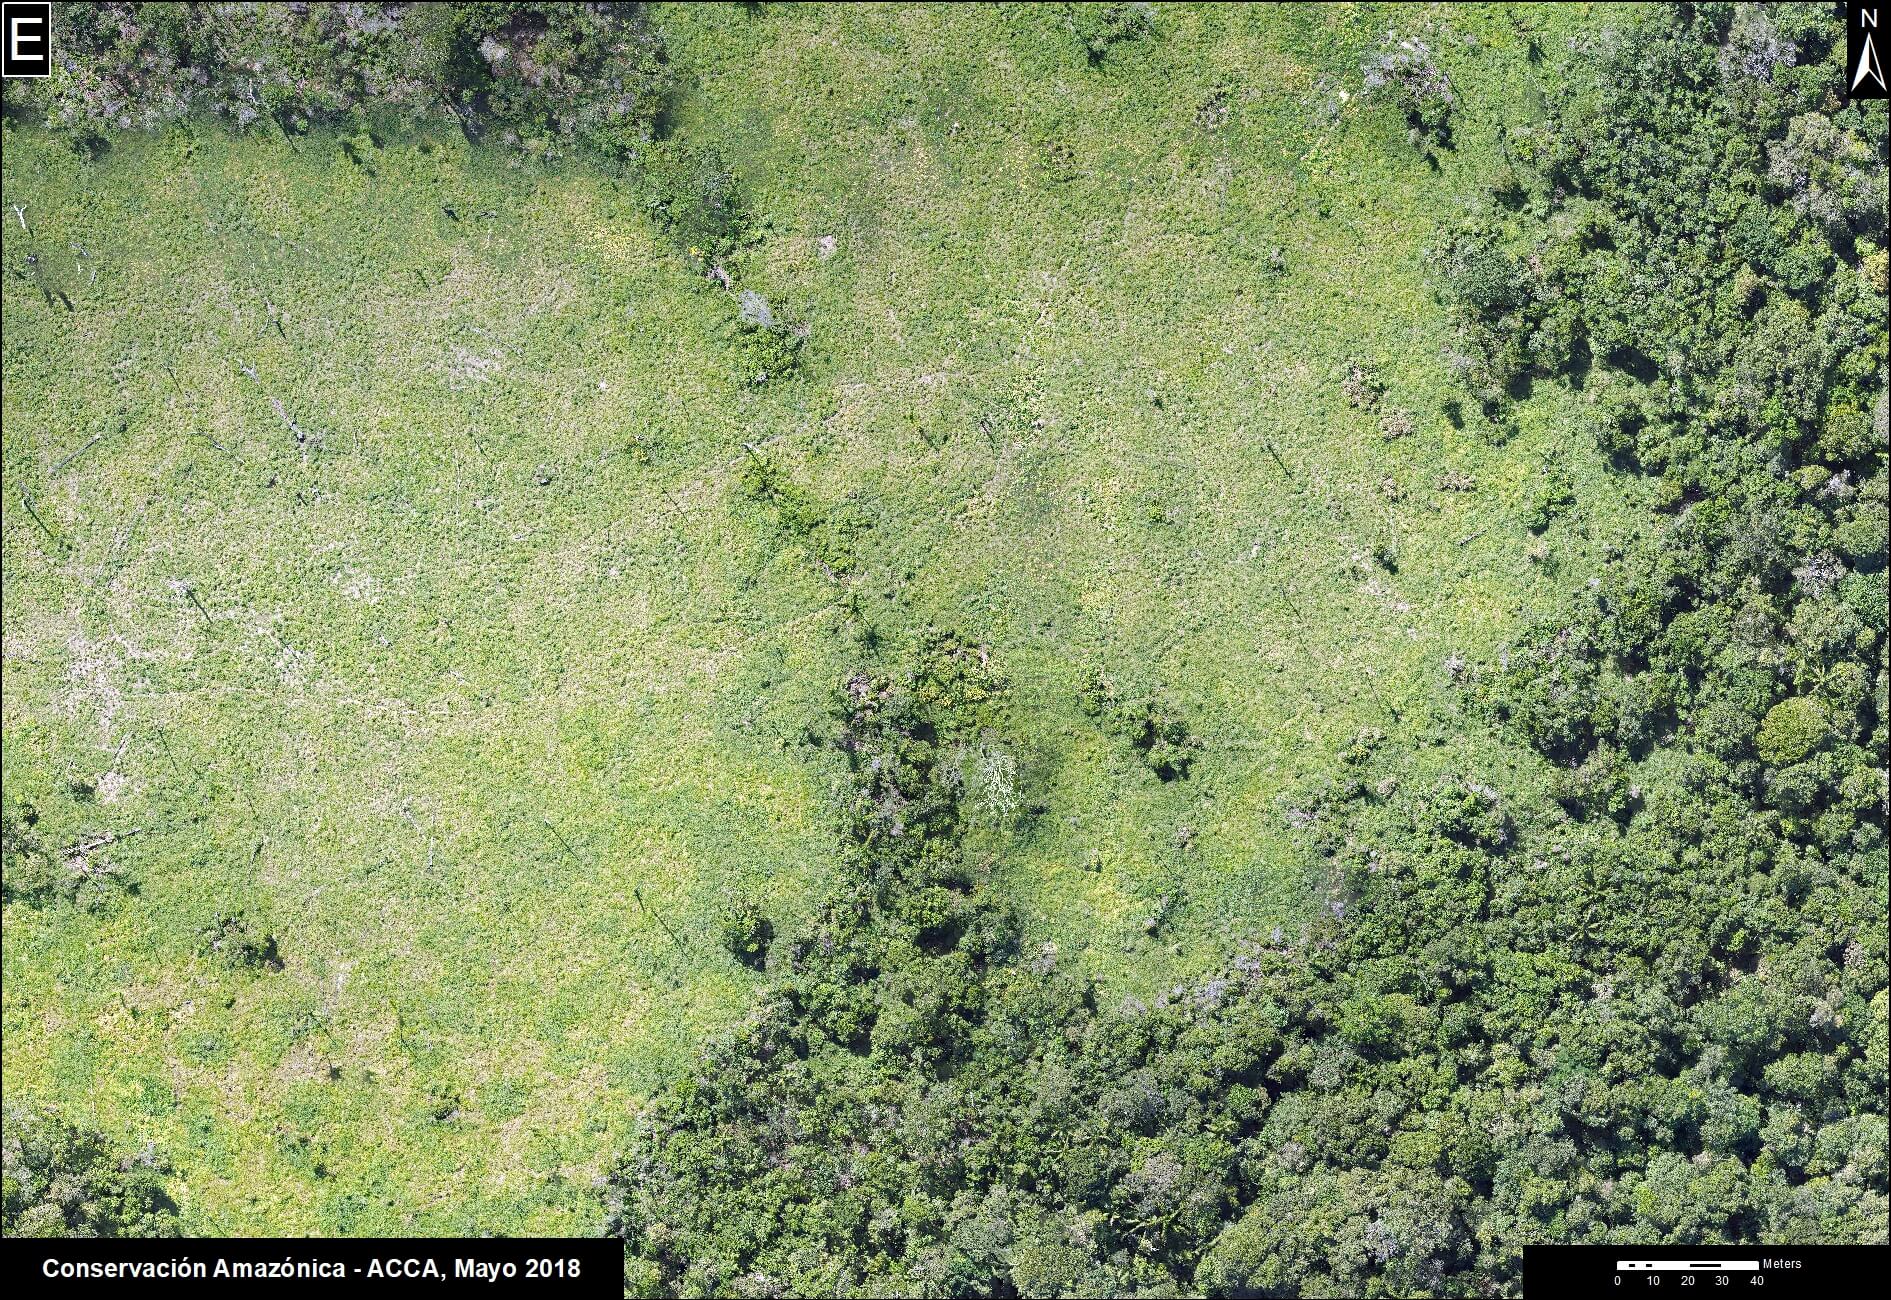
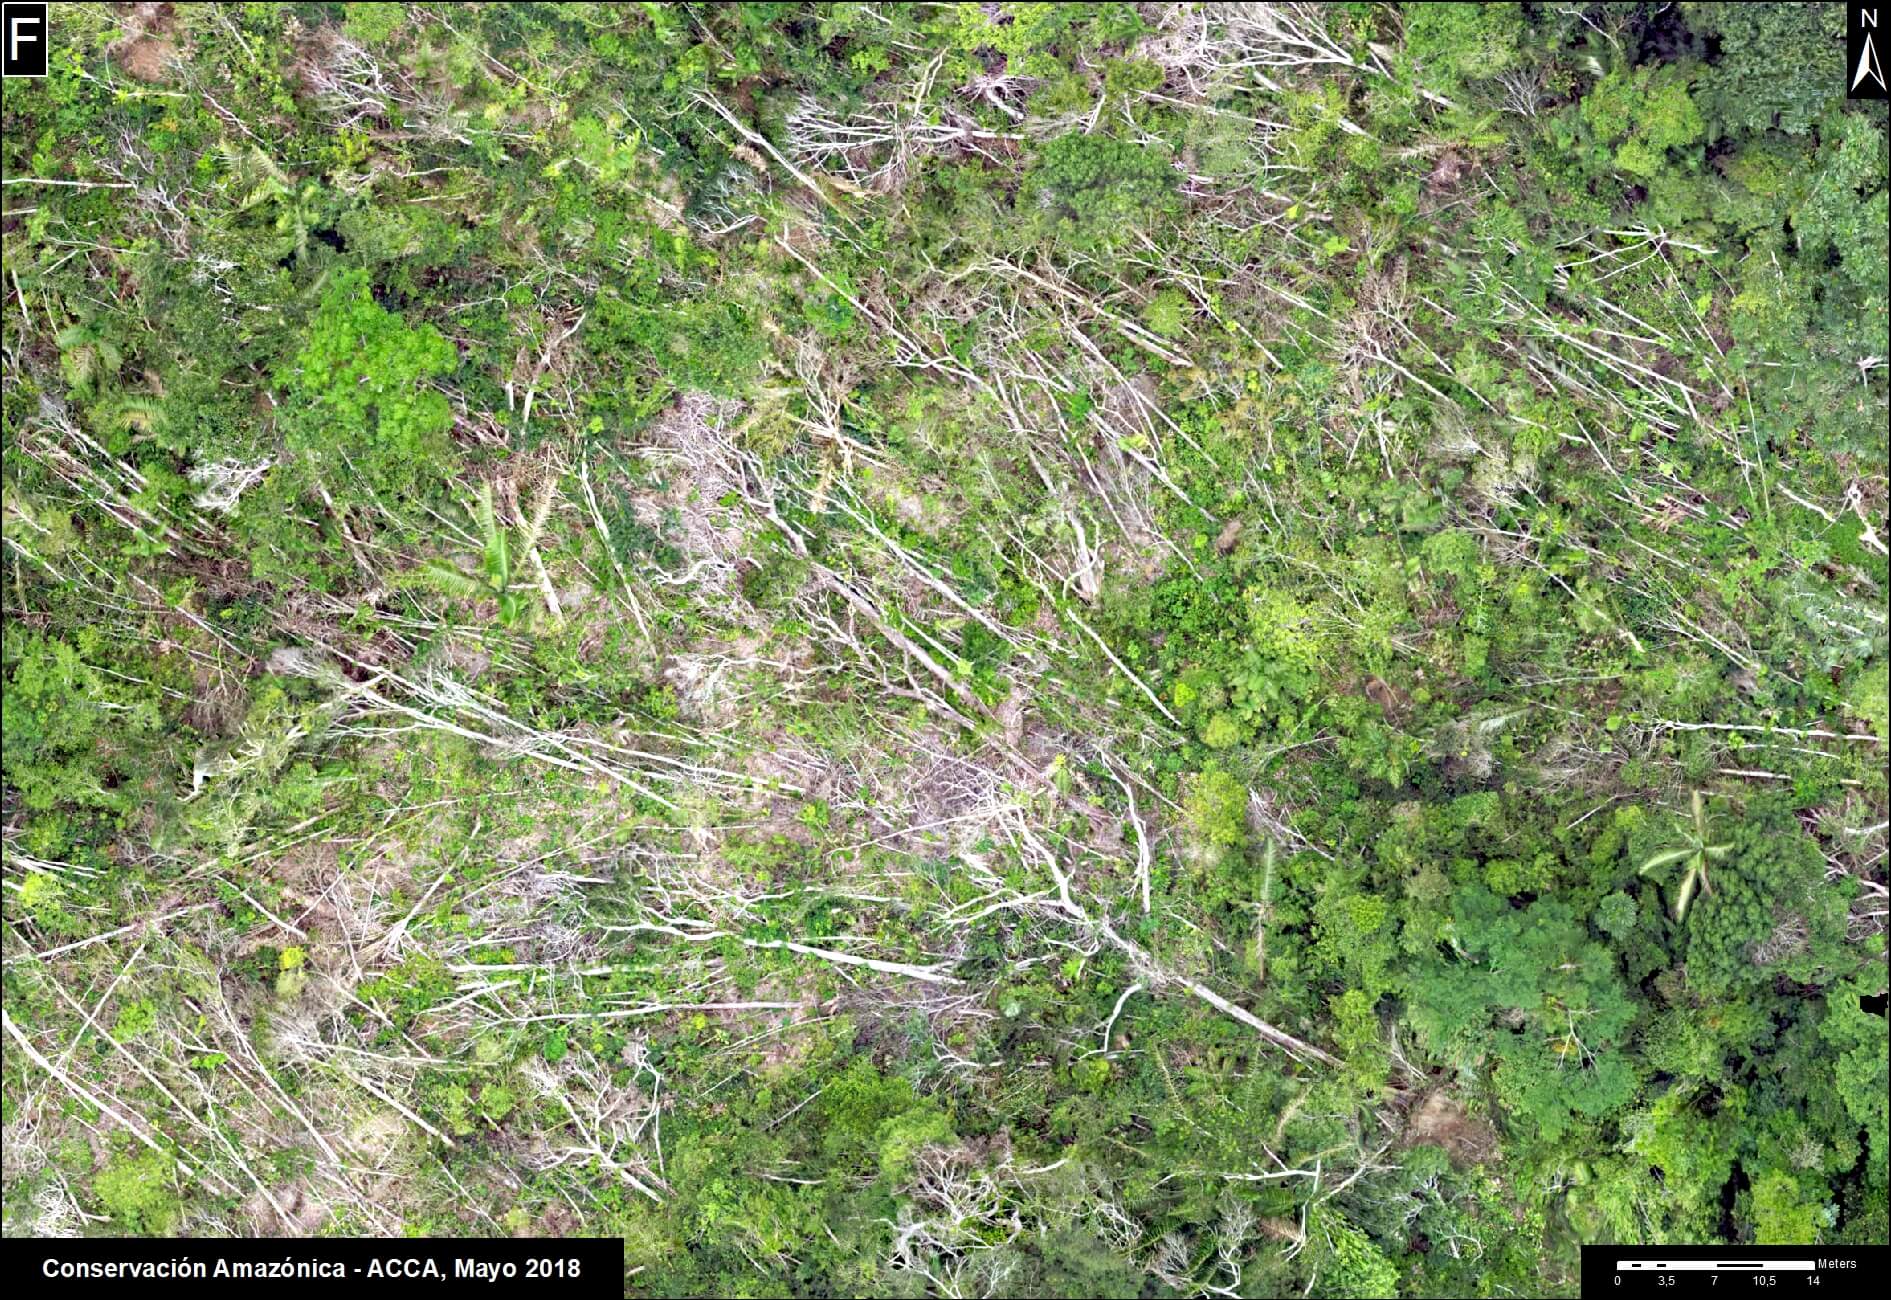
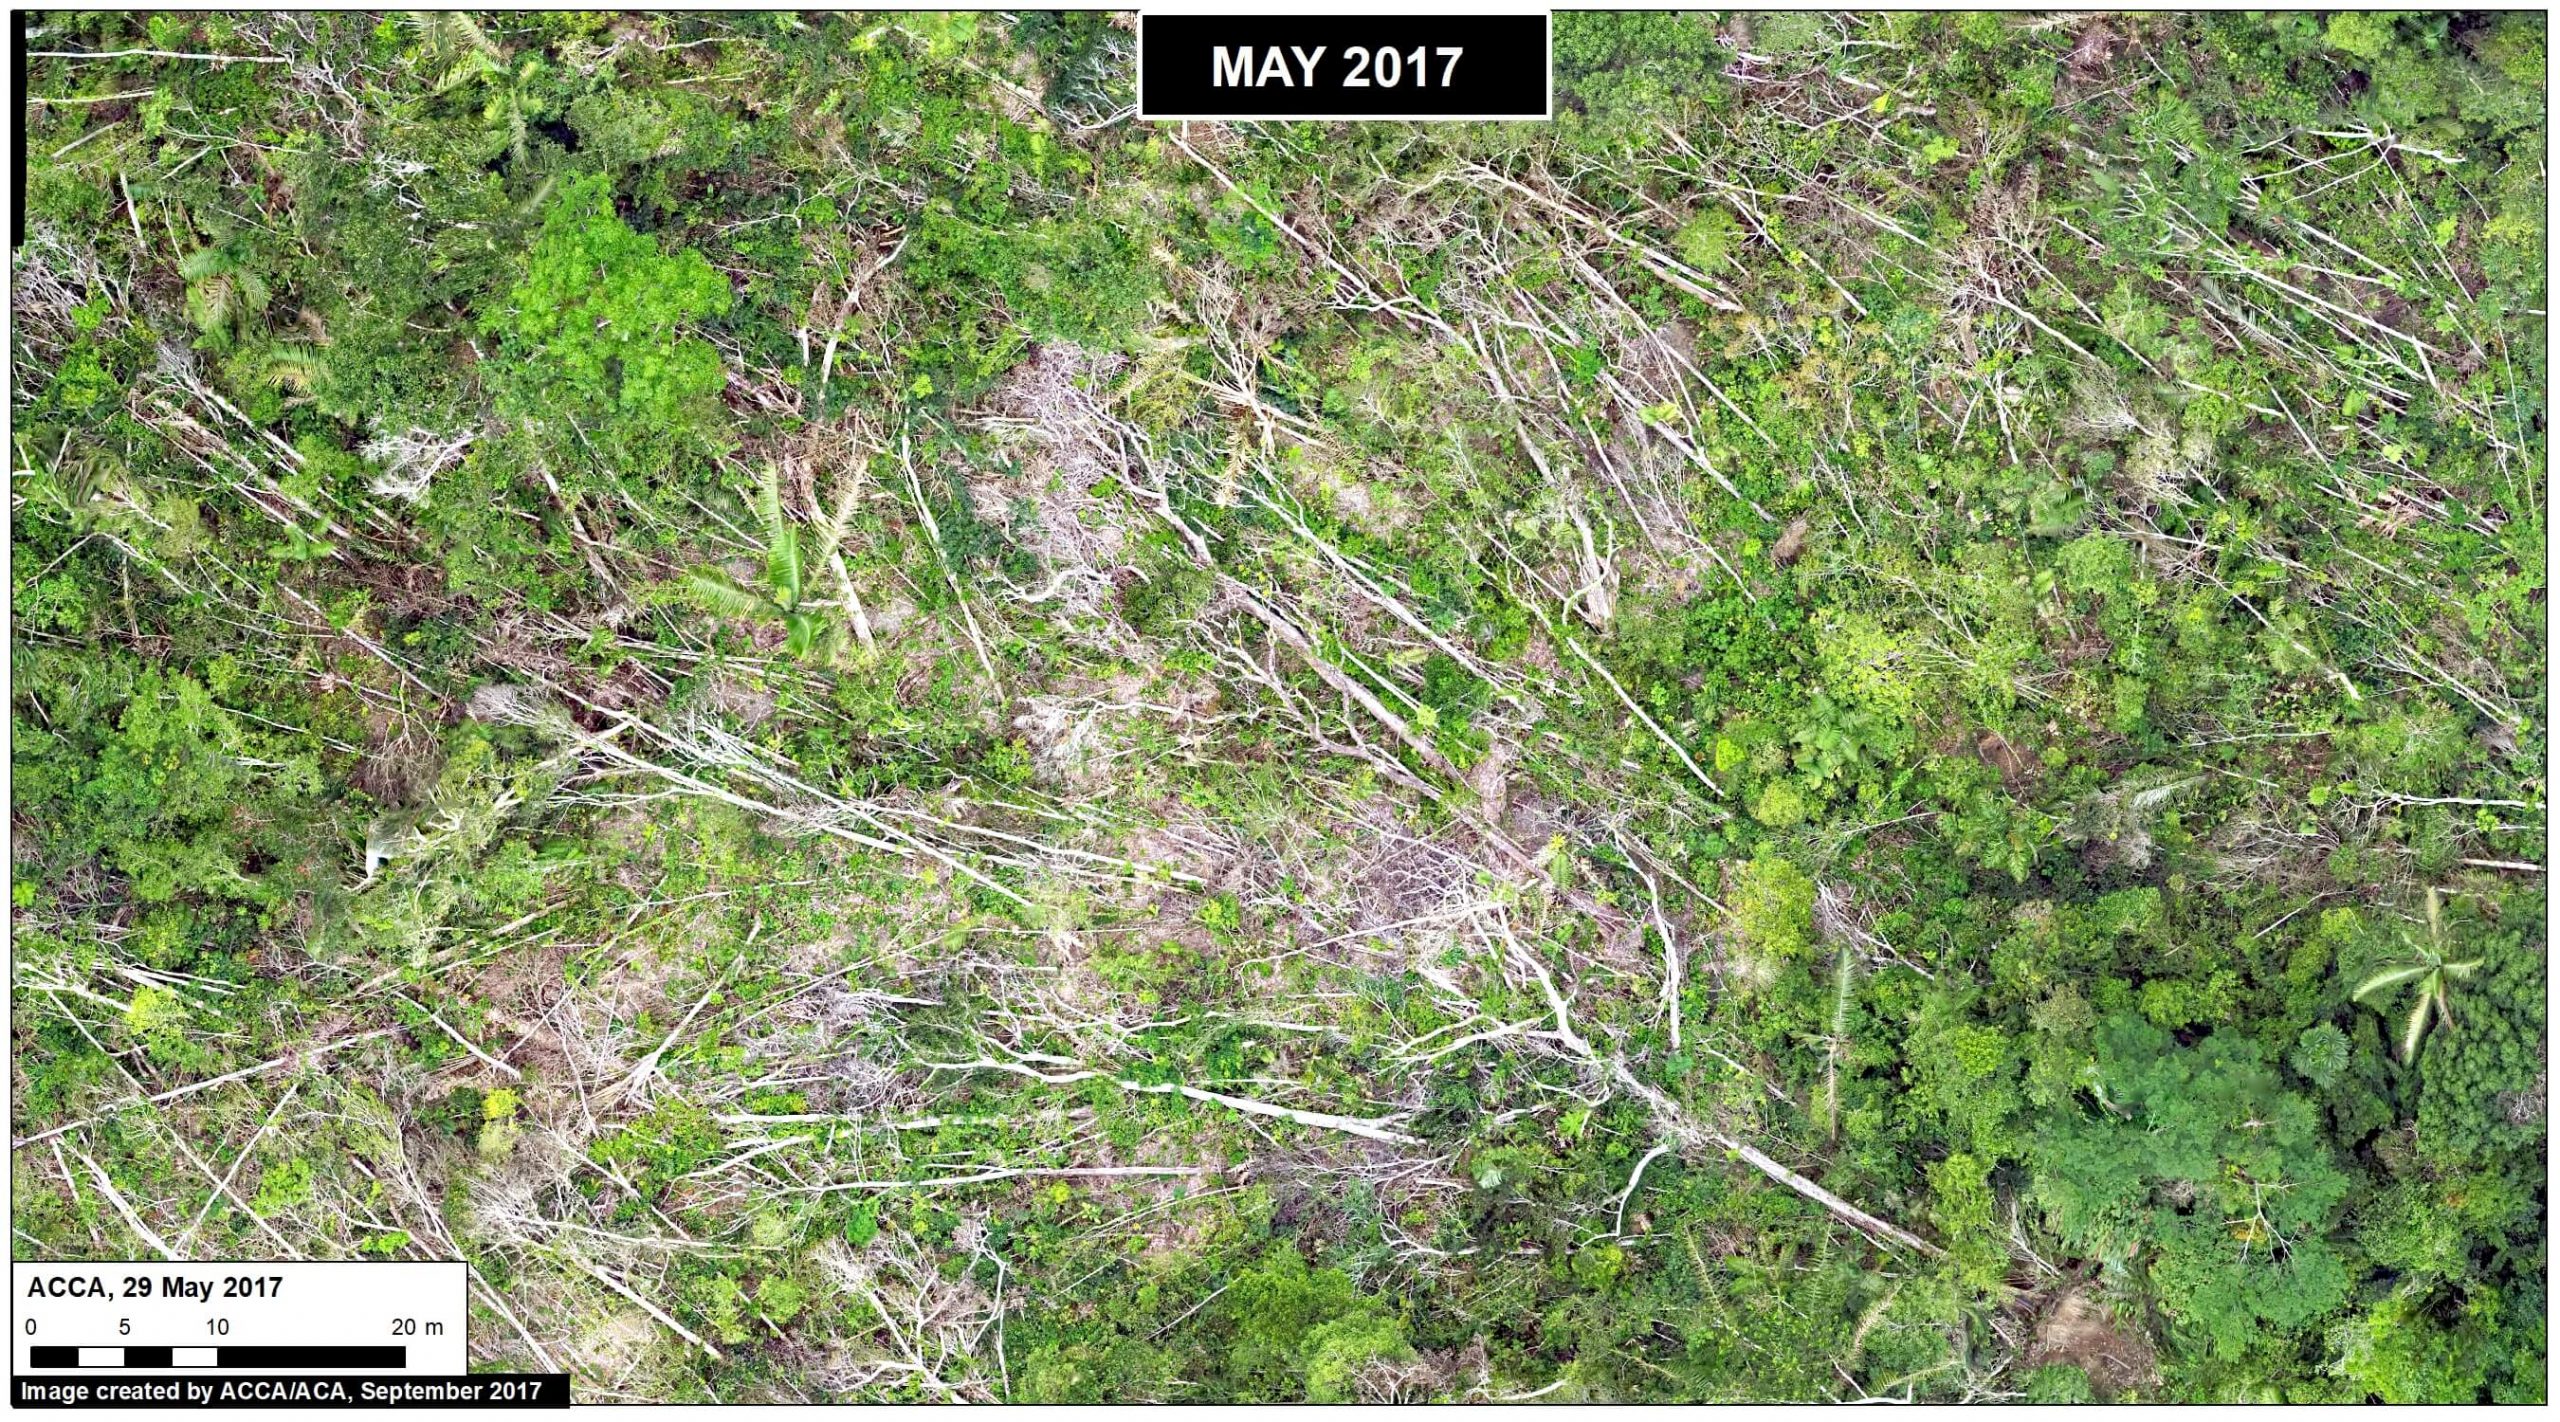
Since 2017, Amazon Conservation has been working on a project, financed by the Norwegian Agency for Development Cooperation (NORAD), to improve the monitoring of forest concessions of the local association ACOMAT (Association of Timber and Non-Timber Forest Concessionaires of the Provinces from Manu and Tambopata). The following images show examples of forest loss and degradation due to illegal logging, cattle grazing, natural loss (windstorm), and gold mining.

D. Drone image- illegal logging.
E. Drone image- cattle pasture.
F. Drone image- natural forest loss from windstorm.
G. Drone image- gold mining.

Citation

Garcia R, Novoa S, Castañeda C, Rengifo P, Jimenez M, Finer M (2018) Using Drones to monitor Deforestation and Illegal Logging. MAAP: 90.

MAAP Interactive: Deforestation Drivers In The Andean Amazon

Since its launch in April 2015, MAAP has published over 70 reports related to deforestation (and natural forest loss) in the Andean Amazon. We have thus far focused on Peru, with several reports in Colombia and Brazil as well.

These reports are meant to be case studies of the most important and urgent deforestation events. We often use forest loss alerts (known as GLAD) to guide us, and satellite imagery (from Planet and DigitalGlobe) to identify the deforestation driver.

Here we present an interactive map highlighting the drivers identified in all published MAAP reports. These drivers include gold mining, agriculture (e.g. oil palm and cacao), cattle pasture, roads, and dams (see icon legend below map). We also include natural causes such as floods and blowdowns (fire included under agriculture since most human caused). Furthermore, we highlight deforestation events within protected areas. Note that you can filter by driver by checking boxes of interest.

We hope the result is one of the most detailed and up-todate resources on patterns and drivers of deforestation in the Andean Amazon. Over the coming year we will continue to focus on Peru and Colombia, and begin to include Ecuador and Bolivia as well.

To view the interactive map, please visit:

MAAP Interactive: Deforestation Drivers in the Andean Amazon
https://maaproject.org/interactive/

For more information on patterns and drivers of deforestation in the Peruvian Amazon, see our latest News and Resources 

MAAP #73: United States’ Only National Tropical Rainforest Ravaged by Hurricane Maria (Puerto Rico)

Image 73. Base Map. El Yunque National Forest is located in eastern Puerto Rico.

MAAP usually focuses on deforestation in the Andean Amazon region, but has a larger interest in tropical forests in general. Thus, we present this analysis in that larger framework.

The New York Times recently reported that Hurricane Maria “obliterated” the United States’ only national tropical rain forest as the powerful Category 4 hurricane (with 150 mph winds) passed over Puerto Rico on September 20.

Here, we present a series of fresh satellite images from October that indeed show the severe impact to nearly all 28,400 acres of El Yunque National Forest (see Base Map). El Yunque is managed by the United States Forest Service and is the only tropical rain forest in the US national forest system.

Throughout the article, click on each image to enlarge.

Photo from ” The Naked Landscape Presentation”, US Forest Service,

MAAP #70: “Hurricane Winds” In the Peruvian Amazon, A 13 Year Analysis

In an earlier report, MAAP #54, we described the natural phenomenon of “hurricane winds” in the Peruvian Amazon. These strong wind storms (not true hurricanes) cause a chain reaction of fallen trees and may blow down hundreds of acres of Amazonian forest (see Drone Image below).

This report presents an analysis of the frequency and intensity of hurricane winds in the Peruvian Amazon over the past 13 years (2005-17). The analysis is based on the annual forest loss data and early warning alerts data.

Drone Image. Source: ACCA

MAAP #65: Deforestation Hotspots Of 2017 in The Peruvian Amazon

In an earlier report, MAAP #40, we highlighted the power of combining early warning GLAD* alerts with analysis of high-resolution satellite images (for example, from the company Planet), as part of a comprehensive near real-time deforestation monitoring system.


In the current report, we analyze the GLAD alerts for the first half of 2017 (through July 17) to identify current deforestation hotspots in the Peruvian Amazon.** These alerts indicate an estimated total forest loss of 37,000 acres (15,000 hectares) thus far during the year.

Image 65 (see right) highlights the 2017 deforestation hotspots, defined here as areas with medium to high density of forest loss.

Below, we describe and show images of the most intense hotspots, indicated in red and orange.

Image 65. Data: MINAM/PNCB, UMD/GLAD, SERNANP, MAAP

These areas include:

  • Buffer zones of Tambopata National Reserve and Cordillera Azul National Park
  • Natural loss due to blowdowns from “hurricane winds,” in the Madre de Dios region
  • Northwest border with Colombia

MAAP #59: Power Of “Small Satellites” From Planet


The company Planet is pioneering the use of high-resolution “small satellites” (Image 59a). They are a fraction of the size and cost of traditional satellites, making it possible to produce and launch many as a large fleet. Indeed, Planet now operates 149 small satellites, known as Doves, the largest fleet in history. The Doves capture color imagery at 3-5 meter resolution, and will line up (like a string of pearls) to cover everywhere on Earth’s land area every day.

Image 59a. Source: Planet

Over the past year, MAAP* has demonstrated the power of Planet imagery to monitor deforestation and degradation in near real-time in the Amazon. A consistent flow of new, high-resolution imagery is needed for this type of work, making Planet’s fleet model ideal. Below, we provide a recap of key MAAP findings based on Planet imagery, for a diverse set of cases including gold mining, agriculture deforestation, logging roads, wildfire, blowdowns, landslides, and floods.**

*MAAP has been fortunate to have access to Planet imagery via the Ambassador program.
**Note: In the images below, the red dot () indicates the same location across time between panels.

MAAP #54: Natural Forest Loss Due To “Hurricane Winds” in the Peruvian Amazon

Image 54. Base Map
Image 54. Base Map

A little-known, but not uncommon, type of natural forest loss in the Peruvian Amazon is blowdown due to strong winds from localized storms (locally known as “hurricane winds”).

The intense winds cause a chain reaction of fallen trees, resulting in a fan-shaped pattern of forest loss with a defined orientation following the direction of the storm winds.

This phenomenon has previously been reported in Brazil and Colombia (see References below).

The base image (Image 54) shows the location of some recent (during 2016) examples of forest loss due to blowdowns in the Peruvian Amazon.

These examples were initially detected from analysis of GLAD alerts, early warning tree loss data produced by the University of Maryland (see Annex).

Below, we detail the 7 blowdown examples indicated on the base map. They are located in both northern (Loreto region) and southern (Madre de Dios region) Peru, and include 4 Protected Areas. The forest loss in these examples ranged from 24 to 900 hectares.