MAAP, an initiative of Amazon Conservation, specializes in satellite-based, real-time deforestation monitoring of the Amazon. Our geographic focus covers five countries: Bolivia, Brazil, Colombia, Ecuador, and Peru (see Base Map).
We found that, since 2001, this vast area lost 65.8 million acres (26.6 million hectares) of primary forest, an area equivalent to the size of the United Kingdom (or the U.S. state of Colorado).

Base Map. Amazon Deforestation, 2001-2019. Data: UMD/GLAD, Hansen/UMD/Google/USGS/NASA, MAAP. Click to see image in high resolution.
In 2019, we published 18 high-impact reports on the most urgent cases of deforestation. 2019 highlights include:
- Fires in the Brazilian Amazon actually burned freshly deforested areas (MAAP #113);
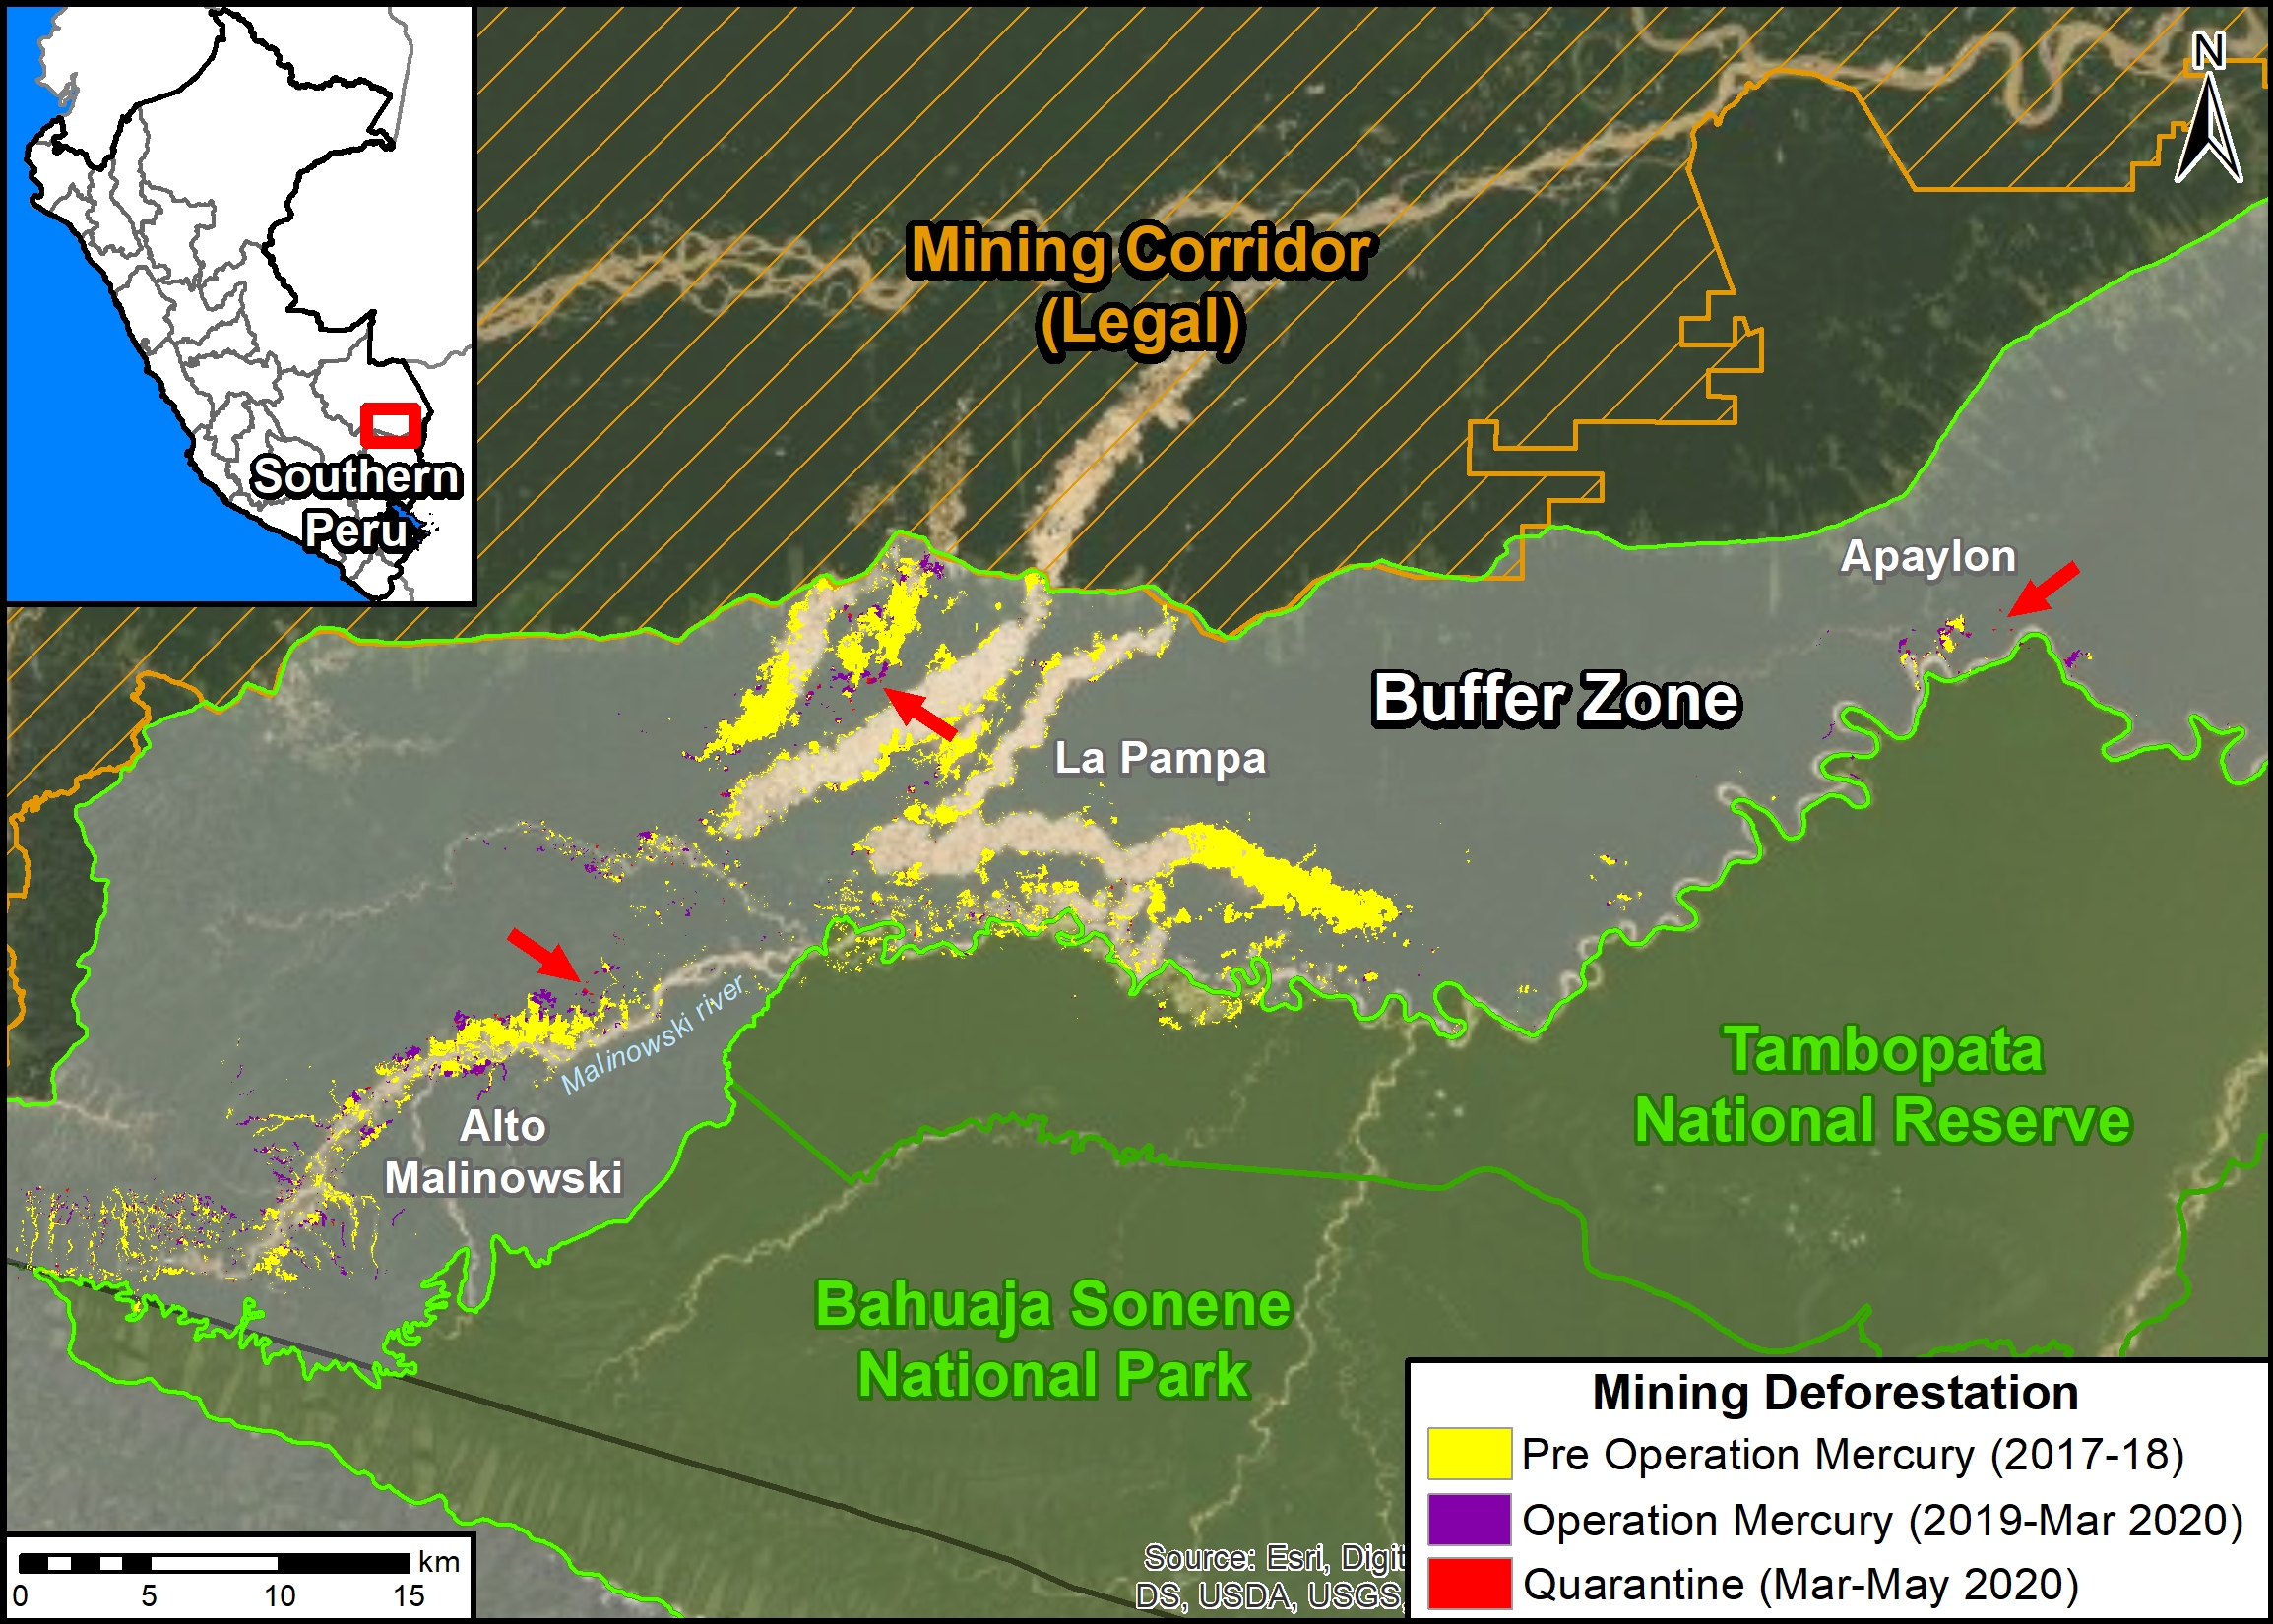
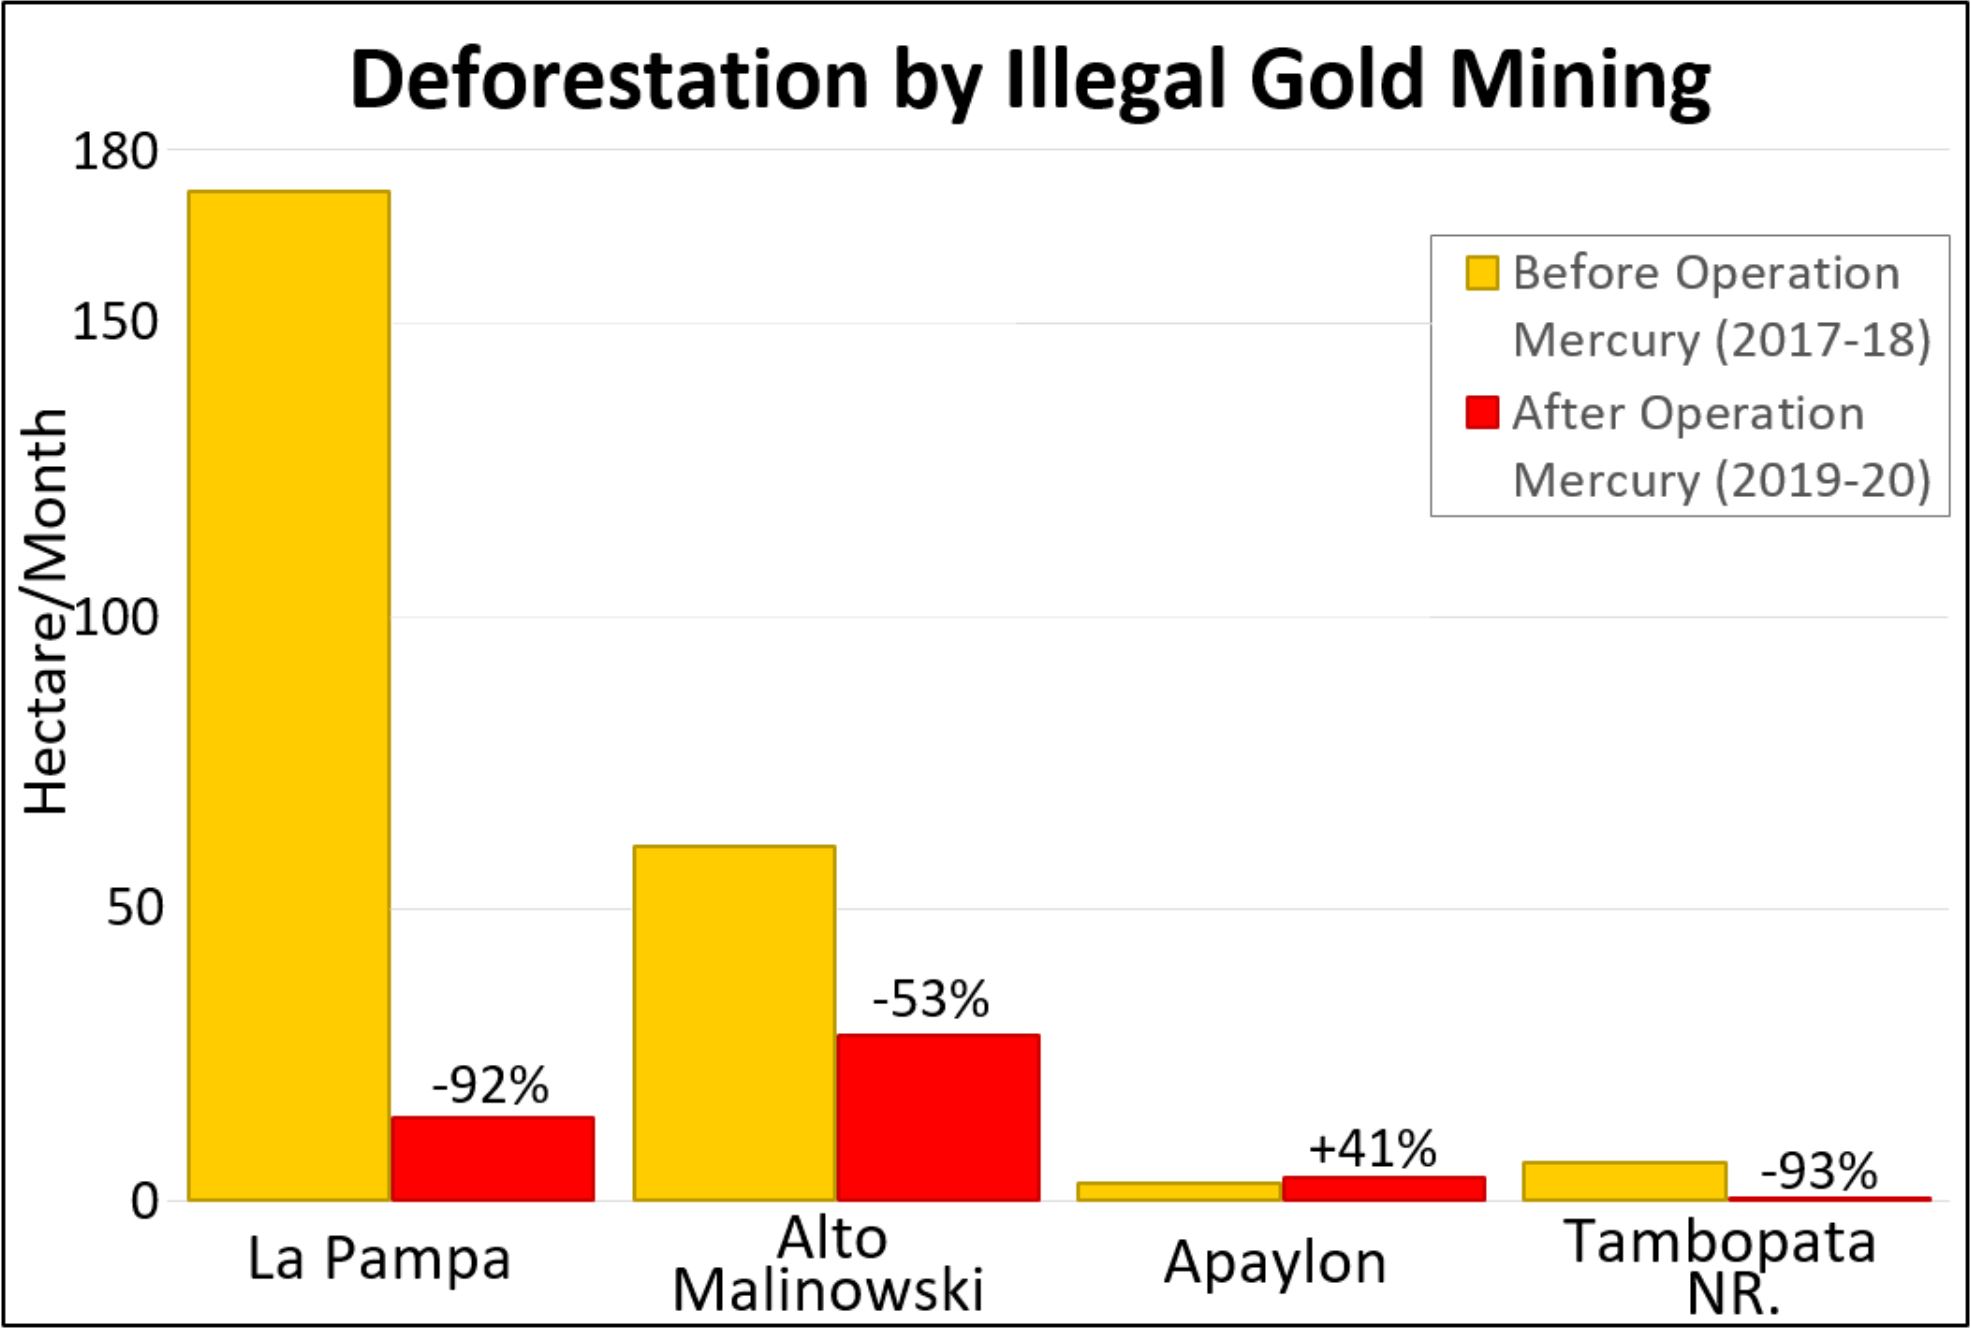
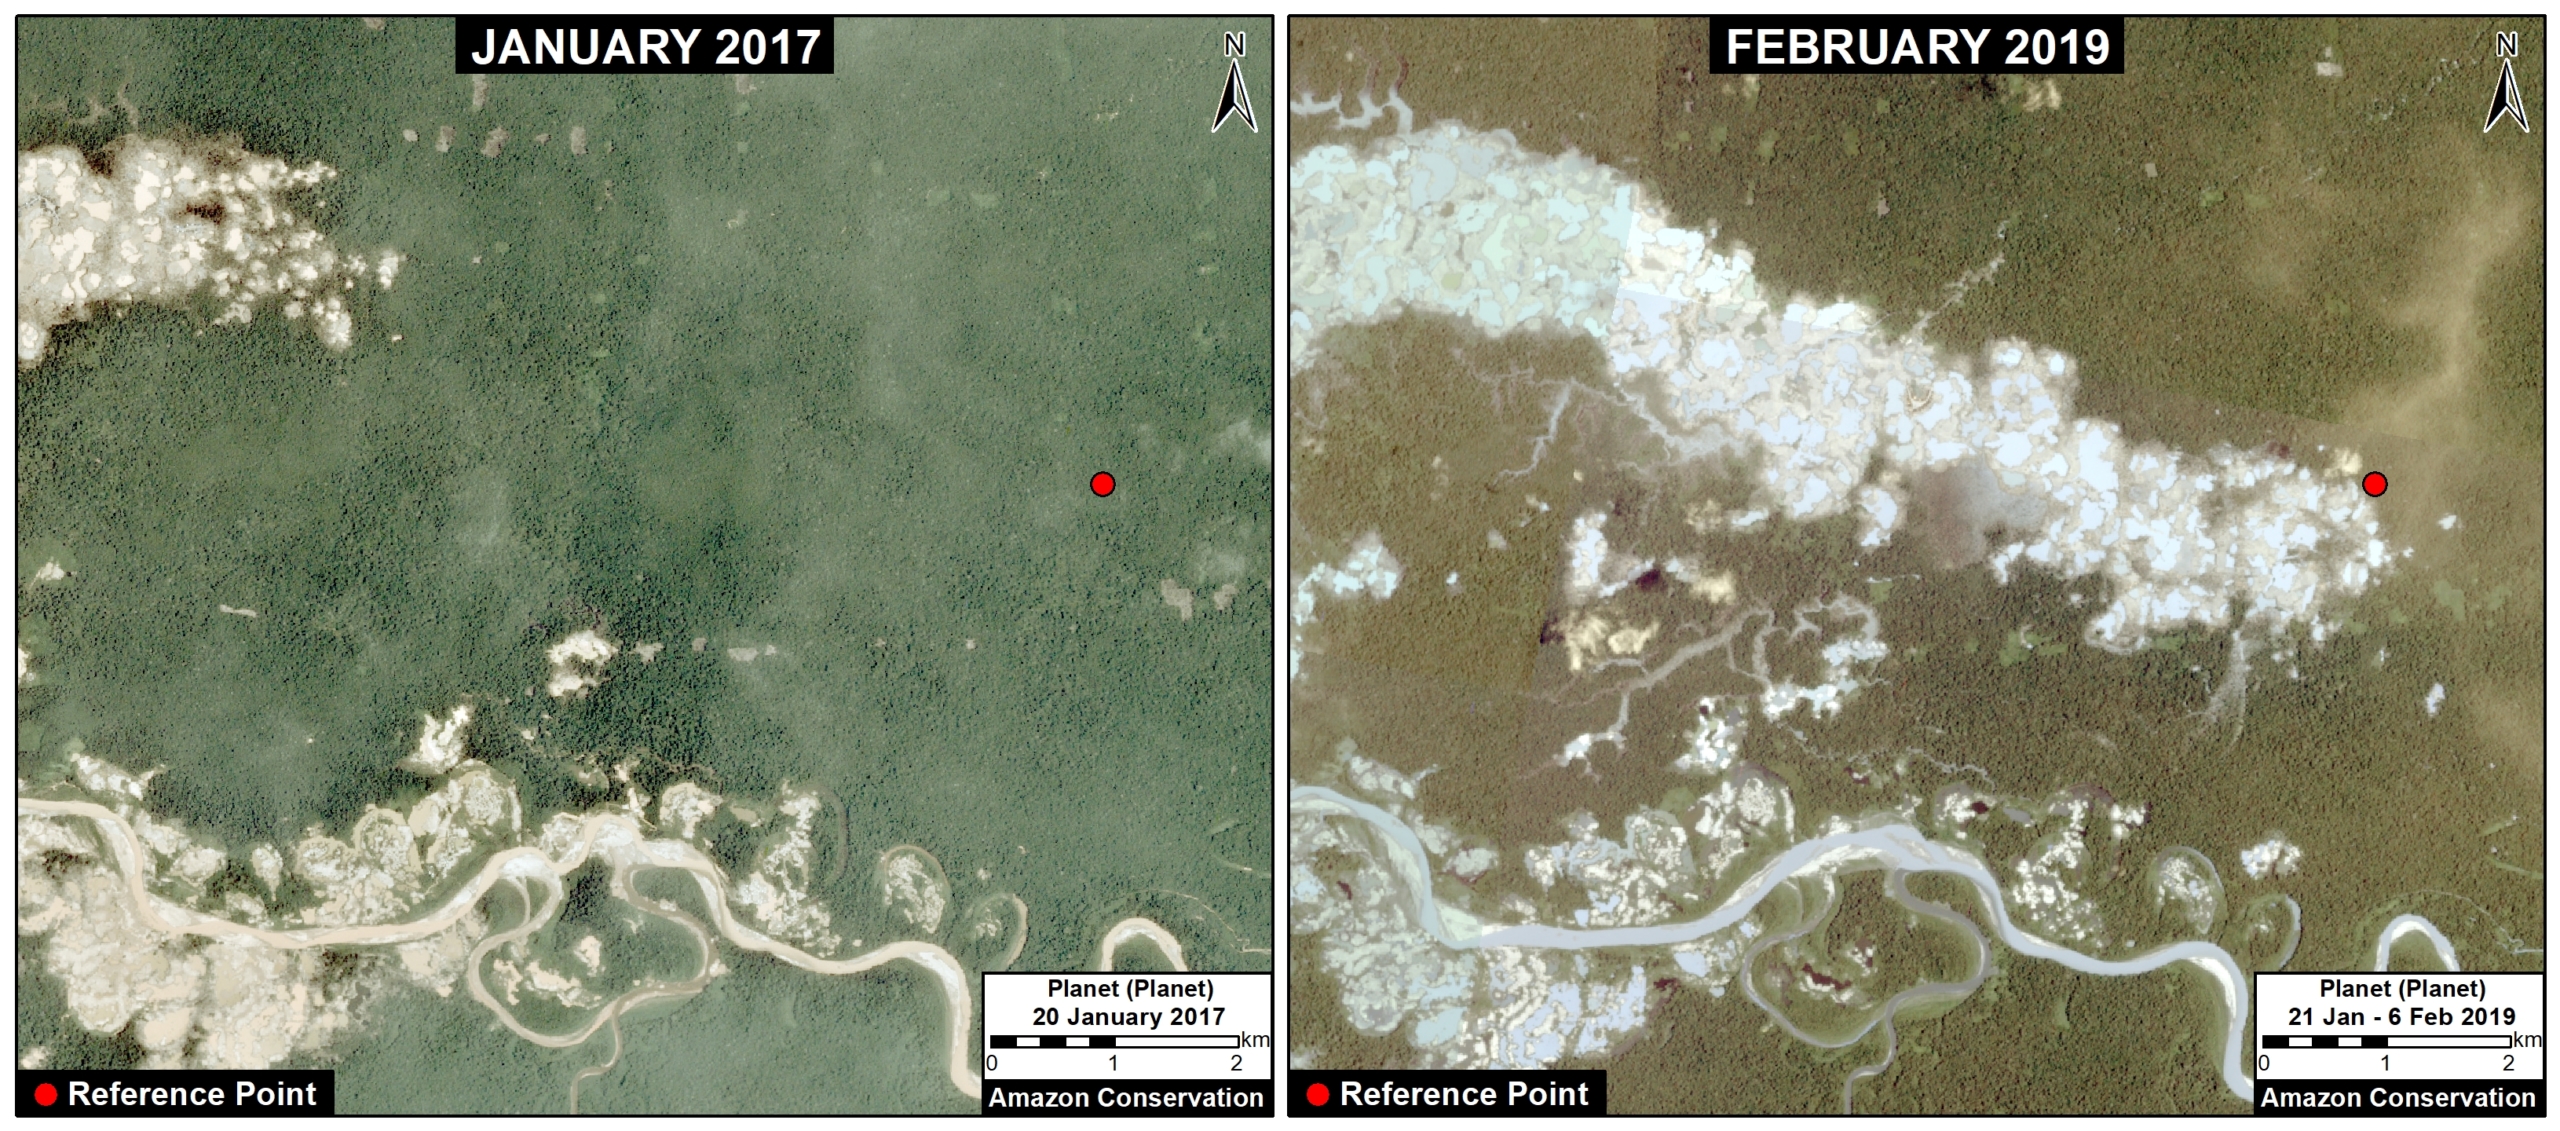
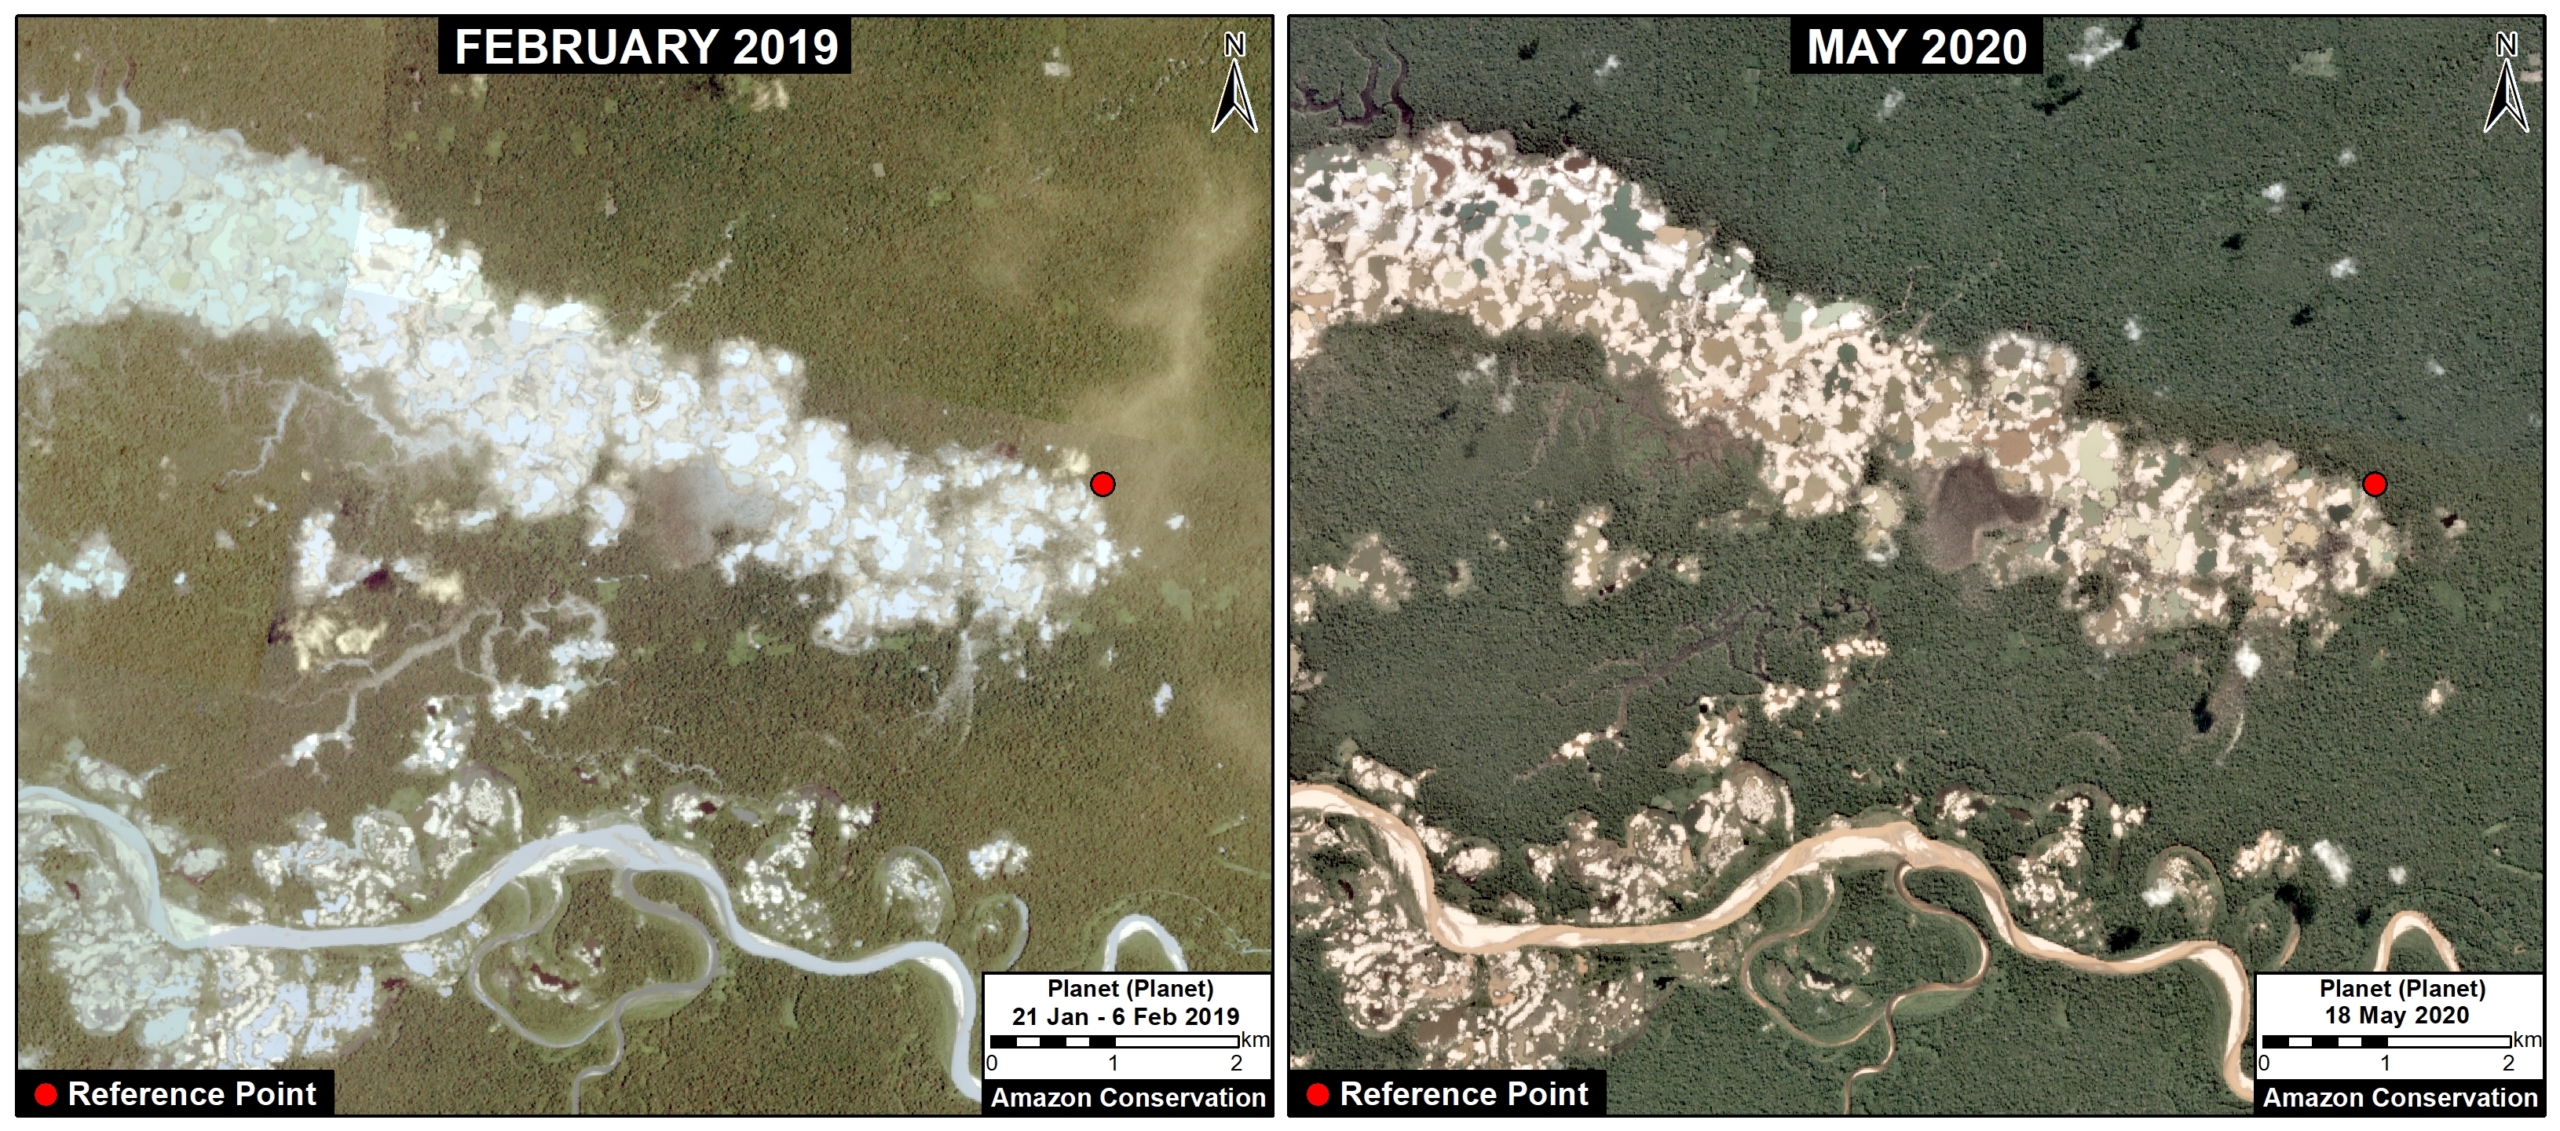
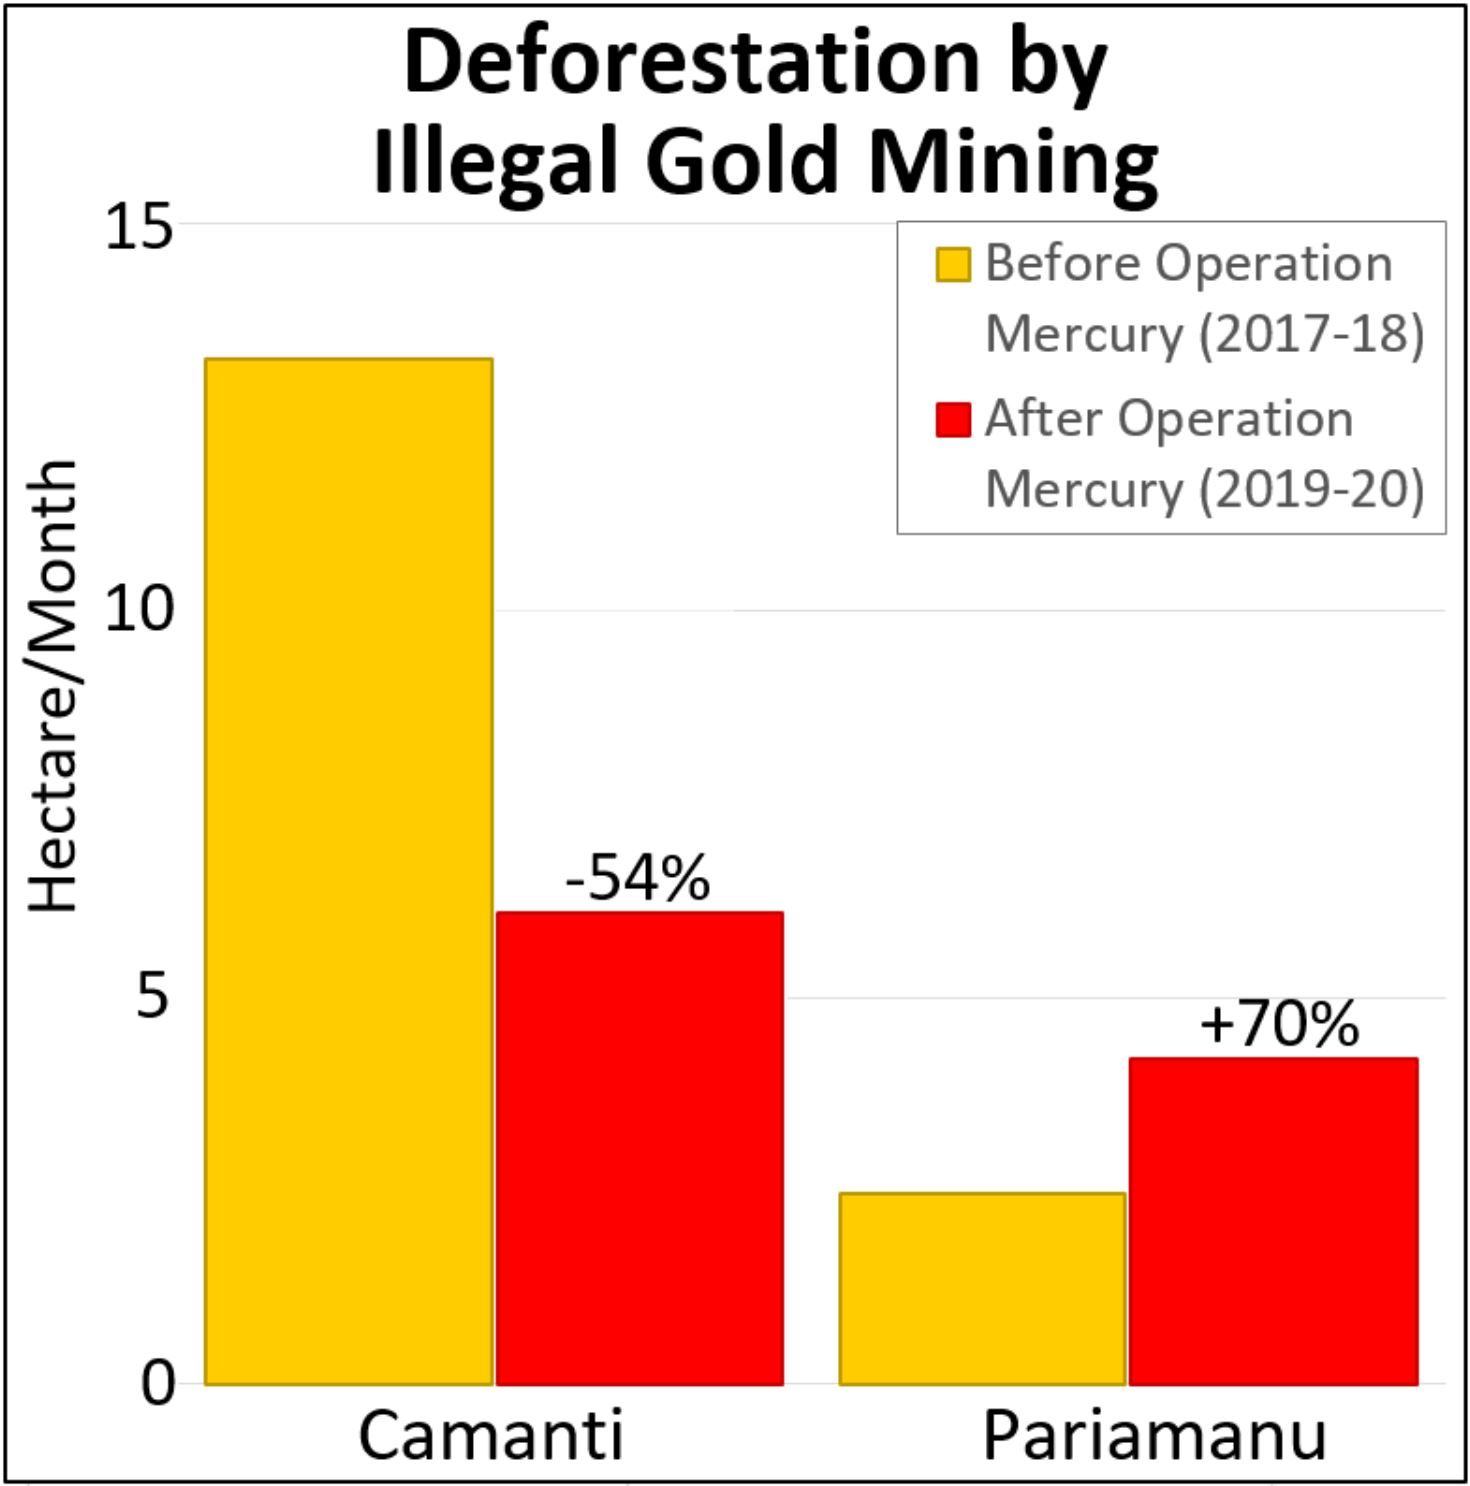
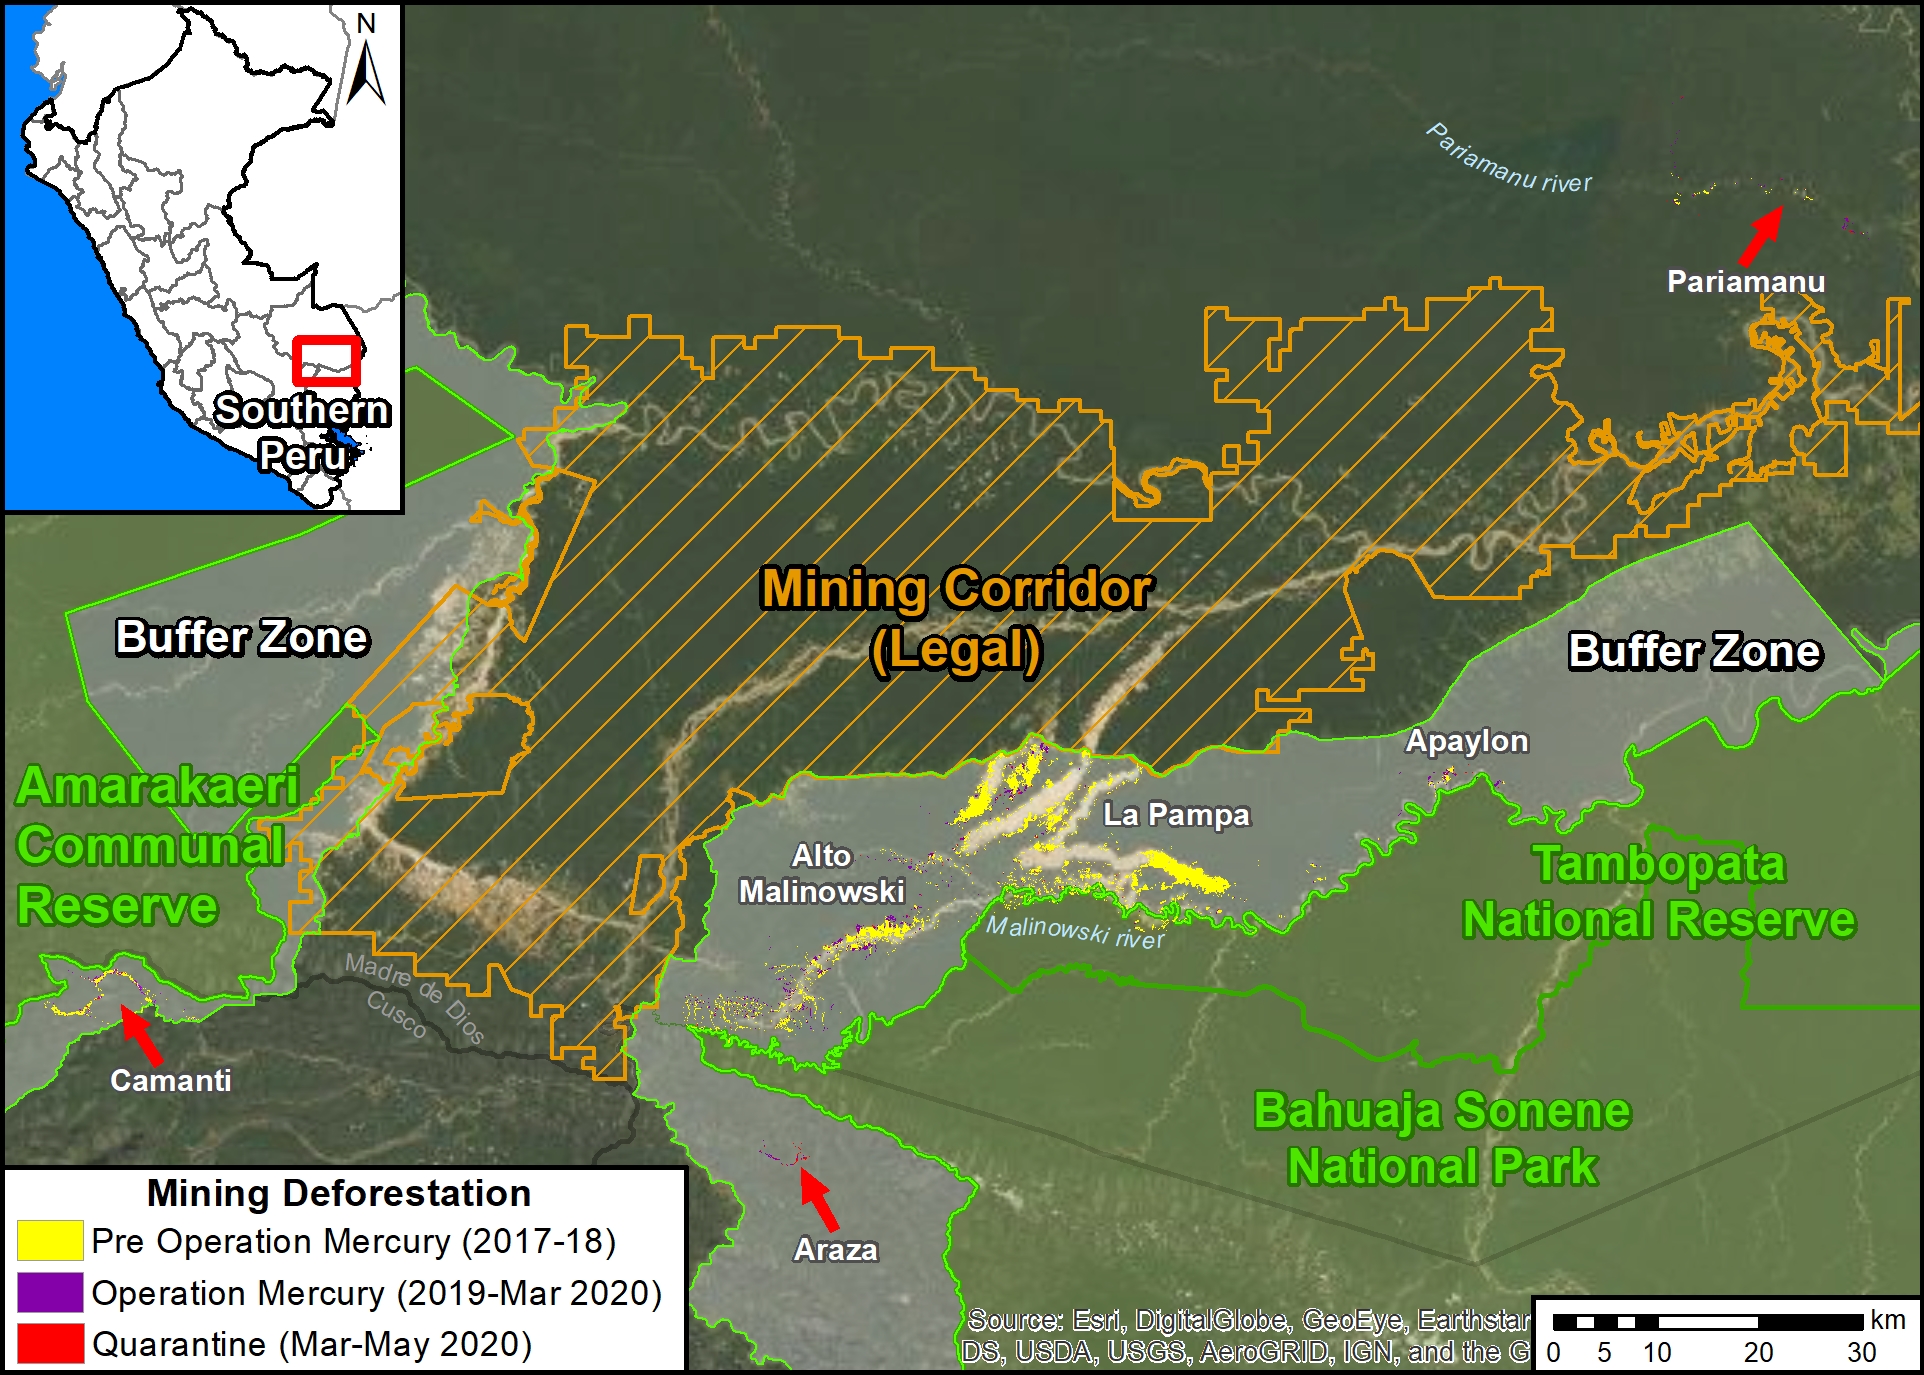
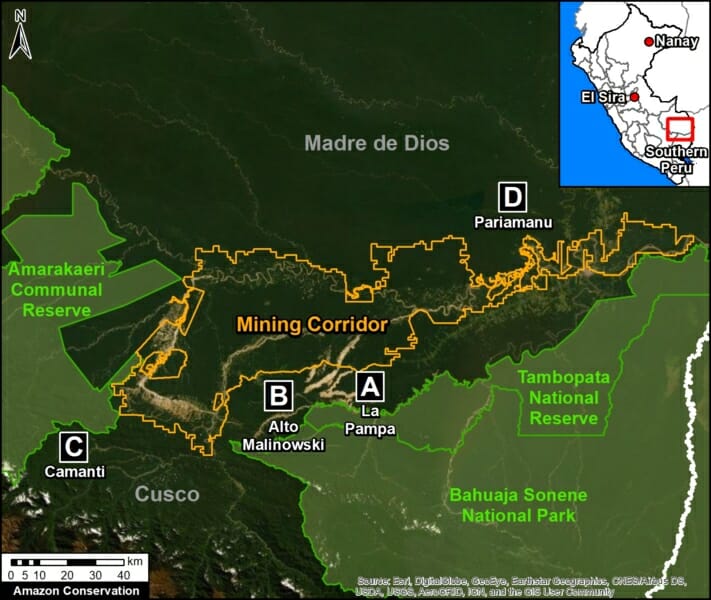
- Effective illegal gold mining crackdown in the Peruvian Amazon as a result of the government’s Operation Mercury (MAAP #104);
- Illegal invasion of protected areas in the Colombian Amazon (MAAP #106);
- Construction of oil-drilling platforms in the mega-diverse Yasuni National Park of the Ecuadorian Amazon (MAAP #114).
Here, in our annual Synthesis Report, we go beyond these emblematic cases and look at the bigger picture for 2019, describing the most important deforestation trends and hotspots across the Amazon.
*Note: to download a PDF, click the “Print” button below the title.
Synthesis Key Findings
Trends: We present a GIF comparing deforestation trends for each country since 2001. The preliminary 2019 estimates have several important headlines:
- Possible major deforestation decrease in the Colombian Amazon following a dramatic increase over the previous three years;
- Likely major deforestation increase in the Bolivian Amazon due to forest fires;
- Downward deforestation trend continues in the Peruvian Amazon, but still historically high;
- Deforestation of 2.4 million acres in the Brazilian Amazon, but the trend depends on the data source.
Hotspots: We present a Base Map highlighting the major deforestation hotspots in 2019. Results emphasize the deforestation and fires in the Brazilian Amazon, along with several key areas in Colombia, Peru, and Bolivia.
Deforestation Trends 2001-2019
The following GIF shows deforestation trends for each country between 2001 and 2019 (see descriptive notes below). Click here for static versions of each graph.
Three important points about the data: First, as a baseline, we use annual forest loss from the University of Maryland to have a consistent source across all five countries (thus it may differ from official national data). Second, we applied a filter to only include loss of primary forest (see Methodology). Third, the 2019 data represents a preliminary estimate based on early warning alerts.

- Deforestation in the Ecuadorian Amazon is relatively low, reaching a maximum of 18,800 hectares (46,500 acres) in 2017. The estimate for 2019 is 11,400 hectares (28,000 acres).
.
- In the Bolivian Amazon, deforestation decreased in 2018 to 58,000 hectares (143,000 acres) after a peak in 2016 of 122,000 hectares (302,000 acres). However, with the recent widespread forest fires, deforestation increased again in 2019, to 135,400 hectares (334,465 acres).
.
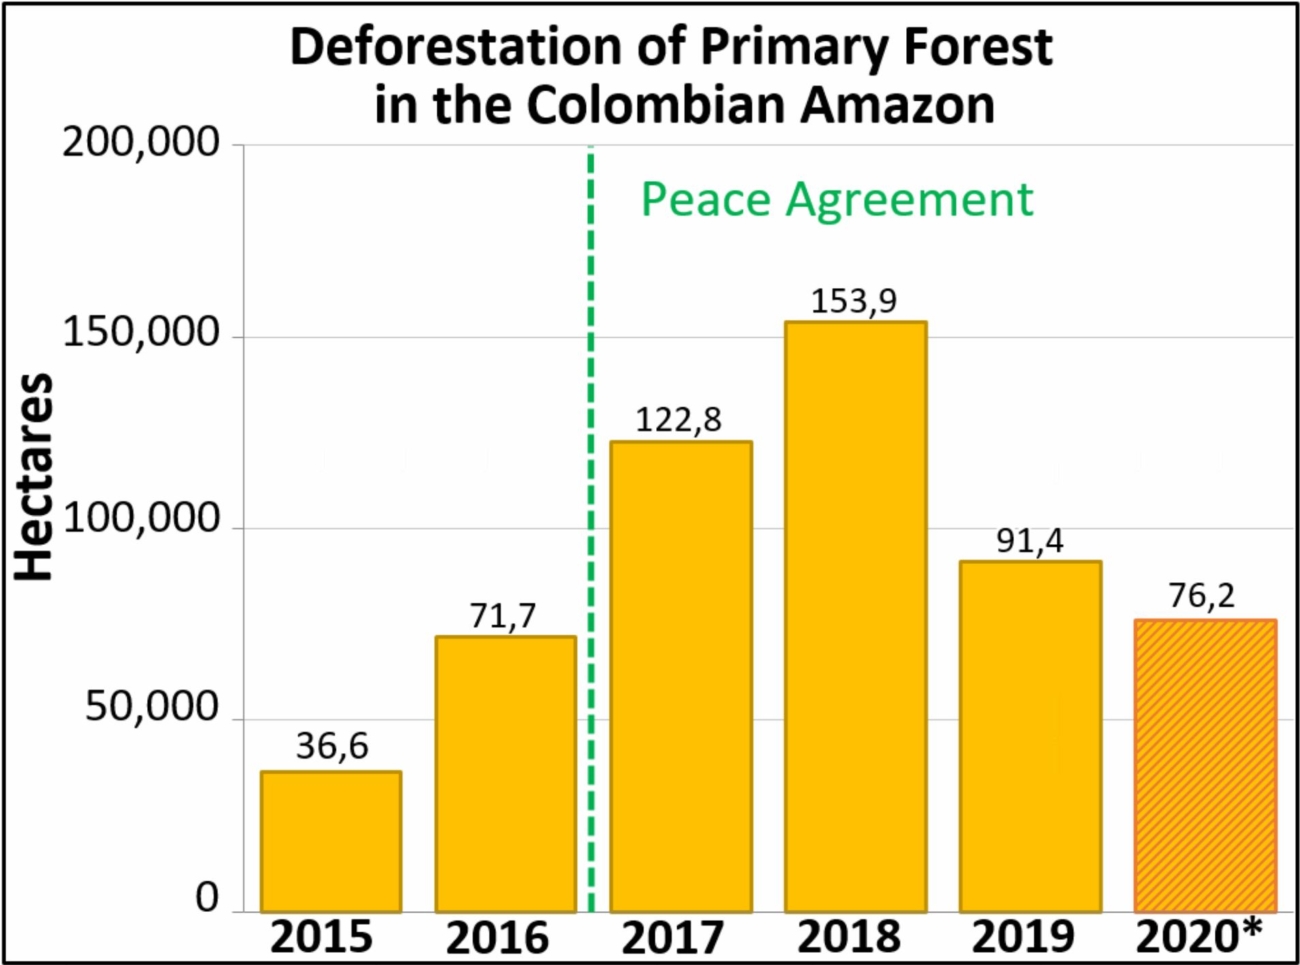
- The Colombian Amazon experienced a deforestation boom starting in 2016 (coinciding with the FARC peace accords), reaching an historical high of 153,800 hectares (380,000 acres) in 2018. However, the deforestation estimate for 2019 is back to pre-boom levels at 53,800 hectares (133,000 acres).
.
- Deforestation in the Peruvian Amazon declined in 2018 (compared to 2017) to 140,000 hectares (346,325 acres), but remained relatively high compared to historical data. The official deforestation data from the Peruvian government for 2018 is slightly higher at 154,700 hectares (382,272 acres), but also represents an important reduction compared to 2017. The deforestation estimate for 2019 indicates the continued downward trend to 134,600 hectares (332,670 acres).
.
- Deforestation in the Brazilian Amazon is on another level compared to the other four countries. The 2019 deforestation estimate of 985,000 hectares (2.4 million acres) is consistent with the official data of the Brazilian government. The trend, however, is quite different; we show a decrease in deforestation compared to the previous three years, but the official data indicates an increase. To better understand the differences between data sources (including spatial resolution, inclusion of burned areas, and timeframe), consult this blog by Global Forest Watch.
Deforestation Hotspots 2019
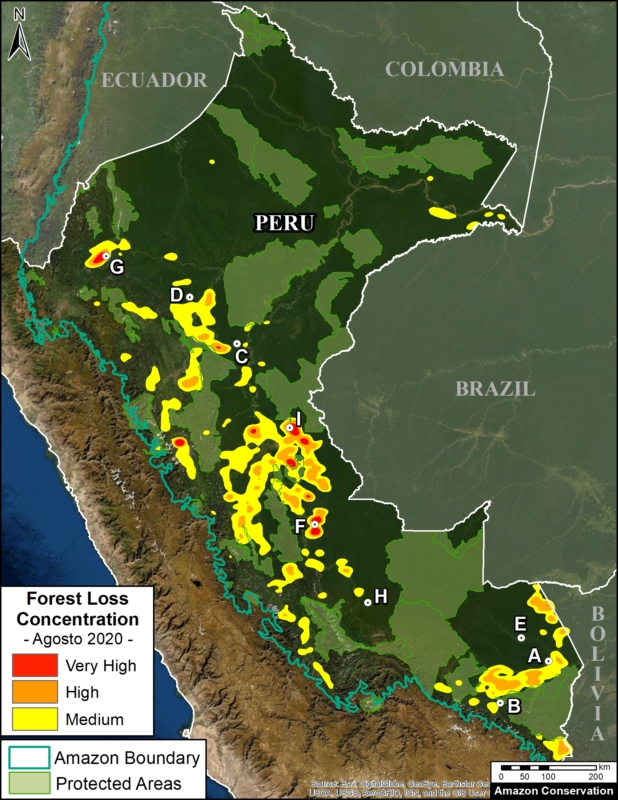
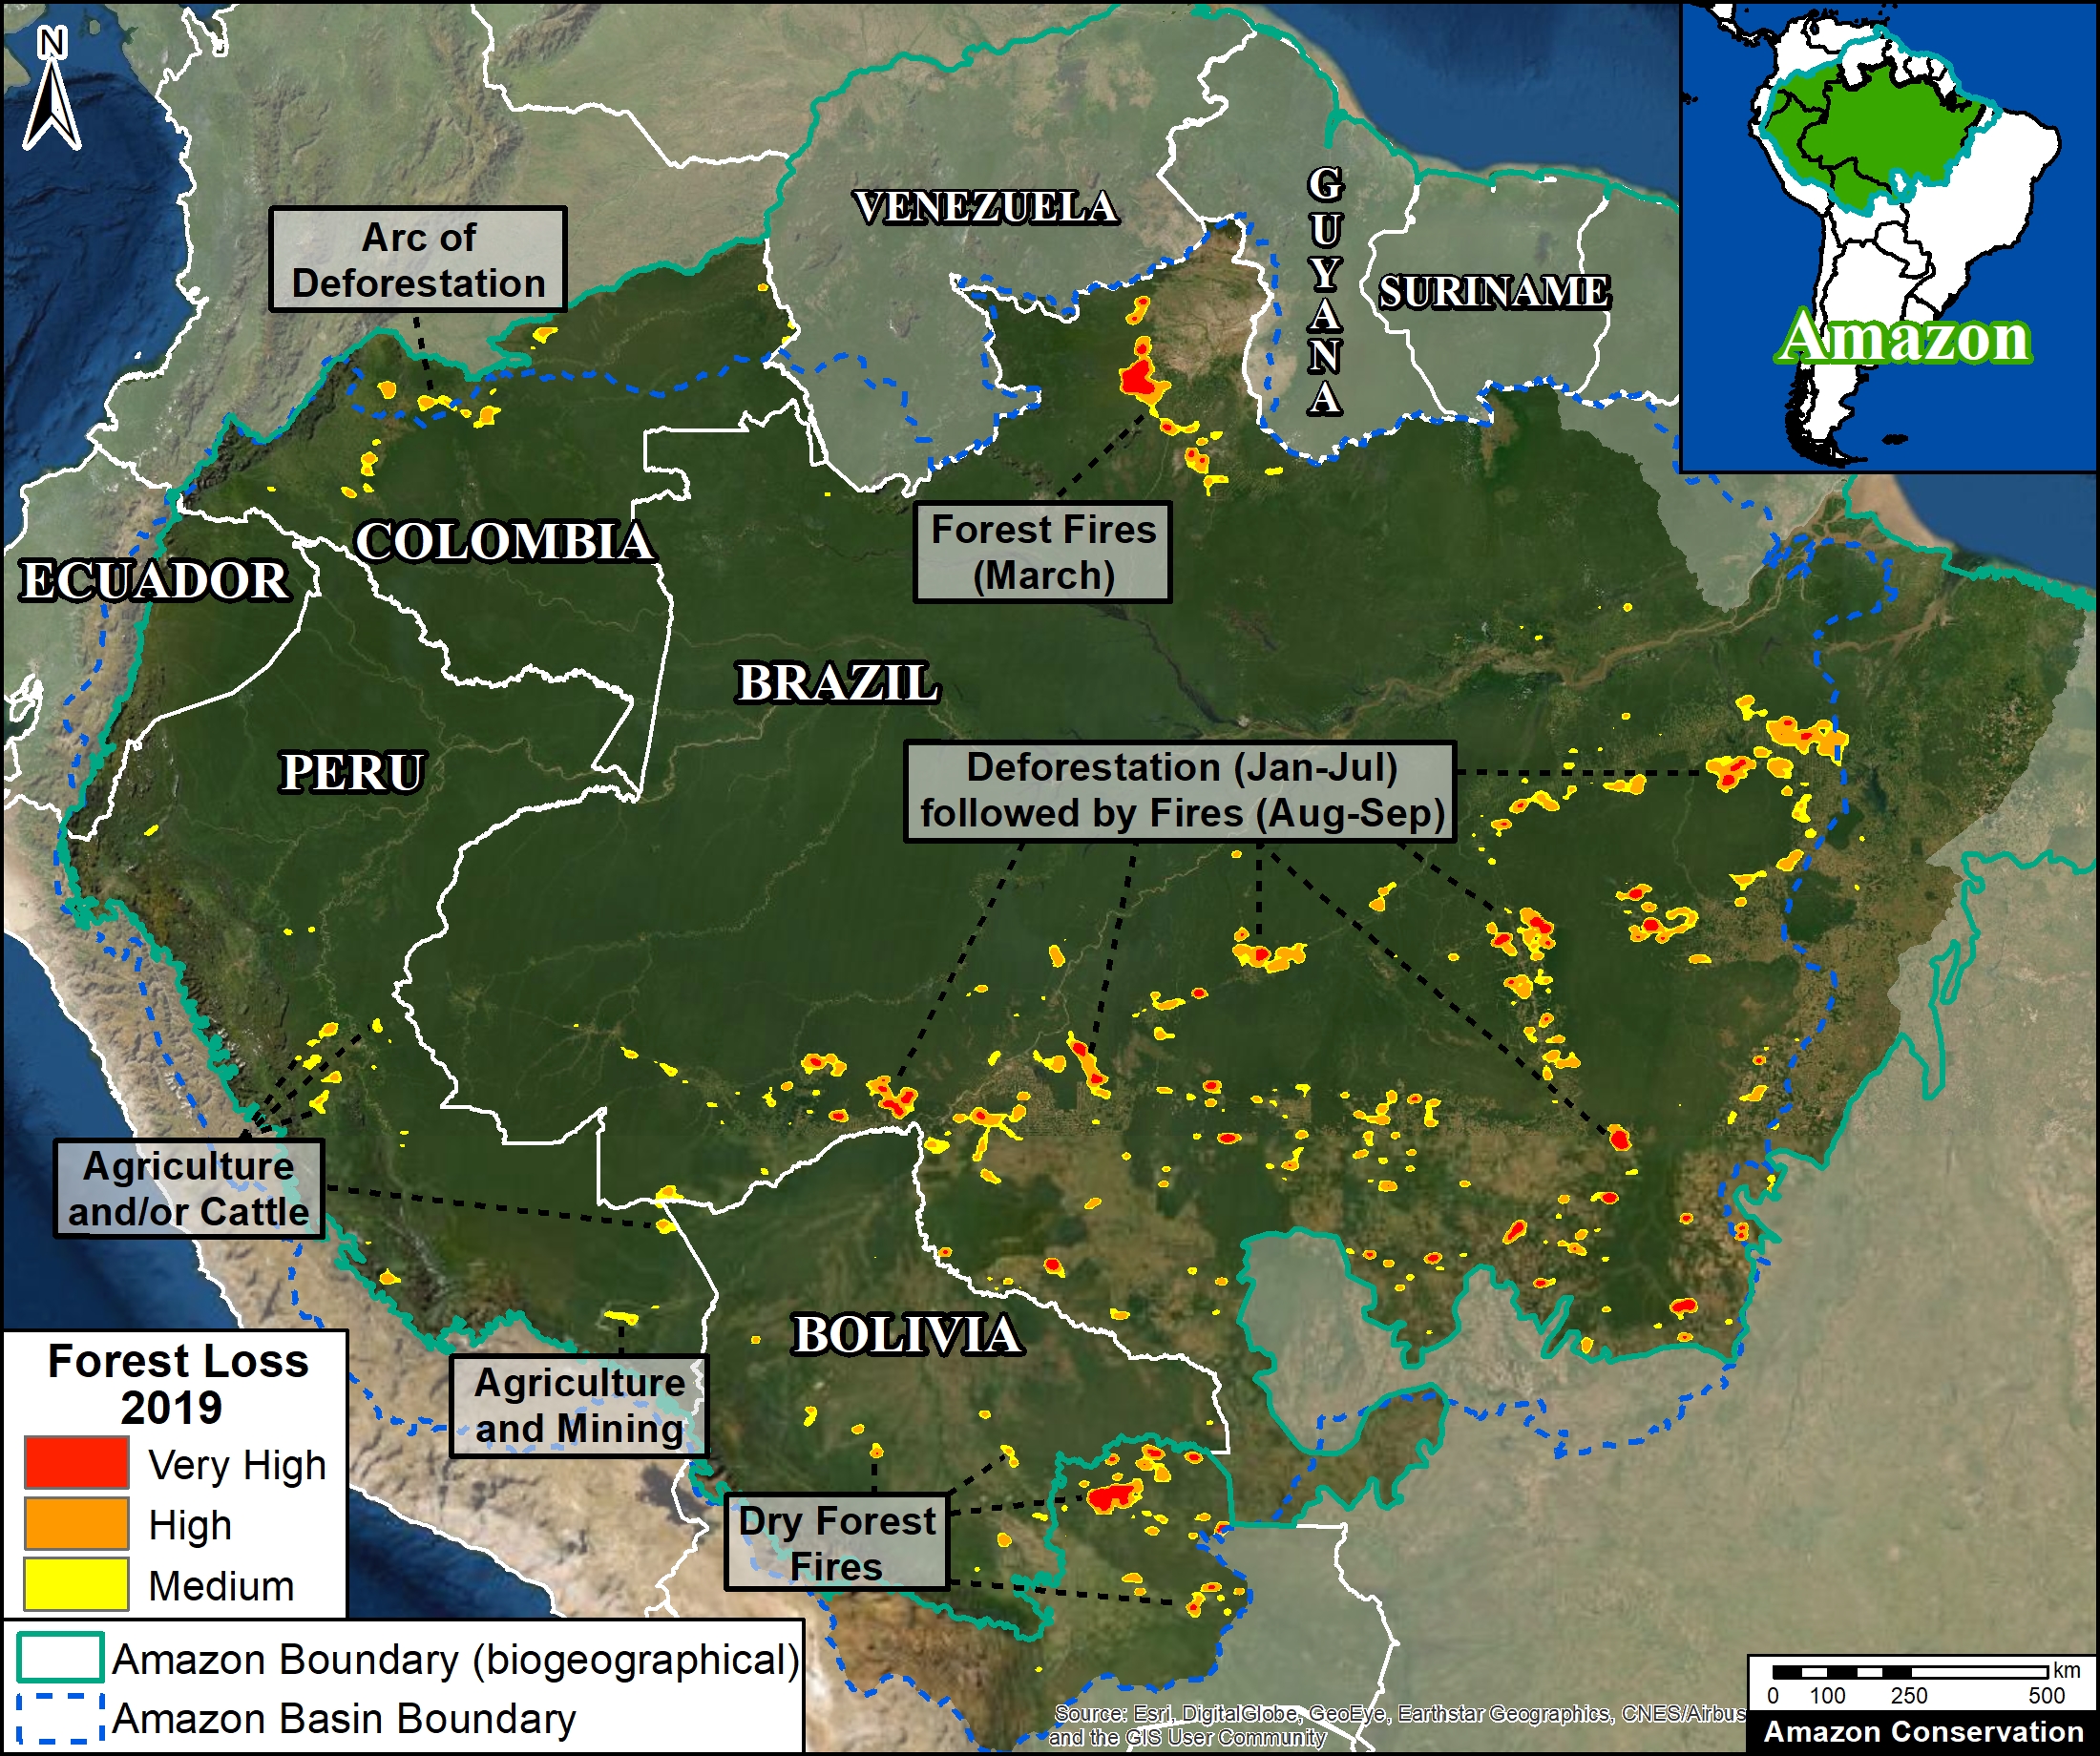
Base Map shows the most intense deforestation hotspots during 2019.

Base Map. Amazon Deforestation, 2001-2019. Data: UMD/GLAD, Hansen/UMD/Google/USGS/NASA, MAAP. Click to see image in high resolution.
Many of the major deforestation hotspots were in Brazil. The letters A indicate areas deforested between March and July, and then burned starting in August, covering over 735,000 acres in the states of Rondônia, Amazonas, Mato Grosso, Acre, and Pará (MAAP #113). They also indicate areas where fire escaped into the surrounding primary forest, impacting an additional 395,000 acres. There is a concentration of these hotspots along the Trans-Amazonian Highway. The letter B indicates uncontrolled forest fires earlier in the year (March) in the state of Roraima (MAAP #109).
Bolivia also had an intense 2019 fire season. Letter C indicates the area where fires in Amazonian savanna ecosystems escaped to the surrounding forests.
In Colombia, the letter D indicates an area of high deforestation surrounding and within four protected areas: Tinigua, Chiribiquete, and Macarena National Parks, and the Nukak National Reserve (MAAP #106).
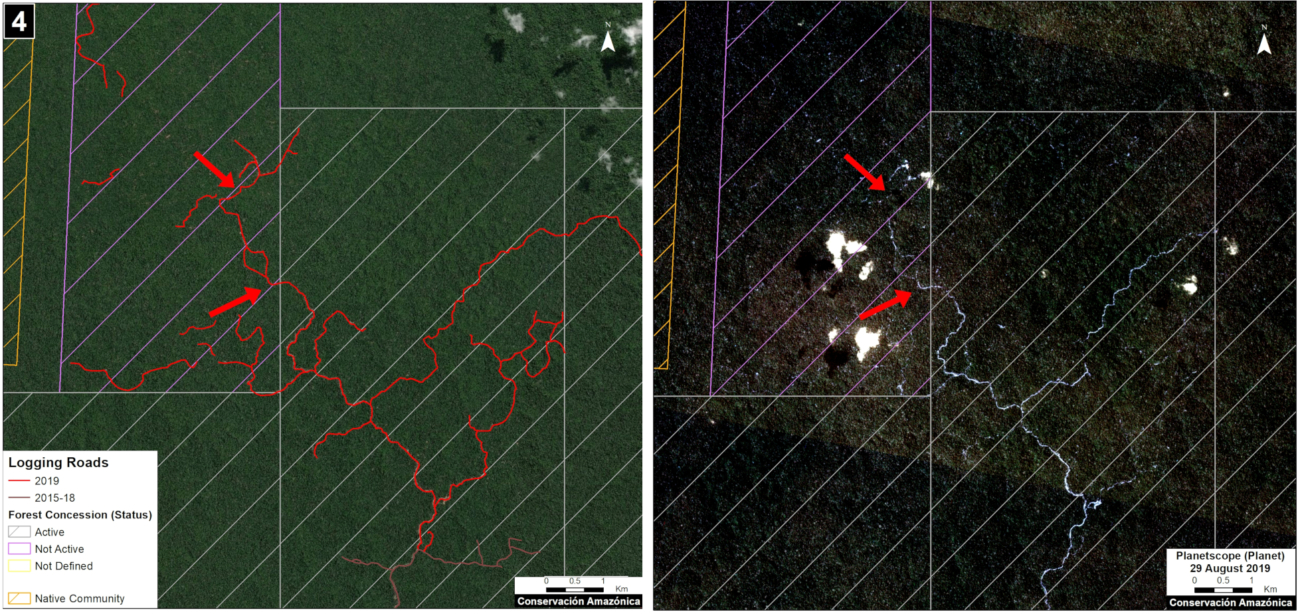
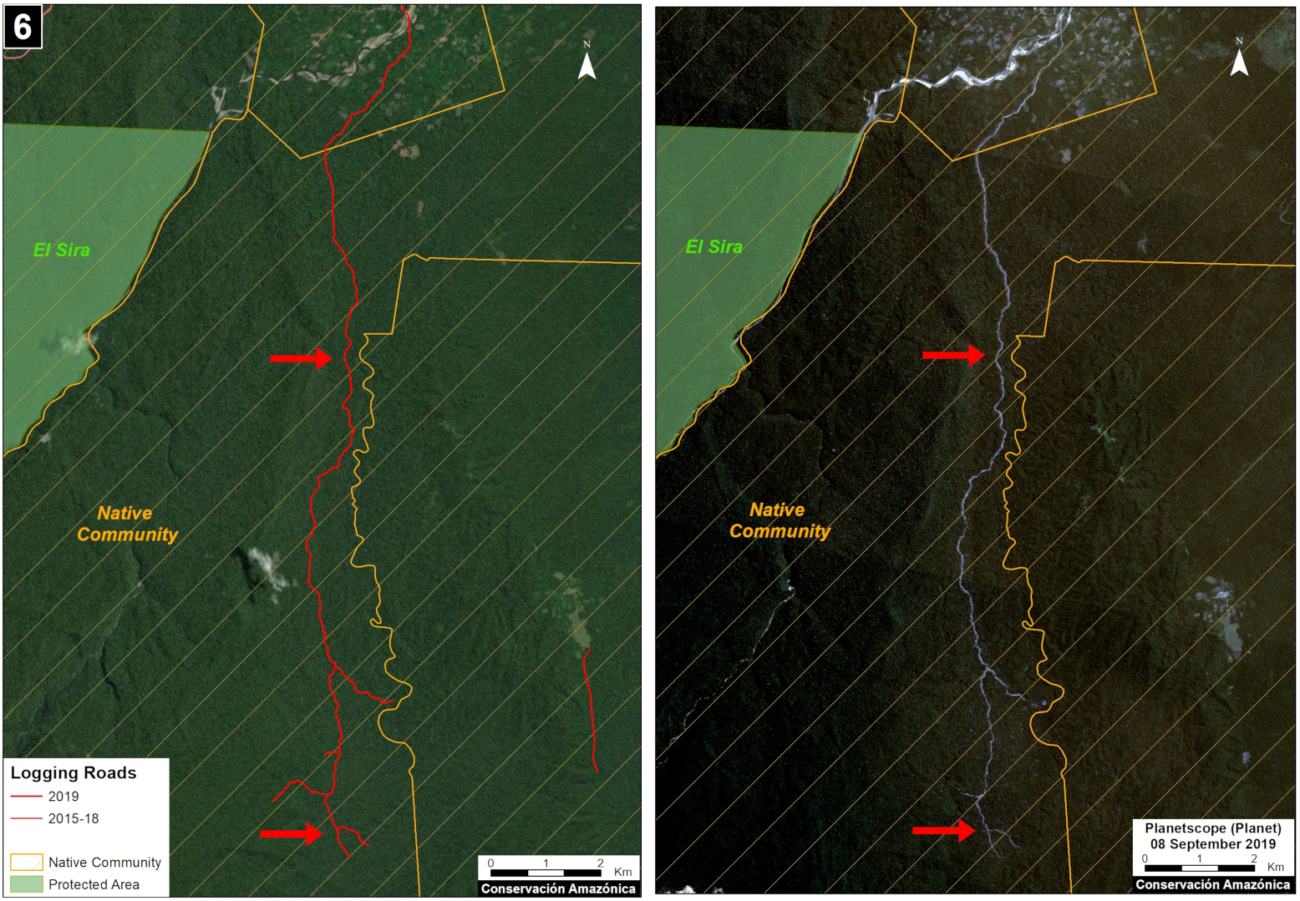
In Peru, there are several key areas to highlight. Letter E indicates a new Mennonite colony that has caused the deforestation of 2,500 acres in 2019, near the town of Tierra Blanca in the Loreto region (MAAP #112). Letter F indicates an area of high concentration of small-scale deforestation in the central Amazon (Ucayali and Huánuco regions), with cattle ranching as one of the main causes (MAAP #37). Letter G indicates an area of high concentration of deforestation along the Ene River (Junín and Ayacucho regions). In the south (Madre de Dios region), letter H indicates expanding agricultural activity around the town of Iberia (MAAP #98) and letter I indicates deforestation caused by a combination of gold mining and agricultural activity.
Methodology
As noted above, there are three important considerations about the data in our analysis: First, as a baseline, we use annual forest loss from the University of Maryland to have a consistent source across all five countries. Thus, the values may differ from official national data. Second, we applied a filter to only include loss of primary forest in order to better approximate the official methodology and data. Third, the 2019 data represents a preliminary estimate based on early warning alerts.
The baseline forest loss data presented in this report were generated by the Global Land Analysis and Discovery (GLAD) laboratory at the University of Maryland (Hansen et al 2013) and presented by Global Forest Watch. Our study area is strictly what is highlighted in the Base Map.
Specifically, for our estimate of forest cover loss, we multiplied the annual “forest cover loss” data by the density percentage of the “tree cover” from the year 2001 (values >30%).
For our estimate of primary forest loss, we intersected the forest cover loss data with the additional dataset “primary humid tropical forests” as of 2001 (Turubanova et al 2018). For more details on this part of the methodology, see the Technical Blog from Global Forest Watch (Goldman and Weisse 2019).
All data were processed under the geographical coordinate system WGS 1984. To calculate the areas in metric units the UTM (Universal Transversal Mercator) projection was used: Peru and Ecuador 18 South, Colombia 18 North, Western Brazil 19 South and Bolivia 20 South.
Lastly, to identify the deforestation hotspots, we conducted a kernel density estimate. This type of analysis calculates the magnitude per unit area of a particular phenomenon, in this case forest cover loss. We conducted this analysis using the Kernel Density tool from Spatial Analyst Tool Box of ArcGIS. We used the following parameters:
Search Radius: 15000 layer units (meters)
Kernel Density Function: Quartic kernel function
Cell Size in the map: 200 x 200 meters (4 hectares, 9.88 acres)
Everything else was left to the default setting.
For the Base Map, we used the following concentration percentages: Medium: 10%-20%; High: 21%-35%; Very High: >35%.
References
Goldman L, Weisse M (2019) Explicación de la Actualización de Datos de 2018 de Global Forest Watch. https://blog.globalforestwatch.org/data-and-research/blog-tecnico-explicacion-de-la-actualizacion-de-datos-de-2018-de-global-forest-watch
Hansen, M. C., P. V. Potapov, R. Moore, M. Hancher, S. A. Turubanova, A. Tyukavina, D. Thau, S. V. Stehman, S. J. Goetz, T. R. Loveland, A. Kommareddy, A. Egorov, L. Chini, C. O. Justice, and J. R. G. Townshend. 2013. “High-Resolution Global Maps of 21st-Century Forest Cover Change.” Science 342 (15 November): 850–53. Data available on-line from: http://earthenginepartners.appspot.com/science-2013-global-forest.
Planet Team (2017). Planet Application Program Interface: In Space for Life on Earth. San Francisco, CA. https://api.planet.com
Turubanova S., Potapov P., Tyukavina, A., and Hansen M. (2018) Ongoing primary forest loss in Brazil, Democratic Republic of the Congo, and Indonesia. Environmental Research Letters https://doi.org/10.1088/1748-9326/aacd1c
Acknowledgements
Agradecemos a S. Novoa (ACCA), R. Botero (FCDS), A. Condor (ACCA) y G. Palacios por sus útiles comentarios a este reporte.
Acknowledgements
We thank S. Novoa (ACCA), R. Botero (FCDS), A. Condor (ACCA), A. Folhadella (Amazon Conservation), M. Cohen, and G. Palacios for helpful comments to earlier versions of this report.
This work was supported by the following major funders: NASA/USAID (SERVIR), Norwegian Agency for Development Cooperation (NORAD), Gordon and Betty Moore Foundation, International Conservation Fund of Canada (ICFC), Metabolic Studio, Erol Foundation, MacArthur Foundation, and Global Forest Watch Small Grants Fund (WRI).
Citation
Finer M, Mamani N (2020) MAAP Synthesis: 2019 Amazon Deforestation Trends and Hotspots. MAAP Synthesis #4.

 We thank A. Felix (USAID Prevent), M.E. Gutierrez (ACCA), and G. Palacios for their helpful comments on this report.

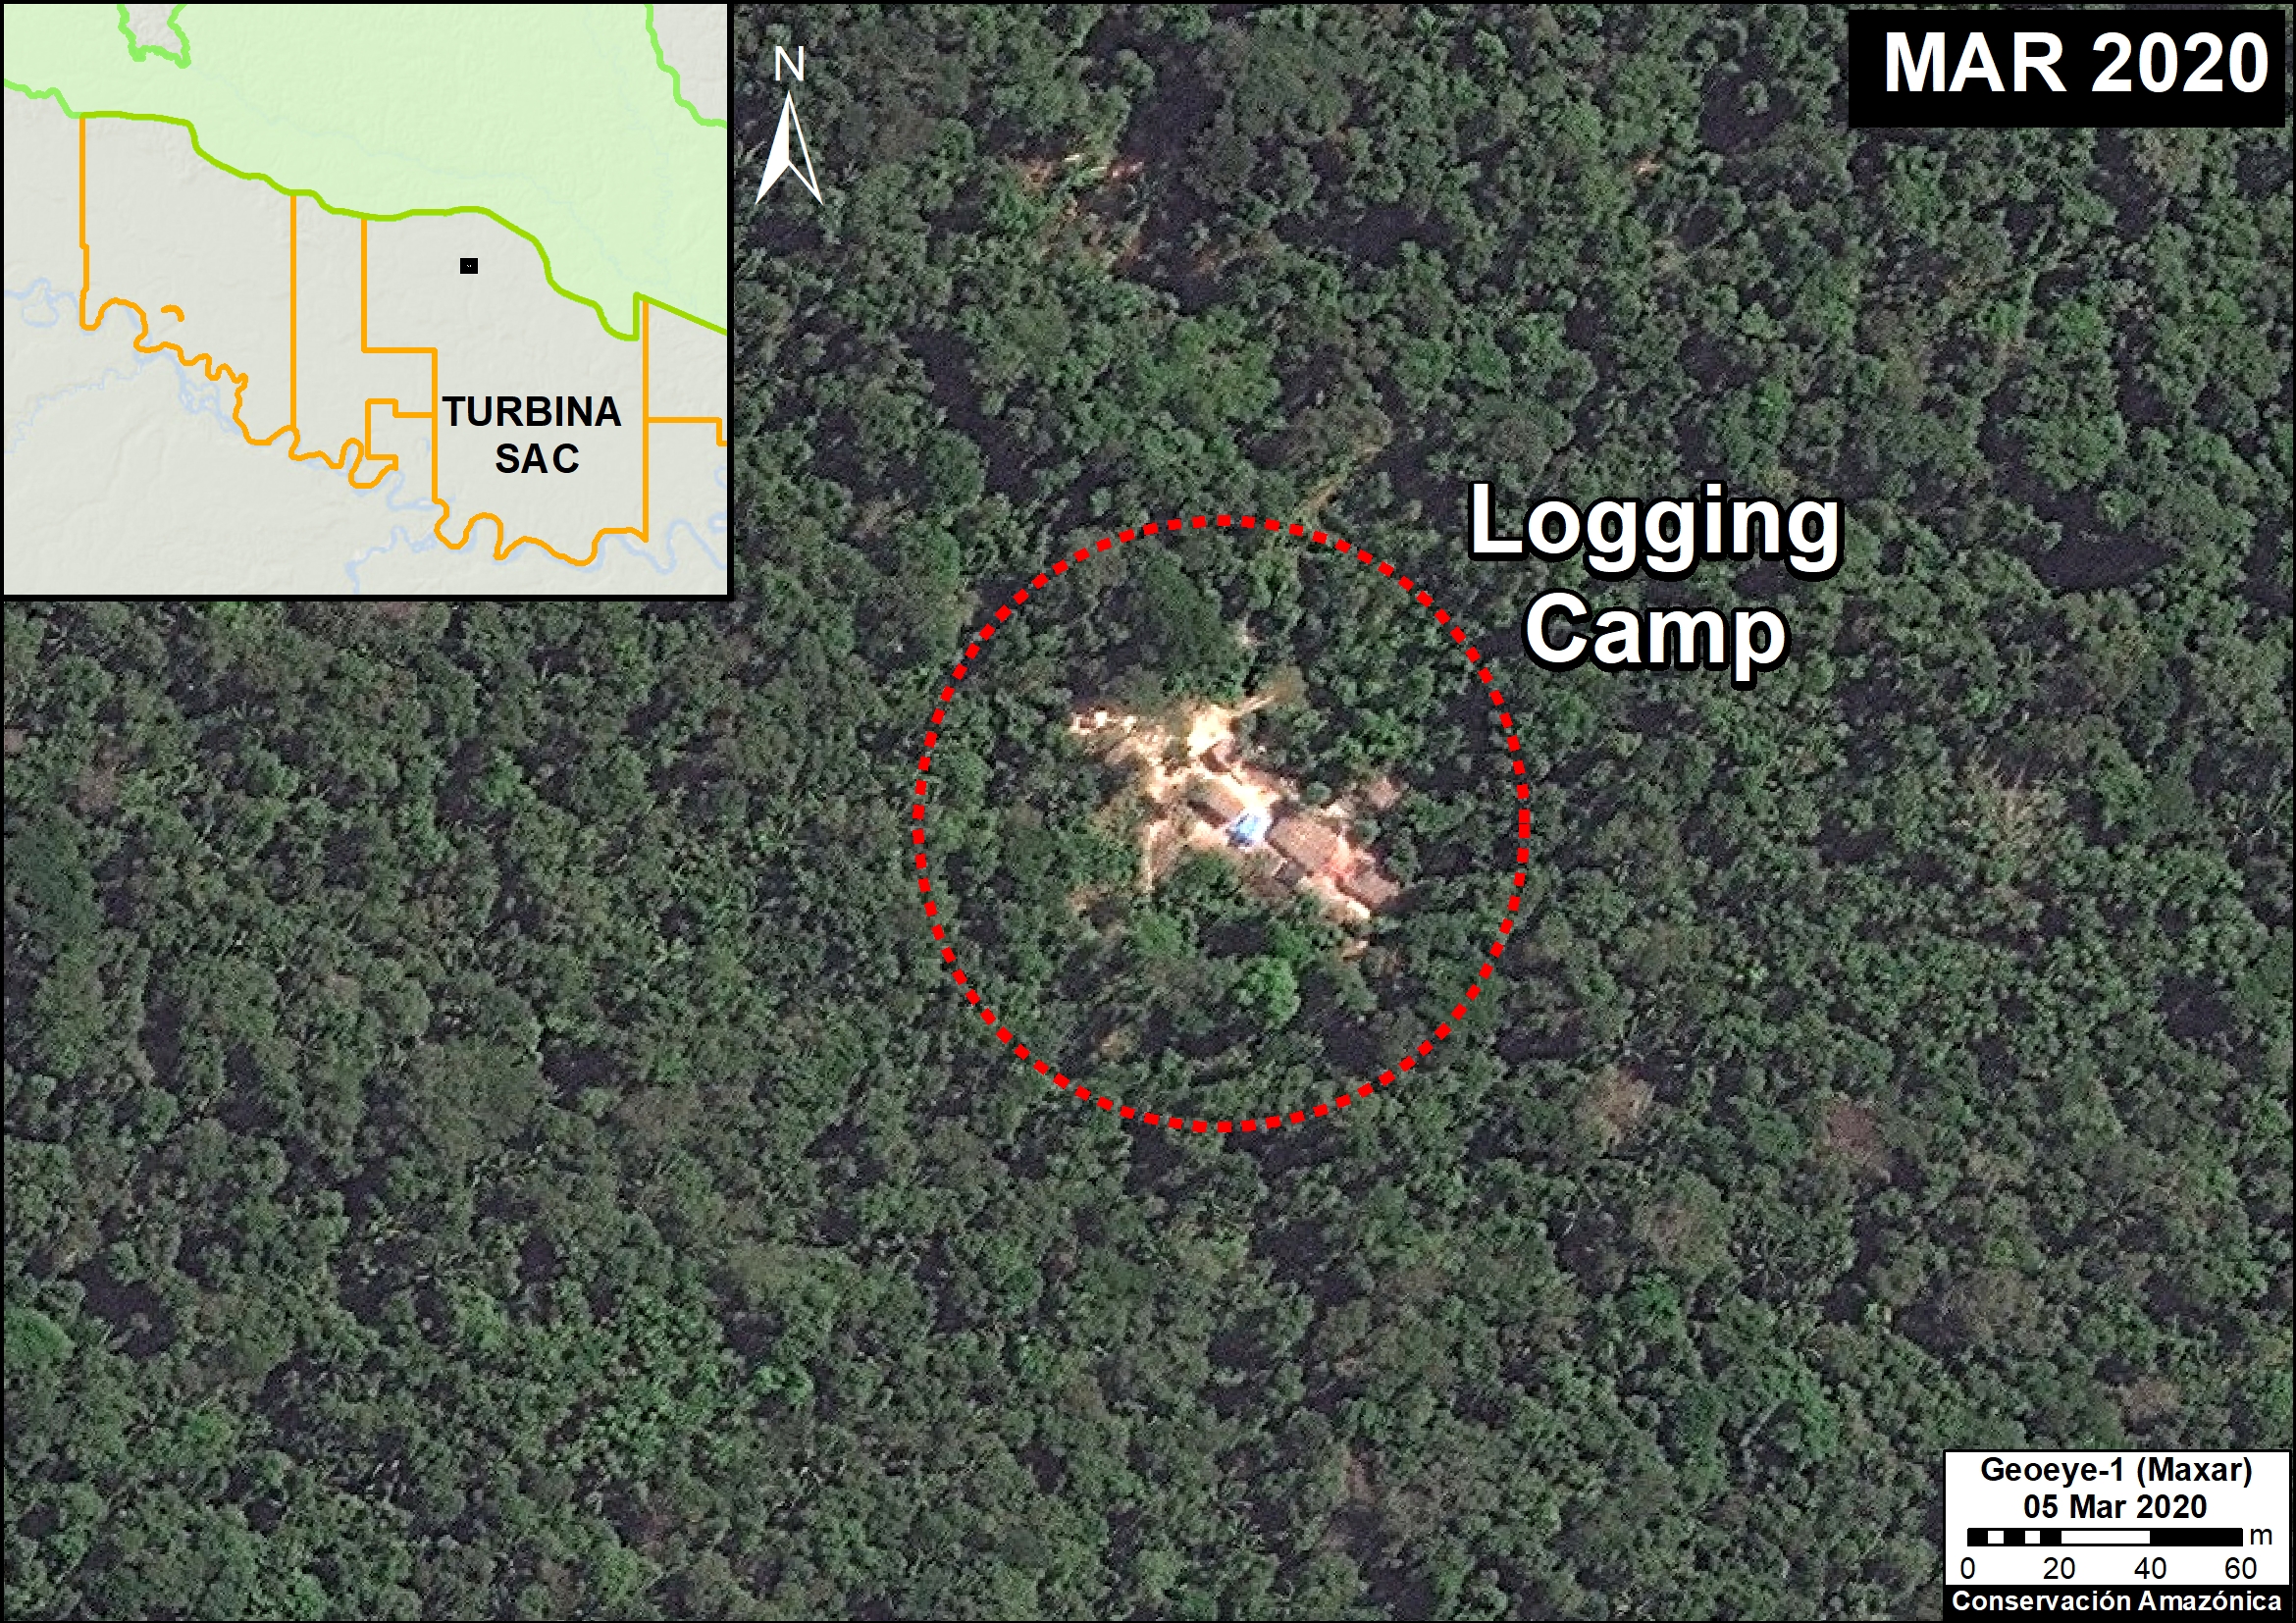
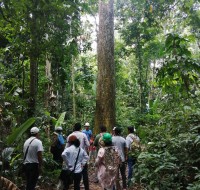 Amazon Conservation’s sister organization Conservación Amazónica – ACCA, with support from Google.org, just finished up a two-year initiative that trained community members to use cutting-edge satellite and field technologies to combat deforestation in the southern Peruvian Amazon, now protecting over 150,000 acres of lowland forests.
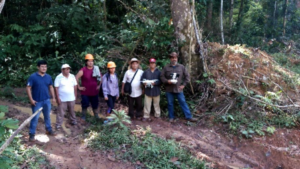 Before this program, concessionaires and their communities lacked capacity to monitor these large, remote areas and a way to rapidly and safely report deforestation in their territories. Our innovative methodology of combining real-time satellite imagery analysis and drone field technology (which includes smartapps and other technologies developed by Google) with legal training, gave concessionaires the ability to detect and report deforestation as it happened in their territory. This is a stark contrast from before, when the only way to monitor thousands of acres of forests was through foot patrols that took days to complete.
  Through this program, over 153,000 acres (62,000 hectares) of forests are now monitored and protected with technology by the local people we empowered. Moreover, technological kits were donated to each individual or local association, each containing a drone, a maintenance kit, a laptop and a printer, giving them the knowledge and tools needed to safeguard forests..
 The project, led by our director of our Southwest Amazon Drone Center, Carlos Castañeda, will continue to provide technical support to maintain the donated drones and training to reinforce what they learned, as well as be available to answer any questions that may arise during monitoring and surveillance of their concessions. Thus, the continuity of the project and its sustainability are ensured.
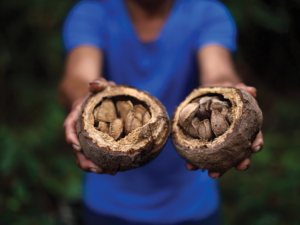 For the past year our team in Bolivia and Peru have been working with EUROCLIMA+, an initiative of the European Commission focused on combating climate change in Latin America. We are working with local communities to pilot climate change resilience in their sustainable use of forest resources.
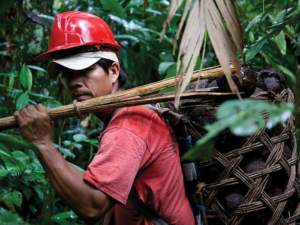 n Bolivia, coordinates this project. His team works in the northern part of Bolivia, where local communities heavily depend on these forest goods to make a living. “Almost all the families dedicate themselves to harvesting forest fruits, mainly the Brazil nut, which is their main economic activity.”
 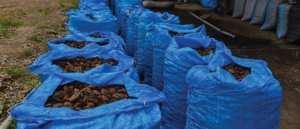 Tying the importance of conservation of these forests not only to climate change but also to economic sustainability of local and global economies is vital for countries and communities to see the value of forests. In fact, our area of work in Bolivia holds 85% of the Brazil nut production in the world, and keeping those forests standing through sustainable activities will have a significant impact in the fight against deforestation and carbon emissions.
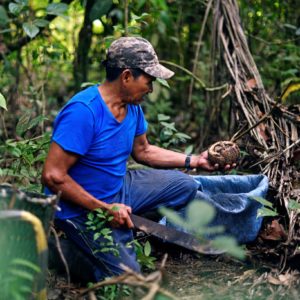 A key aspect of our work with EUROCLIMA+ is recognizing how these sustainable forest economies help mitigate the effects of climate change on communities and on the planet, which hadn’t previously been as much on peoples’ minds. This pilot work is also helping local communities become aware of how climate is changing the forests on which they depend, so they can plan for their long-term, sustainable use, without needing to turn to destructive practices like timber extraction and cattle ranching if a harvesting season is affected by global warming. This involves not only making sure we have healthy forests, but also helping communities diversify their source of income sustainably, such as harvesting other complementary forest products like açaí berries and sustainably farming paiche fish.
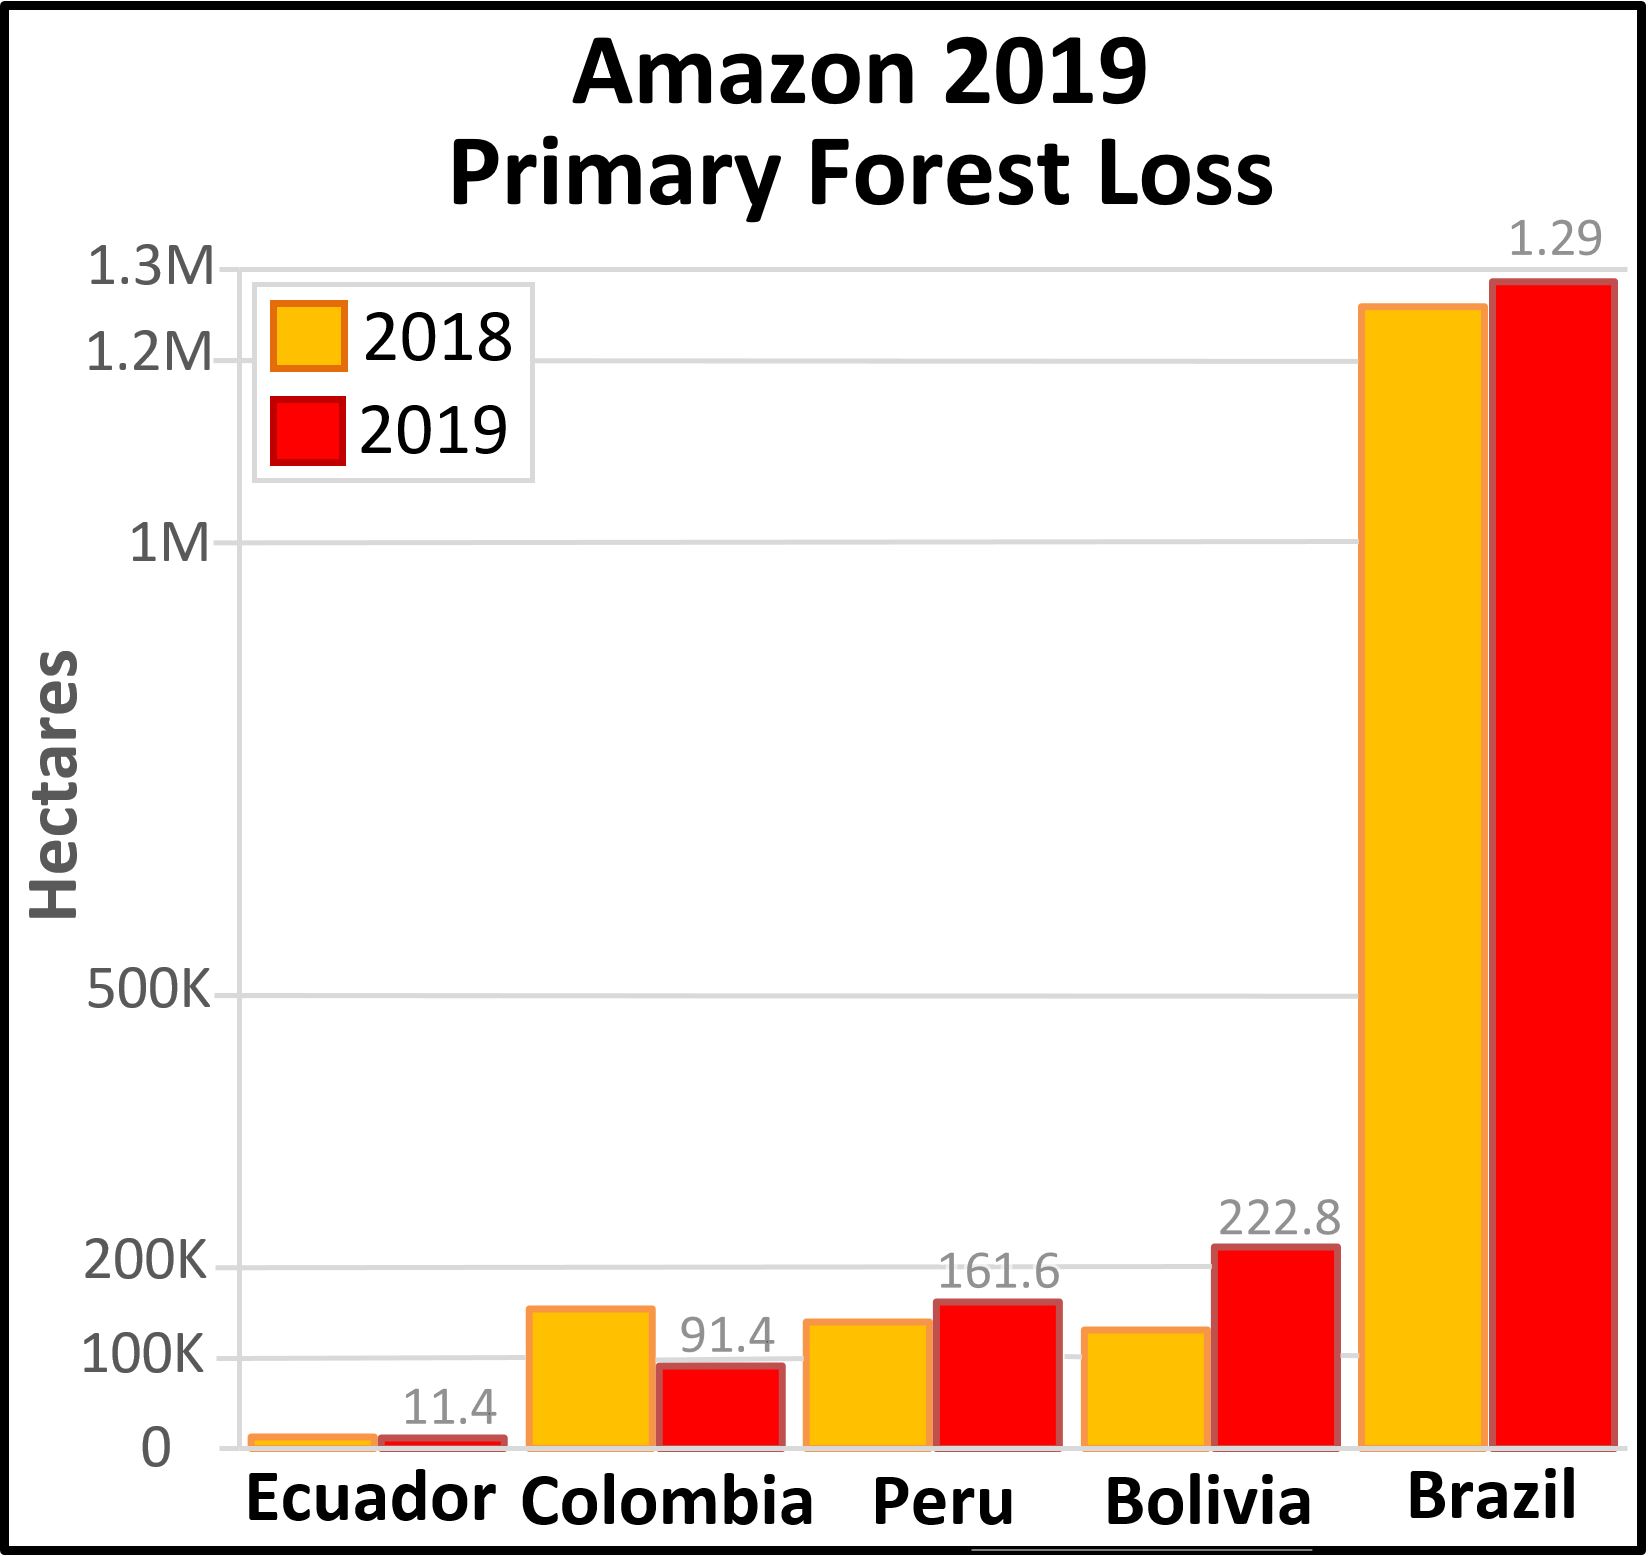


 Loading...