MAAP #94: Detecting Logging in The Peruvian Amazon With High Resolution Imagery

In MAAP # 85, we showed how medium and high-resolution satellites (such as Landsat, Planet and Sentinel-1) could be used to monitor the construction of logging roads in near-real time.

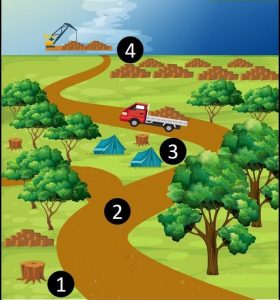
Base Map. Logging Activities. Source: ACCA/ACA.

Here, we show the potential of very high-resolution satellites (such as DigitalGlobe and Planet’s Skysat), to identify the activities associated with logging, including illegal logging.

These activities include (see Base Map):
1. Selective logging of high-value trees,
2. Construction of logging roads (access roads),
3. Logging camps
4. Storage and transport

Next, we show a series of very high-resolution images (>50 centimeters), which allow clear identification of these activities.

Note that we show images of both possible legal logging in authorized areas (Images 1,2,5,6,7,9,10) and confirmed illegal logging in unauthorized areas (Images 3,4,8,11,12).*

MAAP #93: Shrinking Primary Forests of The Peruvian Amazon

The primary forests of the Peruvian Amazon, the second largest stretch of the Amazon after Brazil, are steadily shrinking due to deforestation.

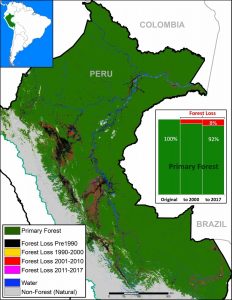
Base Map. Data: SERNANP, IBC, Hansen/UMD/Google/USGS/NASA, PNCB/MINAM, GLCF/UMD, ANA.

Here, we analyze both historic and current data to identify the patterns.

The good news: As the Base Map shows, the Peruvian Amazon is still home to extensive primary forest.* We estimate the current extent of Peruvian Amazon primary forest to be 67 million hectares (165 million acres), greater than the total area of France.

Importantly, we found that 48% of the current primary forests (32.2 million hectares) are located in officially recognized protected areas and indigenous territories (see Annex).**

The bad news: The Peruvian Amazon primary forests are steadily shrinking.

We estimate the original extent of primary forests to be 73.1 million hectares (180.6 million acres). Thus, there has been a historic loss of 6.1 million hectares (15 million acres), or 8% of the original. A third of the historic loss (2 million hectares) has occurred since 2001.

Below, we show three zooms (in GIF format) of the expanding deforestation, and shrinking primary forests, in the southern, central, and northern Peruvian Amazon.

MAAP #92: New Deforestation Threats In The Peruvian Amazon (Part 2: Agriculture Expansion)

In this ongoing series, we describe major new projects that may lead to the rapid deforestation of large areas of primary Amazon forest.

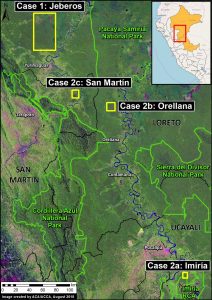
The first report (MAAP #84) described the deforestation associated with the construction of the Yurimaguas – Jeberos road (see Base Map), which crosses extensive primary forest and a priority site for conservation in the Loreto region.

Base Map. Data: SERNANP, MAAP

The current report describes the deforestation associated with major agricultural expansion in three areas in the northern Peruvian Amazon, referred to here as the “Imiria,” “Orellana“, and “San Martin” cases.

These three cases are important because they present characteristics of large-scale, agro-industrial activities (linear plots organized around an extensive new access road network).

In all three cases, early warning alerts (GLAD/Global Forest Watch) initially detected the deforestation in 2017 (see MAAP #69) and their subsequent expansion in 2018. The total deforestation documented to date in these three cases is 3,600 acres.

Below, we show satellite images of the most recent deforestation due to agricultural expansion in these three areas. In these images, yellow circles indicate 2016-17 deforestation and red circles/arrows indicate the most recent 2018 deforestation.

MAAP #91: Introducing Perusat-1, Peru’s New High-Resolution Satellite

In September 2016, Peru’s first satellite, PeruSAT-1, launched. It is Latin America’s most powerful Earth observation satellite, capturing images at a resolution of 0.70 meters.

PeruSat-1. Credit: Airbus DS

The cutting-edge satellite was constructed by Airbus (France) and is now operated by the Peruvian Space Agency, CONIDA.

The organization Amazon Conservation was granted early access to the imagery to boost efforts related to near real-time deforestation monitoring.

Below, we present a series of PeruSAT images that demonstrate their powerful utility in terms of detecting and understanding deforestation in the Peruvian Amazon.

Maap #90: Using Drones To Monitor Deforestation And Illegal Logging

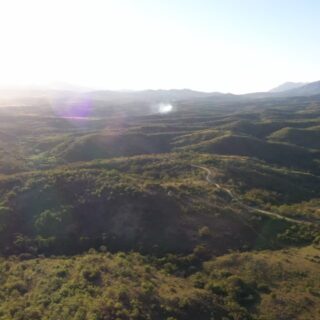
Drone types- helicopter and fixed-wing (plane)

For the past three years, the organization Amazon Conservation has been working to establish a sustainable, local-based drones program for environmental monitoring in the southern Peruvian Amazon (Madre de Dios region).

This program is based on two types of drones, multi-rotor (helicopter style) and fixed-wing (airplane style).

One of the main objectives is to improve the near real-time monitoring of deforestation and illegal logging.

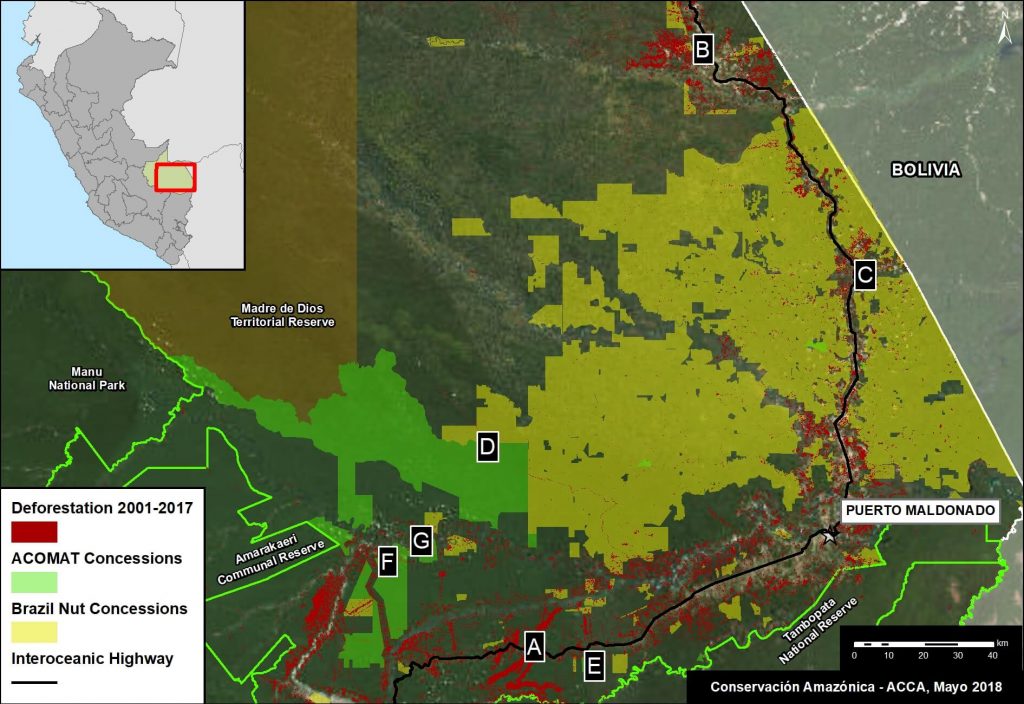
The monitoring is currently focused on three priority areas: 1) Brazil nut concessions, 2) forestry concessions of the local association ACOMAT, and 3) along the Interoceanic Highway (see Base Map).

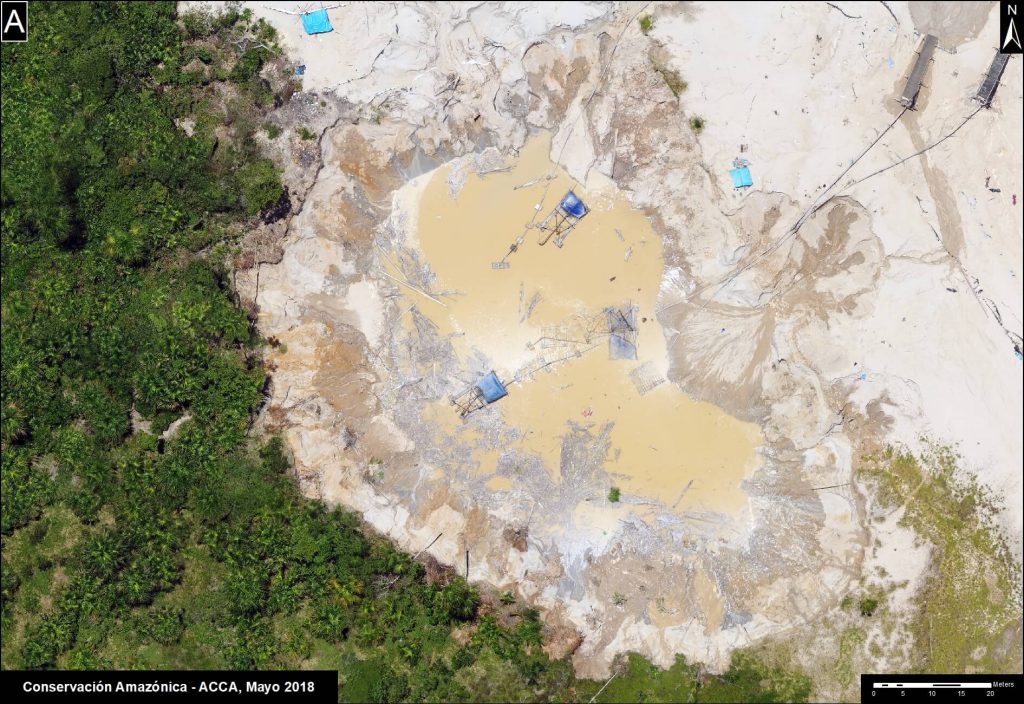
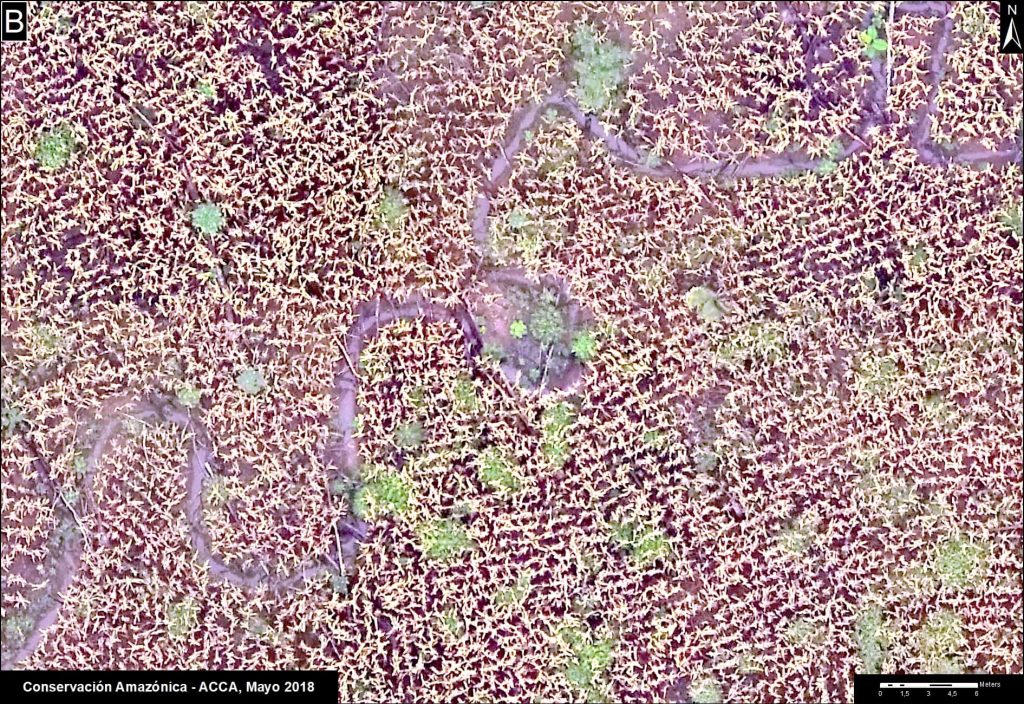
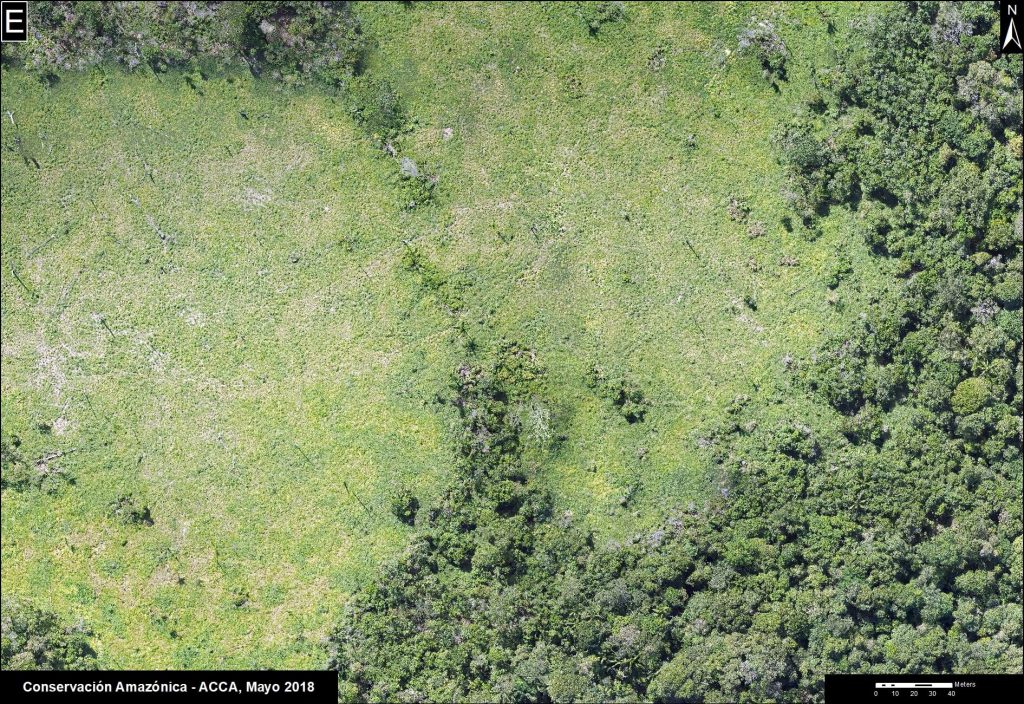
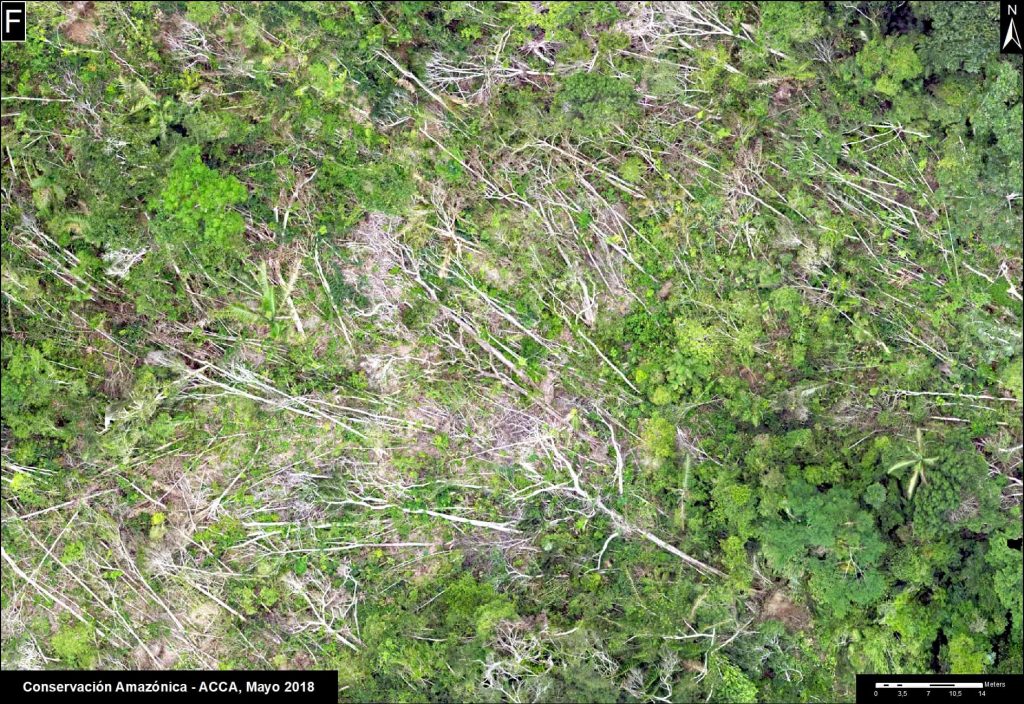
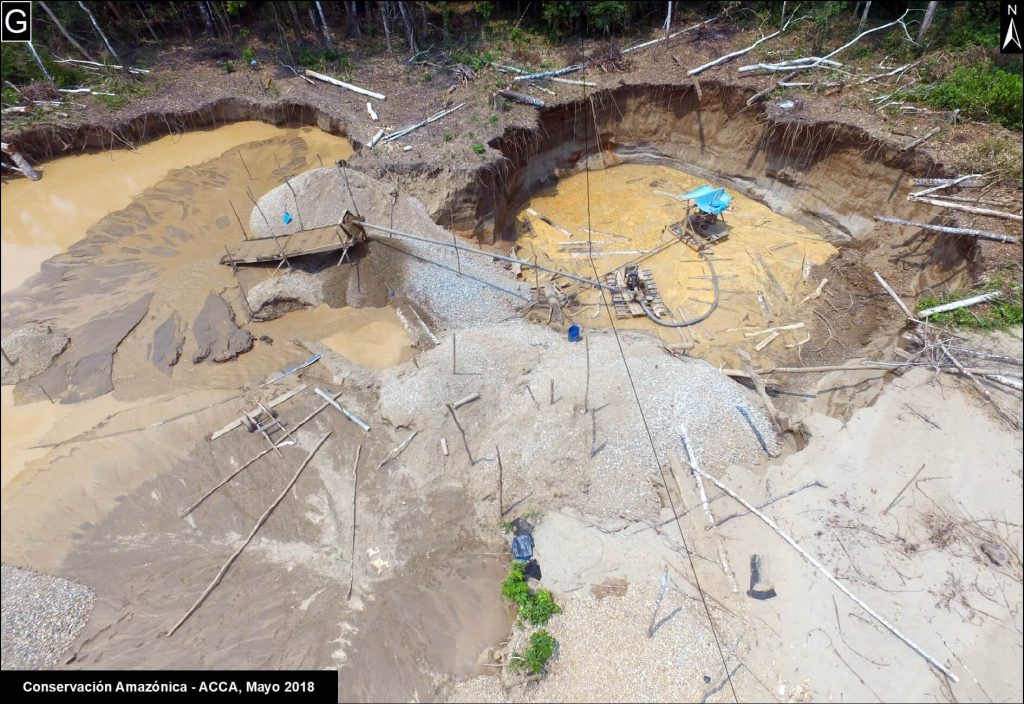
Below, we show a series of drone images that we have used to identify the drivers of recent deforestation events. These drivers include gold mining, agriculture, illegal logging, cattle pasture, and natural forest loss.

Base Map. Priority areas of the Amazon Conservation drones initiative.

Interoceanic Highway

In March 2018, in collaboration with the organization ProPurús, we realized drone flights along the Interoceanic Highway in an effort to demonstrate the possible threats of building a new road along the border with Brazil (see MAAP #76). The following images show the two main threats to the area: gold mining and small/medium-scale agriculture (<50 hectares).

Image A. Drone image- gold mining.
B. Drone image- Deforestation from agriculture (corn)

Brazil Nut Concessions

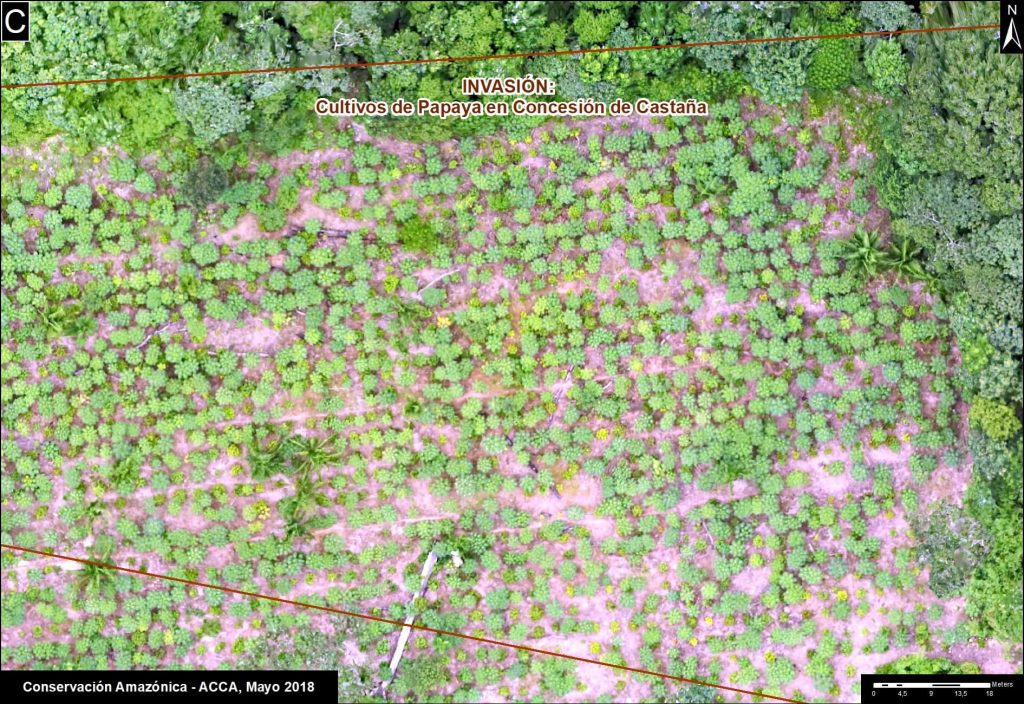
In 2018, Amazon Conservation launched a new project, funded by Google Challenge, to develop a monitoring program for Brazil nut concessions covering a million hectares (2.47 million acres) in southern Peru. For example, the following image shows the invasion of a papaya plantation that caused the recent deforestation of five acres inside a concession.

C. Drone image- Invasion of papaya in Brazil nut concession.

ACOMAT Forestry Concessions

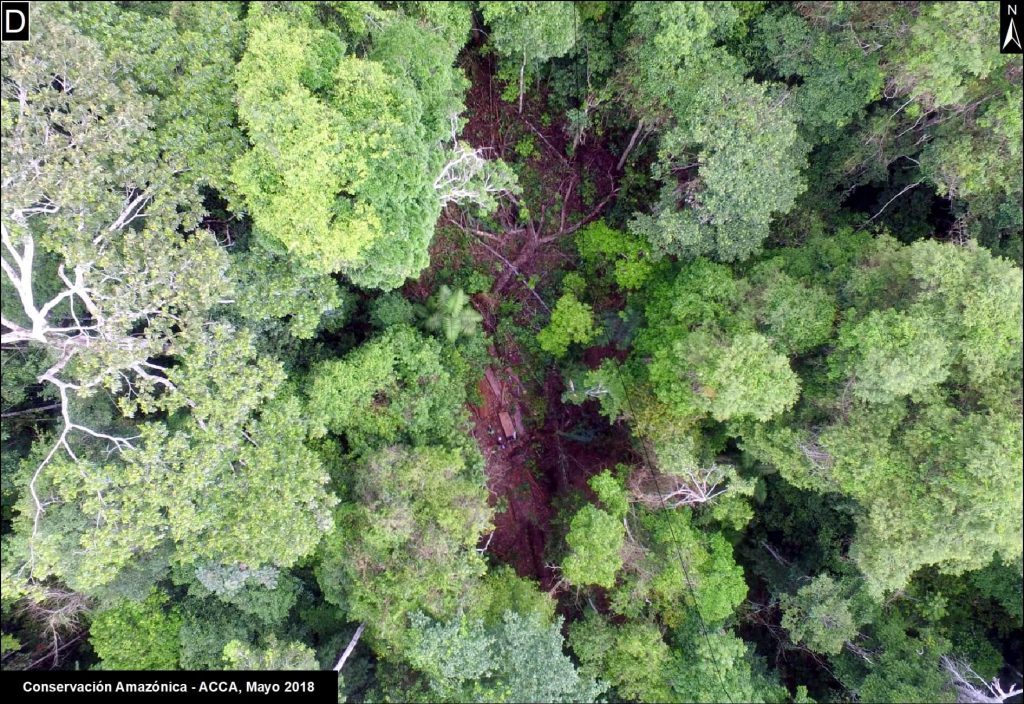
Since 2017, Amazon Conservation has been working on a project, financed by the Norwegian Agency for Development Cooperation (NORAD), to improve the monitoring of forest concessions of the local association ACOMAT (Association of Timber and Non-Timber Forest Concessionaires of the Provinces from Manu and Tambopata). The following images show examples of forest loss and degradation due to illegal logging, cattle grazing, natural loss (windstorm), and gold mining.

D. Drone image- illegal logging.
E. Drone image- cattle pasture.
F. Drone image- natural forest loss from windstorm.
G. Drone image- gold mining.

Citation

Garcia R, Novoa S, Castañeda C, Rengifo P, Jimenez M, Finer M (2018) Using Drones to monitor Deforestation and Illegal Logging. MAAP: 90.

MAAP #87: Gold Mining Deforestation Continues In The Peruvian Amazon

Eastward expansion of La Pampa gold mining. Source: Planet

We have reported extensively on the ongoing gold mining deforestation crisis in the southern Peruvian Amazon (see Archive), estimating the loss of over 17,500 acres in the five years between 2013 and 2017.

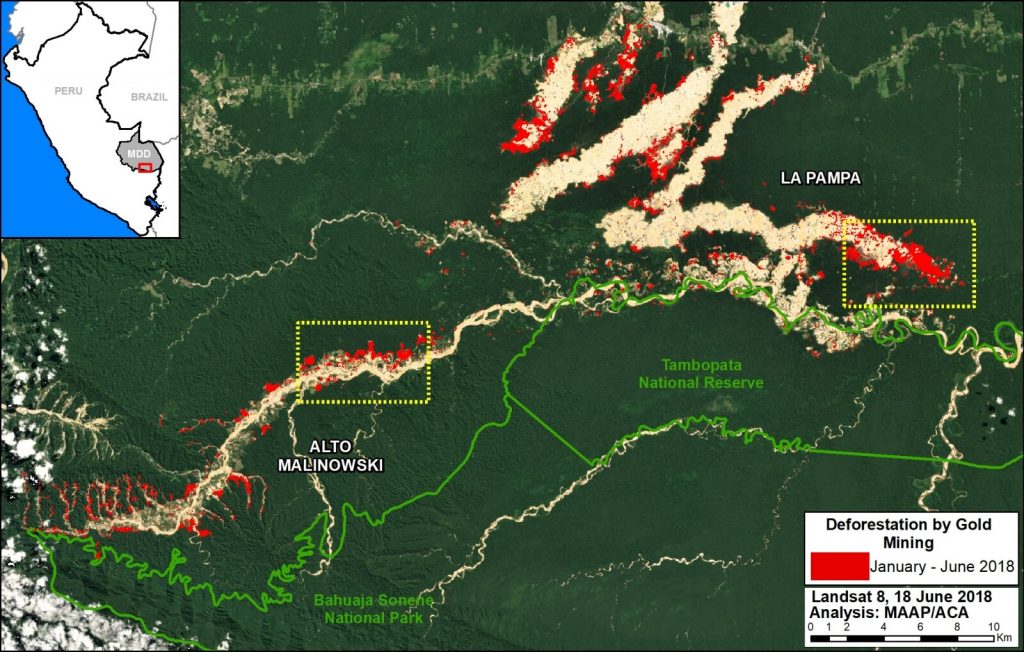
Here, we present new analysis showing that the destruction continues in 2018: we estimate an additional 4,265 acres during the first six months (January – June). This most recent deforestation is concentrated in two critical areas: La Pampa and Alto Malinowski. Most, if not all, of the mining appears to be illegal (see Annex).

This brings the total gold mining deforestation since 2013 to over 21,750 acres.

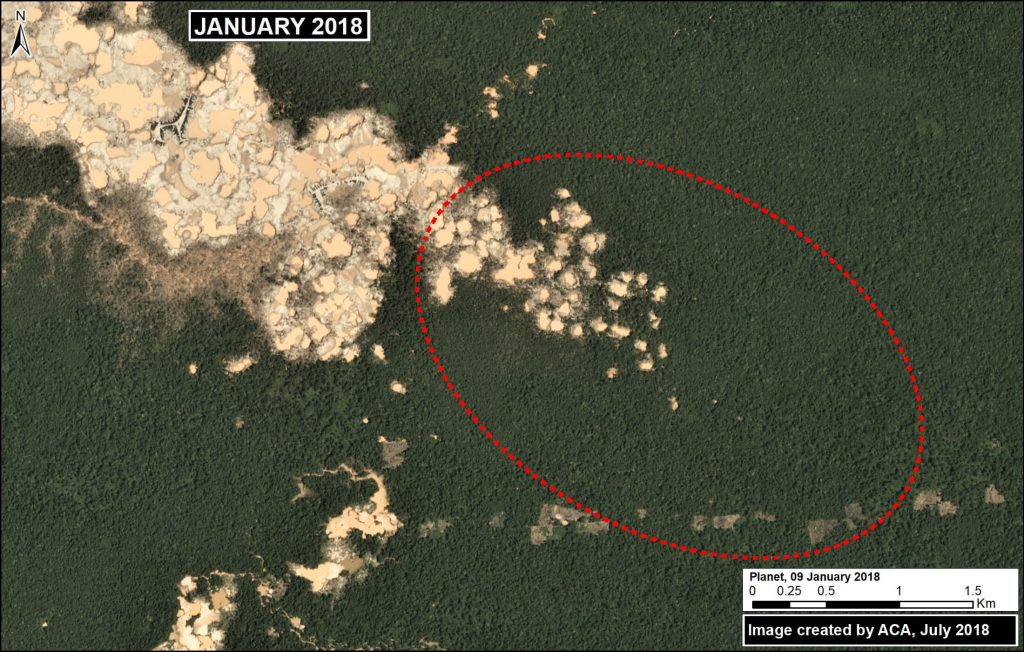
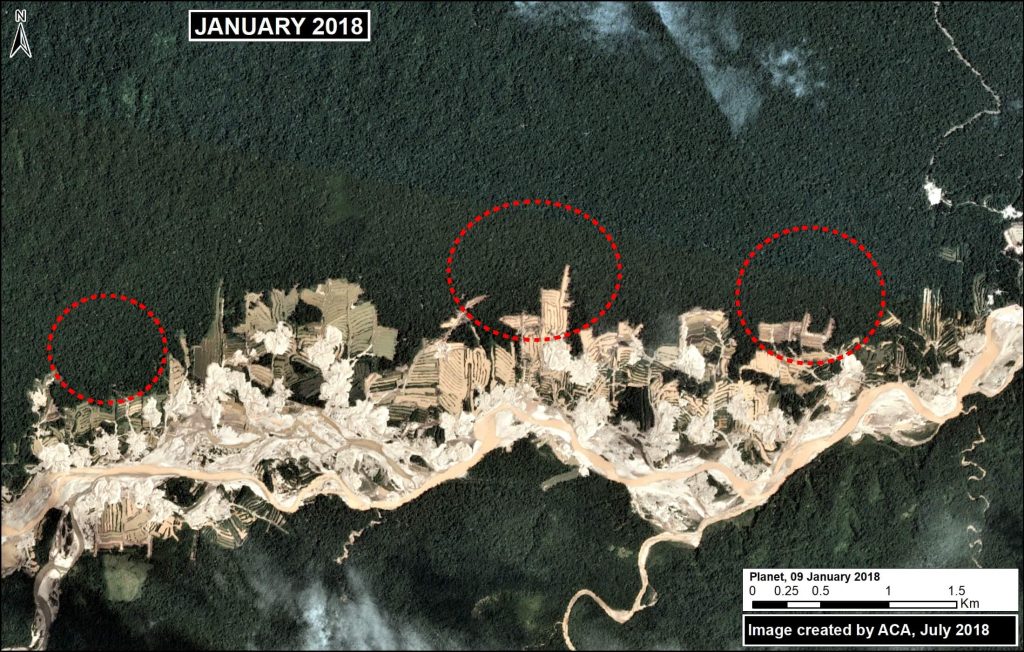
Next, we show a series of satellite images of the recent deforestation in La Pampa and Alto Malinowski.


Base Map

The Base Map highlights the most recent (2018) gold mining deforestation in red. We estimate this deforestation to be around 4,265 acres in the two most critical zones: La Pampa and Alto Malinowski. The yellow boxes indicate the location of the zooms described below. At the end of the article, in the Annex, we present the same base map but with all the overlapping land designations as well to illustrate the complexity of the situation.

Base Map. 2018 gold mining deforestation in southern Peruvian Amazon. Data- Planet, UMD:GLAD, MINAM:PNCB

La Pampa

The following images show the gold mining deforestation in the area known as “La Pampa” between January (left panel) and May (right panel) 2018. Note that the second image is in slider format.

Zoom de La Pampa. Datos- Planet, MAAP_1

Alto Malinowski

The following images show the gold mining deforestation in the area known as “Alto Malinowski” between January (left panel) and May (right panel) 2018. Note that the second image is in slider format.


Annex

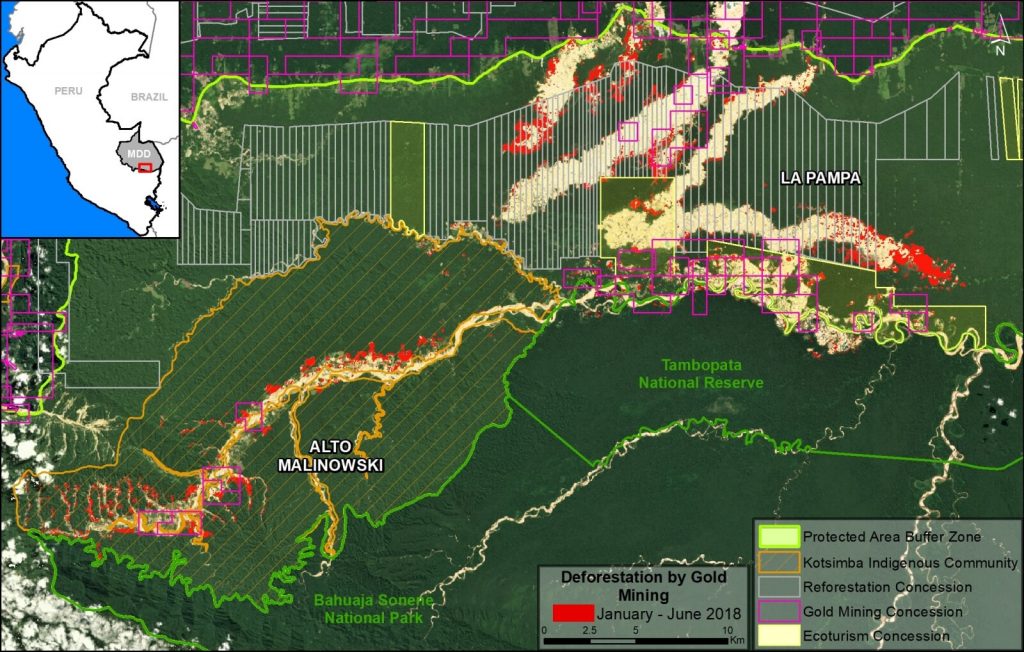
We present the same base map as above, but also with relevant land designations.  Note that much of the deforestation is concentrated in forestry concessions (ironically, in “reforestation” concessions) and in the Kotsimba Native Community, both of which are outside the legal mining corridor and within the buffer zones of Tambopata National Reserve and Bahuaja Sonene National Park. Thus, most, if not all, of the mining activity appears to be illegal.

Citation

Finer M, Villa L, Mamani N (2018) Gold Mining continues to ravage the Peruvian Amazon. MAAP: 87.

MAAP #85: Illegal Logging in The Peruvian Amazon, And How Satellites Can Help Address It

We propose a new tool to address illegal logging in the Peruvian Amazon: using cutting-edge satellites to monitor logging road construction in near real-time.

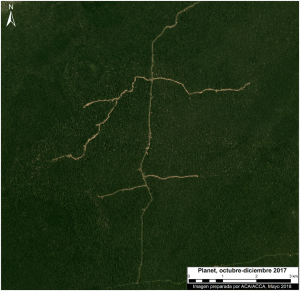
Example of new logging road in the Peruvian Amazon. Data: Planet

Illegal logging in the Amazon is difficult to detect because it is selective logging of individual valuable trees, not large clear-cuts.

However, a new generation of satellites can quickly detect new logging roads, which in turn may indicate the leading edge of illegal logging.

Here, we analyzed satellite imagery to identify all new logging roads built in the Peruvian Amazon over the past three years (2015-17).

We then show how it is possible to track logging road construction in near-real time, using three satellite-based systems: GLAD alerts, Sentinel-1 (radar satellites), and Planet (optical satellites).


MAAP #84: New Threats to The Peruvian Amazon (Part 1: Yurimaguas-Jeberos Road)

The efforts and international commitments of the Peruvian Government to reduce deforestation may be compromised by new projects do not have adequate environmental assessment.

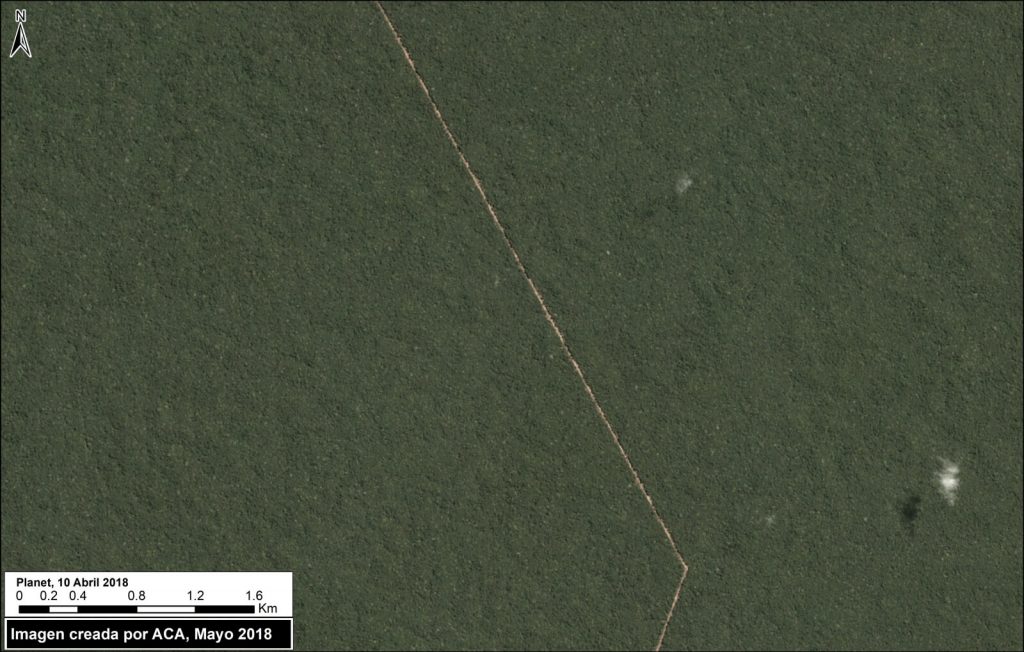
Image A: New Yurimaguas-Jeberos road crossing primary forest. Data: Planet

In this series, we address the most urgent of these projects, those that threaten large areas of primary Amazonian forest.

We believe that these projects require urgent attention from both government and civil society to ensure an adequate response and avoid irreversible damage. For example, in the case below, it is not known whether there is an environmental impact study.

The first report of this series focuses on a new road (Jeberos – Yurimaguas) that threatens a large expanse of primary forest in the northern Peruvian Amazon (see Image A).

MAAP #83: Climate Change Defense: Amazon Protected Areas and Indigenous Lands

Tropical forests, especially the Amazon, sequester huge amounts of carbon, one of the main greenhouse gases driving climate change.

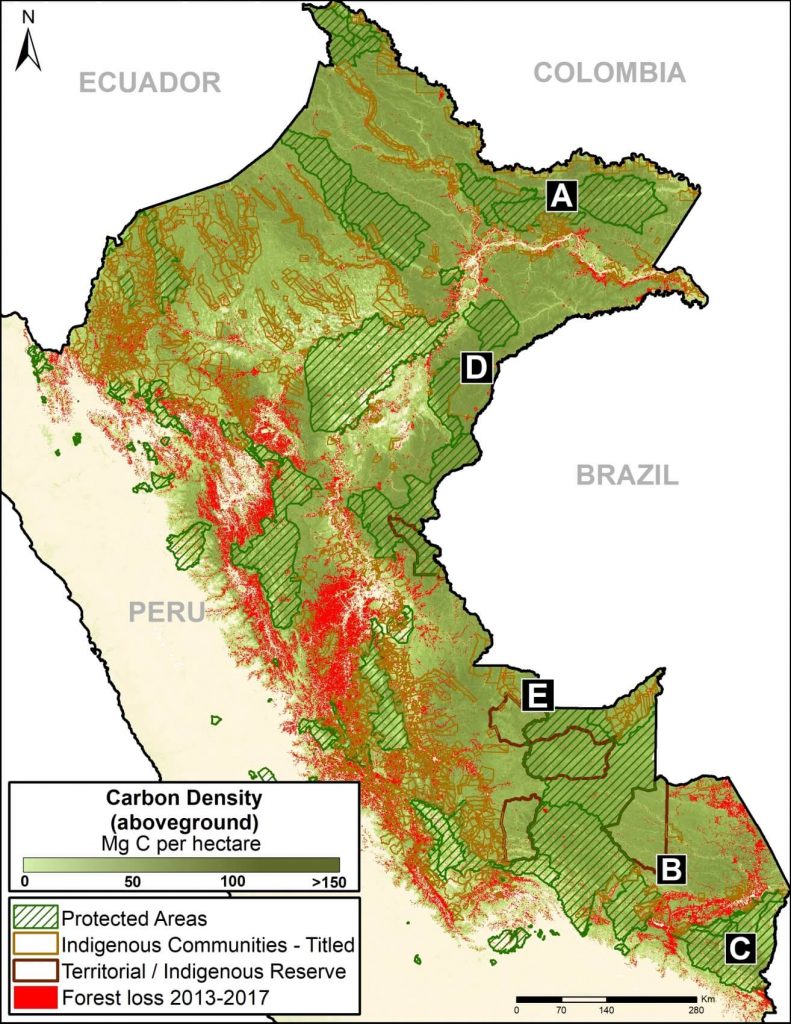
Base Map. Data: Asner et al 2014, MINAM/PNCB, SERNANP, IBC

Here, we show the importance of protected areas and indigenous lands to safeguard these carbon stocks.

In MAAP #81, we estimated the loss of 59 million metric tons of carbon in the Peruvian Amazon during the last five years (2013-17) due to forest loss, especially deforestation from mining and agricultural activities.

This finding reveals that forest loss represents nearly half (47%) of Peru’s annual carbon emissions, including from burning fossil fuels.1,2

In contrast, here we show that protected areas and indigenous lands have safeguarded 3.17 billion metric tons of carbon, as of 2017.3,4

The Base Map (on the right) shows, in shades of green, the current carbon densities in relation to these areas.

The breakdown of results are:
1.85 billion tons safeguarded in the Peruvian national protected areas system;
1.15 billion tons safeguarded in titled native community lands; and
309.7 million tons safeguarded in Territorial Reserves for indigenous peoples in voluntary isolation.

The total safeguarded carbon (3.17 billion metric tons) is the equivalent to 2.5 years of carbon emissions from the United States.5

Below, we show several examples of how protected areas and indigenous lands are safeguarding carbon reservoirs in important areas, indicated by insets A-E.

MAAP #81: Carbon loss from deforestation in the Peruvian Amazon

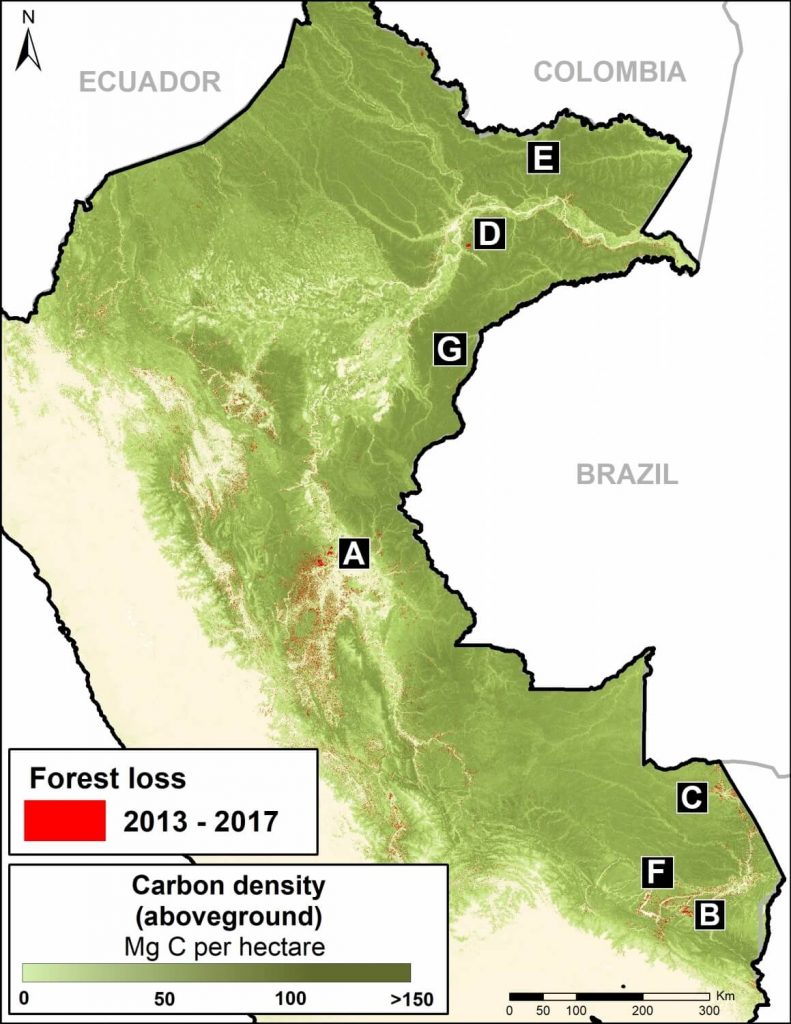
Base Map. Data: MINAM/PNCB, Asner et al 2014

Download PDF of this article

When tropical forests are cleared, the enormous amount of carbon stored in the trees is released to the atmosphere, making it a major source of global greenhouse gas emissions (CO2) that drive climate change.

In fact, a recent study revealed that deforestation and degradation are turning tropical forests into a new net carbon source for the atmosphere, exacerbating climate change.1

The Amazon is the world’s largest tropical forest, and Peru is a key piece of that. Researchers (led by Greg Asner at the Carnegie Institution for Science) recently published the first high-resolution estimate of aboveground carbon in the Peruvian Amazon, documenting 6.83 billion metric tons.2

Here, we analyze this same dataset to estimate the total carbon emissions from deforestation in the Peruvian Amazon between 2013 and 2017. We estimate the loss of 59 million metric tons of carbon during these last five years, the equivalent of around 4% of annual United States fossil fuel emissions.3

We present a series of zoom images to show how carbon loss happened in several key areas impacted by the major deforestation drivers: gold mining, large-scale oil palm and cacao plantations, and smaller-scale agriculture. The labels A-G correspond to the zooms below.

We also show how protected areas are protecting hundreds of millions of metric tons of carbon in some of the most important areas in the country.

On the positive side, having this detailed information may provide added incentives to slow deforestation and degradation as part of critical climate change strategies.


Major Findings
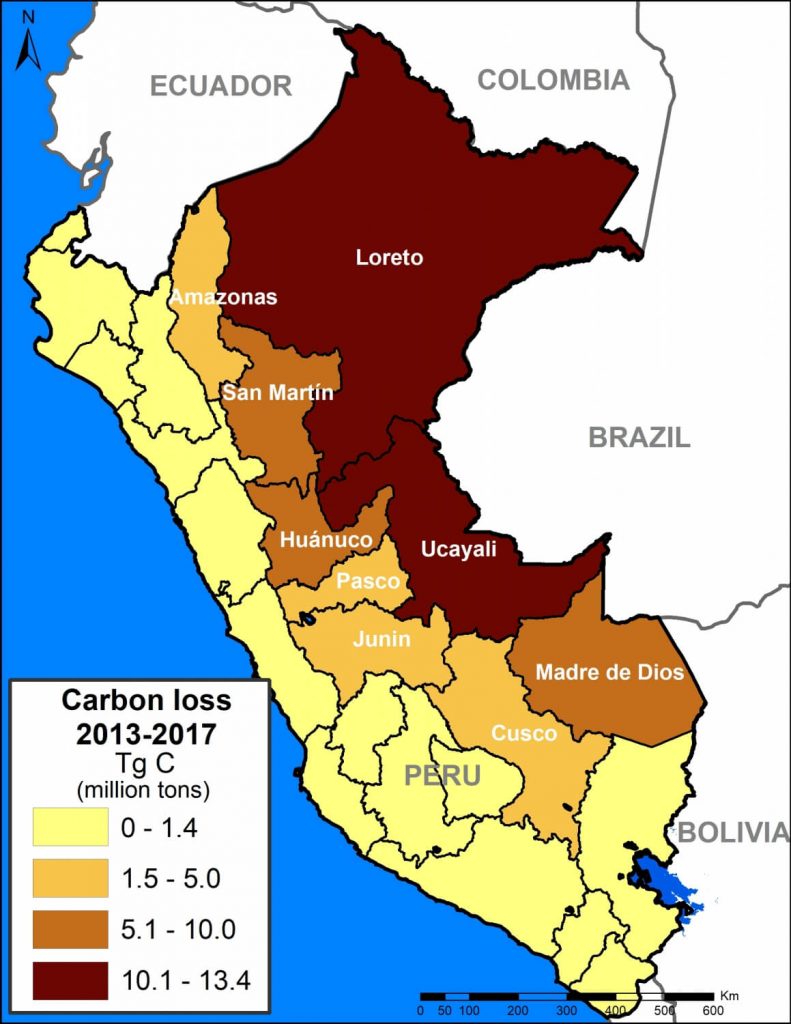
Data: Asner et al 2014

The base map (see above) shows, in shades of green, carbon densities across Peru. It also shows, in red, the forest loss layer from 2013 to 2017.

We calculated the estimated amount of carbon emissions from forest loss during these five years: 59.029 teragrams, or 59 million metric tons.

The regions with the most carbon loss are 1) Loreto (13.4 million metric tons), 2) Ucayali (13.2 million), 3) Huánuco (7.3 million), 4) Madre de Dios (7 million), and 5) San Martin (6.9 million).

These values include some natural forest loss. Overall, however, they should be considered underestimates because they do not include forest degradation (for example, selective logging).

A recent study revealed that degradation may account for 70% of emissions, thus total carbon emissions from forests in the Peruvian Amazon may be closer to 200 million metric tons.

Next, we show a series of zoom images to show how carbon loss happened in several key areas. We also show how protected areas and conservation concessions are protecting the most important carbon reserves.


Zoom A: Central Peruvian Amazon

Image A shows the loss of 2.8 million metric tons of carbon in a section of the central Peruvian Amazon (Ucayali region). On the east side of image, note the loss due to two large-scale oil palm plantations (649,000 metric tons); on the west side, note small-scale agriculture penetrating deeper into high carbon density forest.
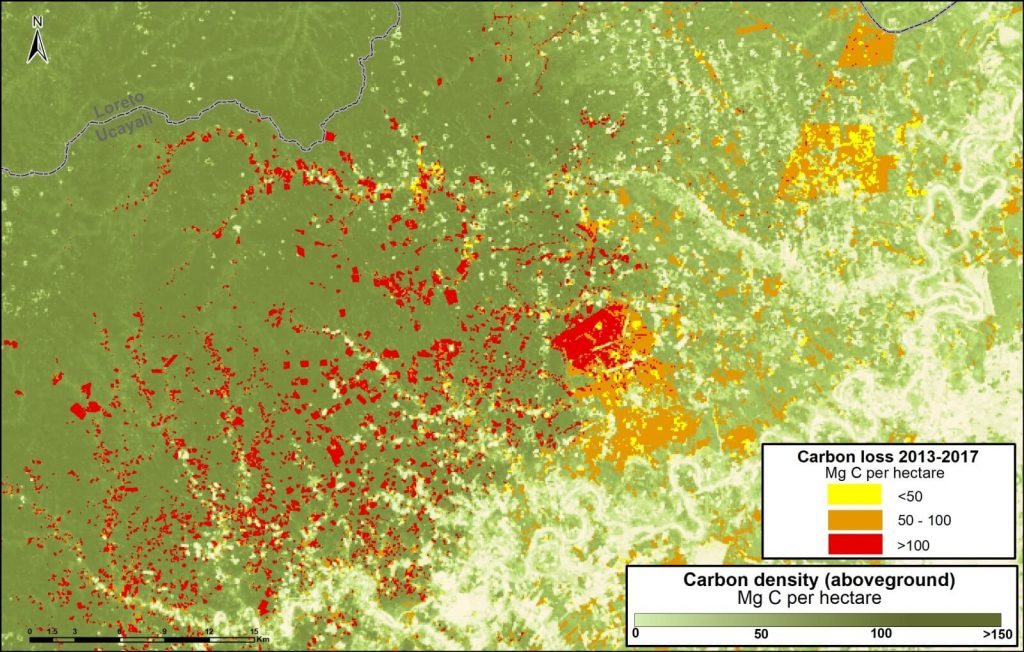
Image A. Central Peruvian Amazon. Data: Asner et al 2014, MINAM/PNCB

Zoom B: Southern Peruvian Amazon (gold mining) 

Image B shows the loss of 756 thousand metric tons of carbon due to gold mining in the southern Peruvian Amazon (Madre de Dios region). On the east side of image is the sector known as La Pampa; west side is Upper Malinowski.
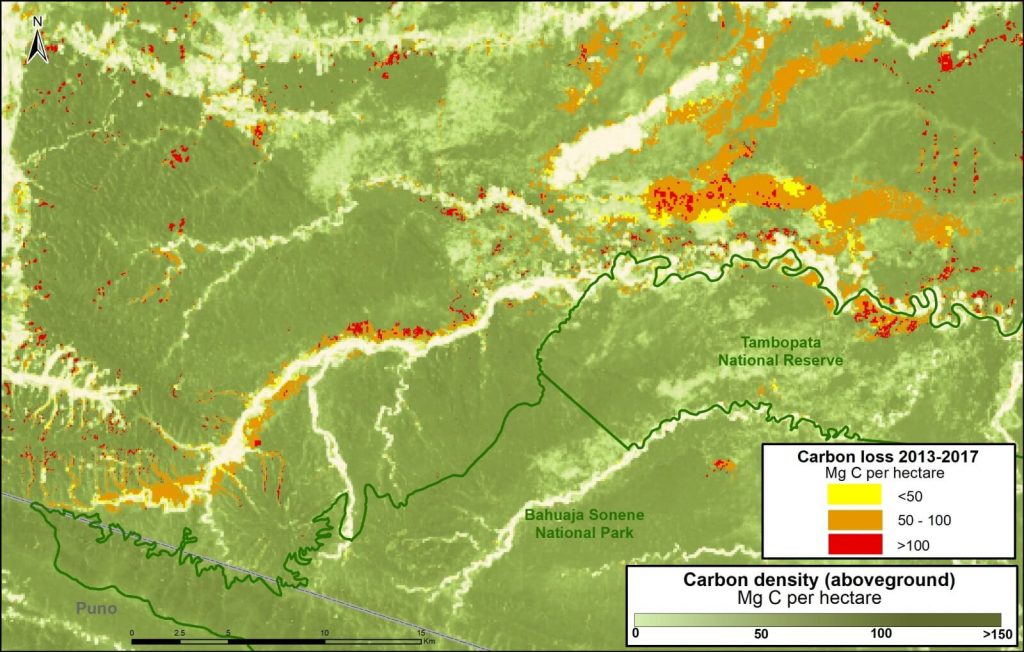
Image B. Gold mining. Data: Asner et al 2014, MINAM/PNCB

Zoom C: Southern Peruvian Amazon (agriculture)

Image C shows the loss of 876 thousand metric tons of carbon in the southern Peruvian Amazon around the town of Iberia (Madre de Dios region). Note the expanding carbon loss along both sides of the Interoceanic Highway that crosses the image.
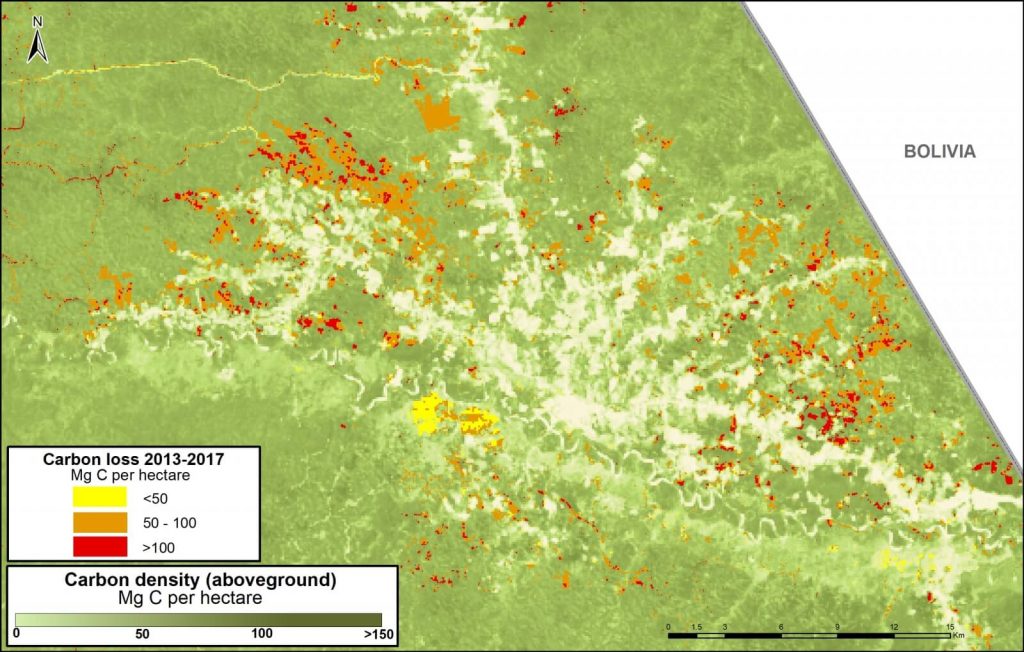
Image C. Iberia. Data: Asner et al 2014, MINAM/PNCB

Zoom D: United Cacao

Image D shows the loss of 291 thousand metric tons of carbon for a large-scale cacao project (United Cacao) in the northern Peruvian Amazon (Loreto region). Note that nearly all the forest clearing occurred in high carbon density forest. This is another line of evidence that the company cleared primary forest, contrary to their claims that the area was already degraded.
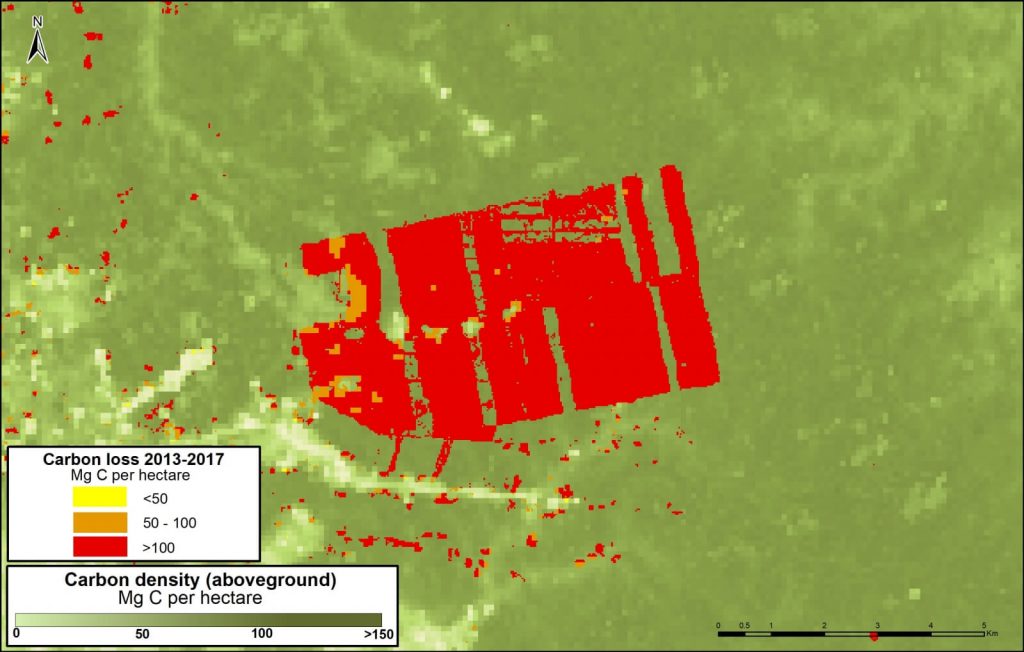
Image D. United Cacao. Data: Asner et al 2014, MINAM/PNCB

Zoom E: Yaguas National Park

Image E shows how three protected areas, including the new Yaguas National Park, are effectively safeguarding 202 million metric tons of carbon in the northeastern Peruvian Amazon. This area is home to some of the highest carbon densities in the country.
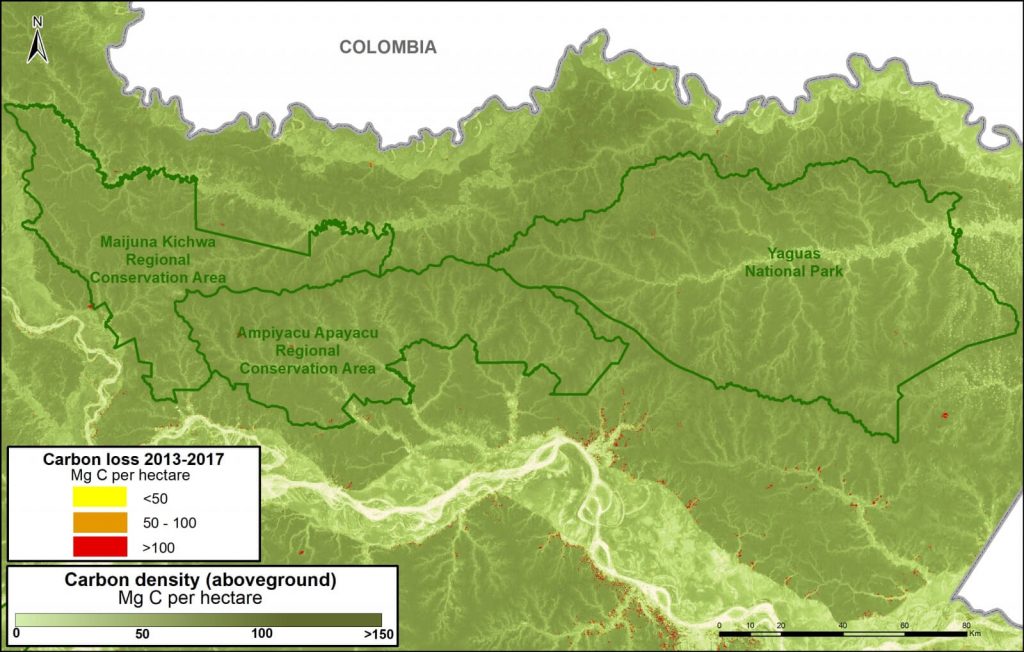
Image E. Yaguas. Data: Asner et al 2014, MINAM/PNCB

Zoom F: Los Amigos Conservation Concession

Image F shows how Los Amigos, the world’s first conservation concession, is effectively safeguarding 15 million metric tons of carbon in the southern Peruvian Amazon. Two surrounding protected areas, Manu National Park and Amarakaeri Communal Reserve, safeguard an additional 194 million metric tons. This area is home to some of the highest carbon densities in the country.
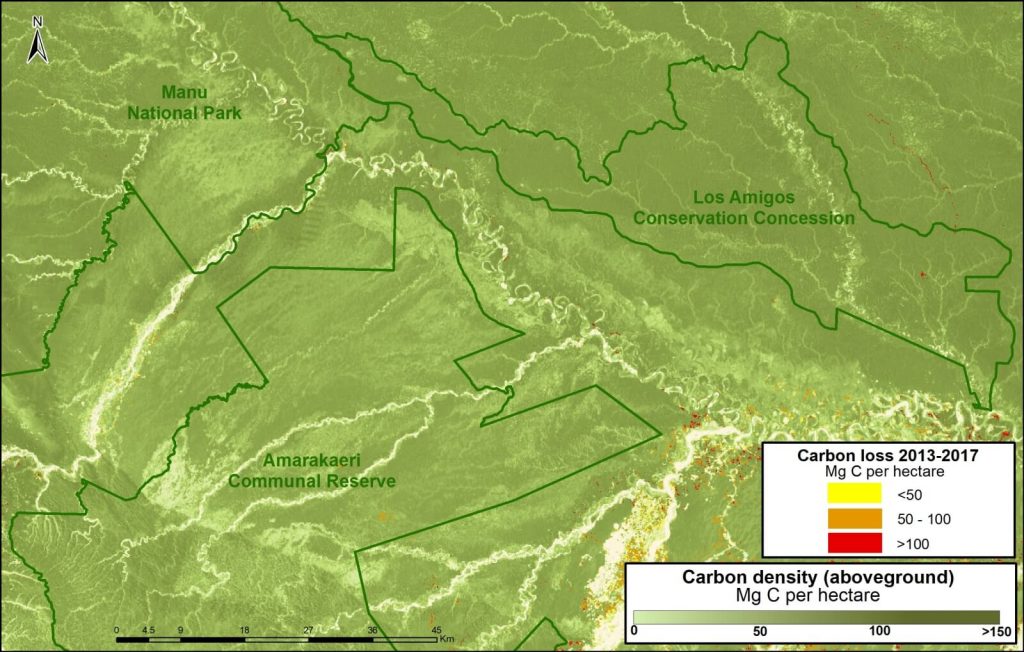
Image F. Los Amigos. Data: Asner et al 2014, MINAM/PNCB

Zoom G: Sierra del Divisor National Park
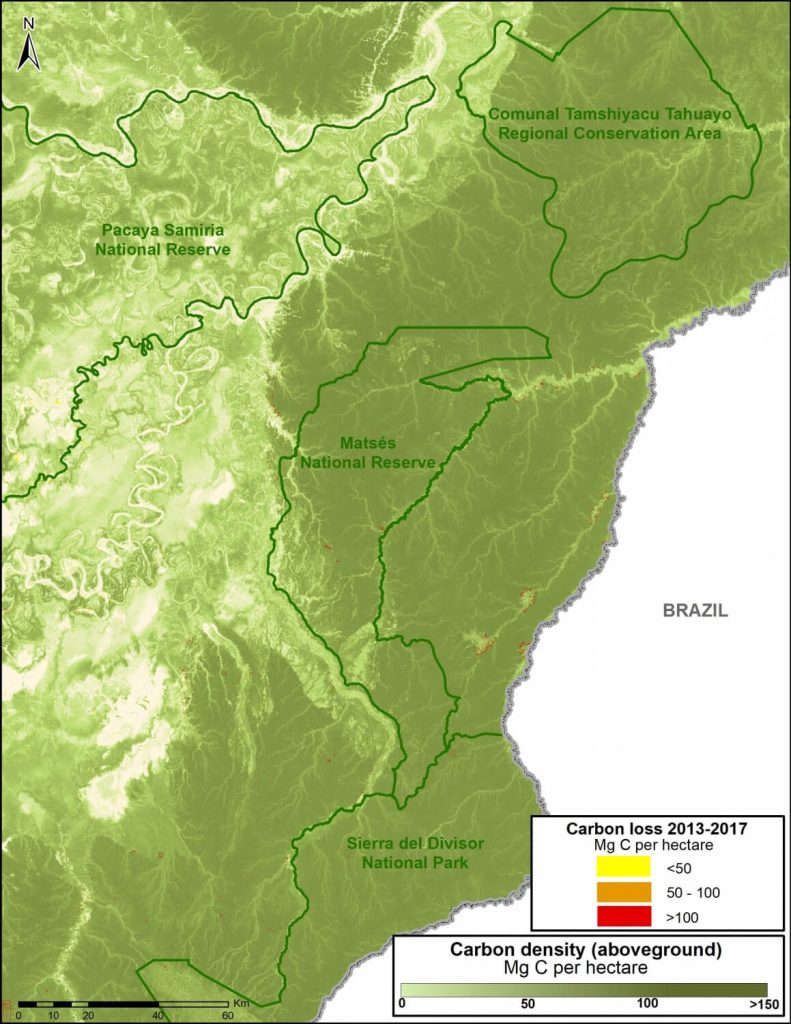
Image G. Data: Asner et al 2014, MINAM/PNCB

Image G shows how three protected areas, including the new Sierra del Divisor National Park, are effectively safeguarding 270 million metric tons of carbon in the eastern Peruvian Amazon.

This area is home to some of the highest carbon densities in the country.


Methodology

Para el análisis se utilizó los datos de carbono sobre el suelo  generados por Asner et al 2014, y los datos de pérdida de bosques identificados por el Programa Nacional de Conservación de Bosques (PNBC-MINAM) de los años 2013 al 2016 así como las alertas tempranas del año 2017. Primero uniformizamos los datos de pérdida de bosque 2013-2016 con las alertas tempranas del año 2017 para evitar superposición y tener un solo dato 2013-2017. Posteriormente, extraemos los datos de carbono de las áreas de pérdida de bosque del 2013-2017, este proceso permitió obtener la densidad de carbono (por hectárea) en relación al área de la pérdida de bosque para finalmente estimar el total de stocks de carbono perdido entre el año 2013 al 2017.


References

Baccini A, Walker W, Carvalho L, Farina M, Sulla-Menashe D, Houghton RA (2017) Tropical forests are a net carbon source based on aboveground measurements of gain and loss. Science. 13;358(6360):230-4.

Asner GP et al (2014). The High-Resolution Carbon Geography of Perú. Carnegie Institution for Science.

Boden TA, Andres RJ, Marland G (2017) National CO2 Emissions from Fossil-Fuel Burning, Cement Manufacture, and Gas Flaring: 1751-2014. DOI 10.3334/CDIAC/00001_V2017


Citation

Finer M, Mamani N (2017). Carbon loss from deforestation in the Peruvian Amazon. MAAP: 81.