MAAP #113: Satellites Reveal What Fueled Brazilian Amazon Fires

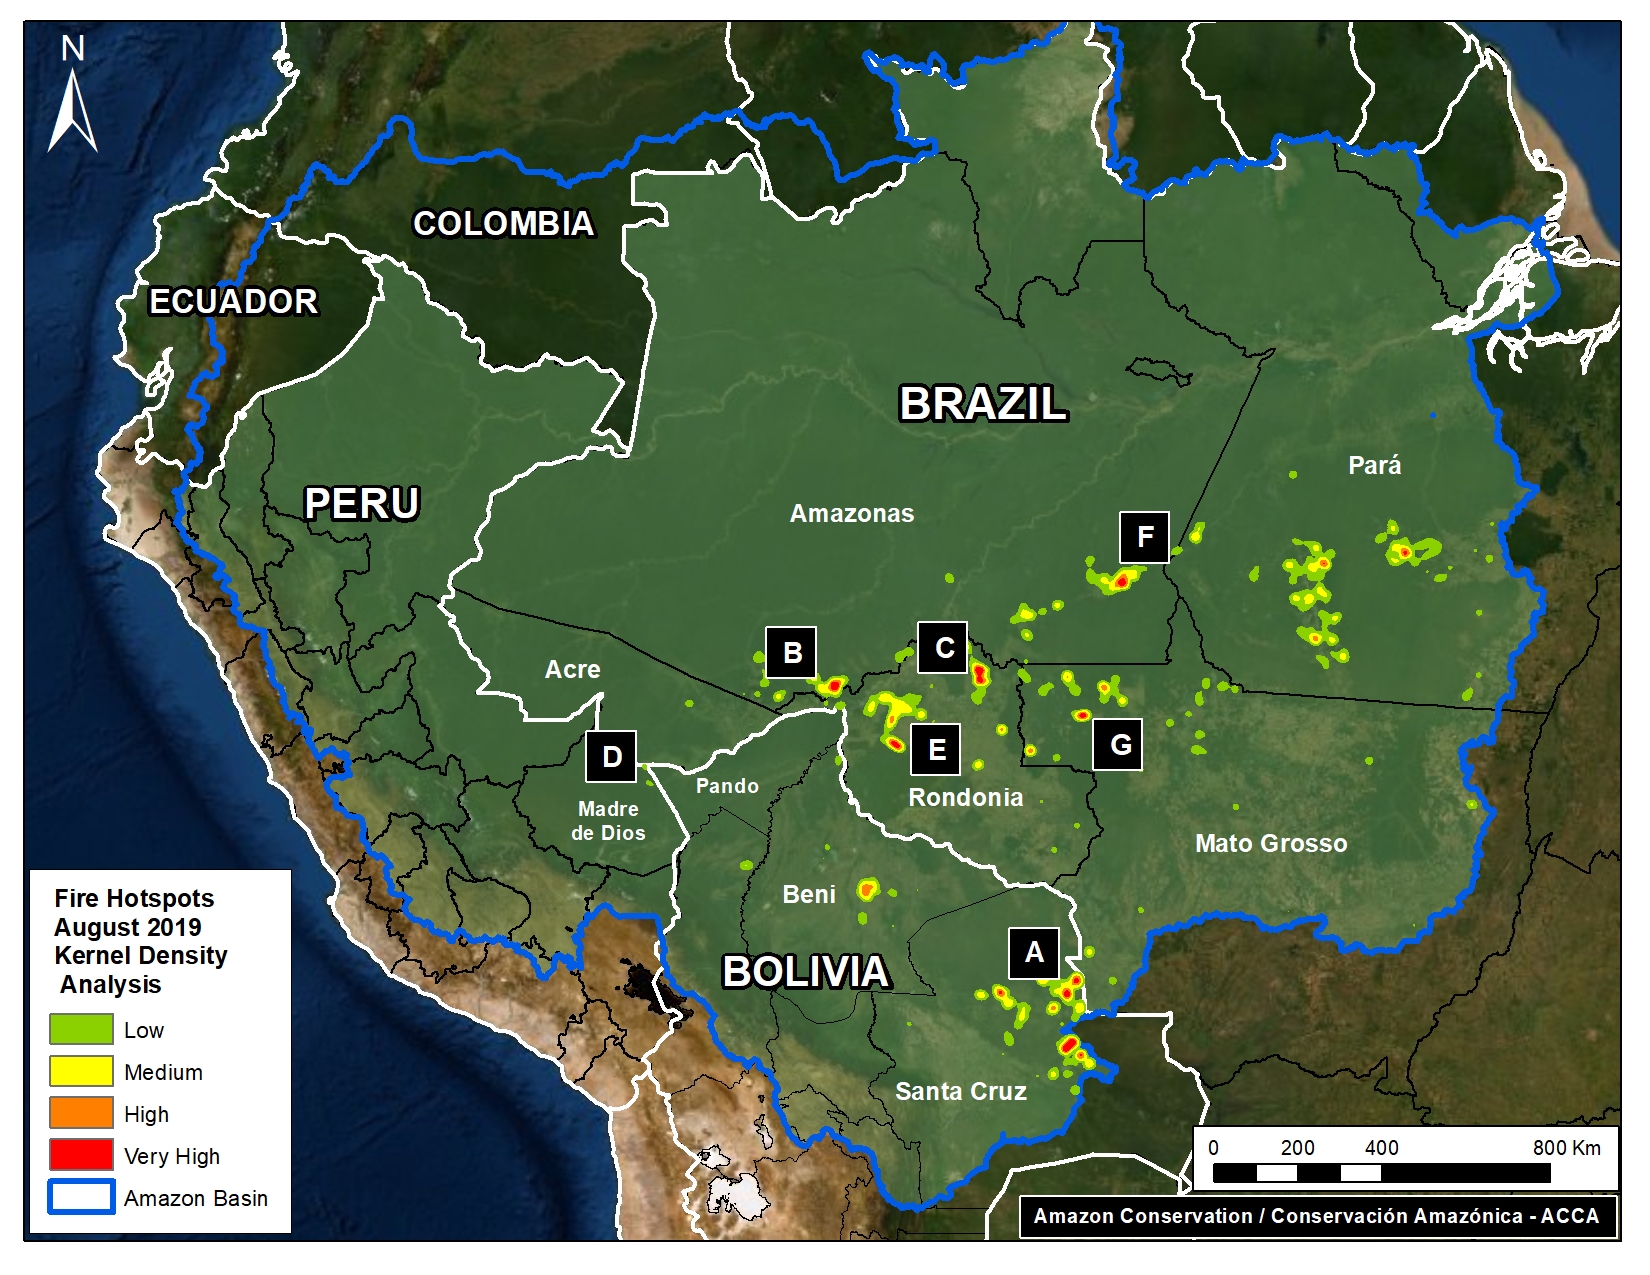
As part of our ongoing coverage, we present two key new findings about the Brazilian Amazon fires that captured the world’s attention in August (see our novel satellite-based methodology below).

First, we found that many of the fires, covering over 450,000 hectares, burned areas recently deforested since 2017 (orange in Base Map). That is a massive area equivalent to over a million acres (or 830,000 American football fields), mostly in the states Amazonas, Rondônia, and Pará.

Importantly, 65% (298,000 hectares) of this area was both deforested and burned this year, 2019.

satellites-reveal-what-fueled-brazilian-amazon-fires-BrazilianAmazon-Fires
Base Map. Brazilian Amazon 2019. Data: UMD/GLAD, NASA (MODIS), DETER, Hansen/UMD/Google/USGS/NASA.

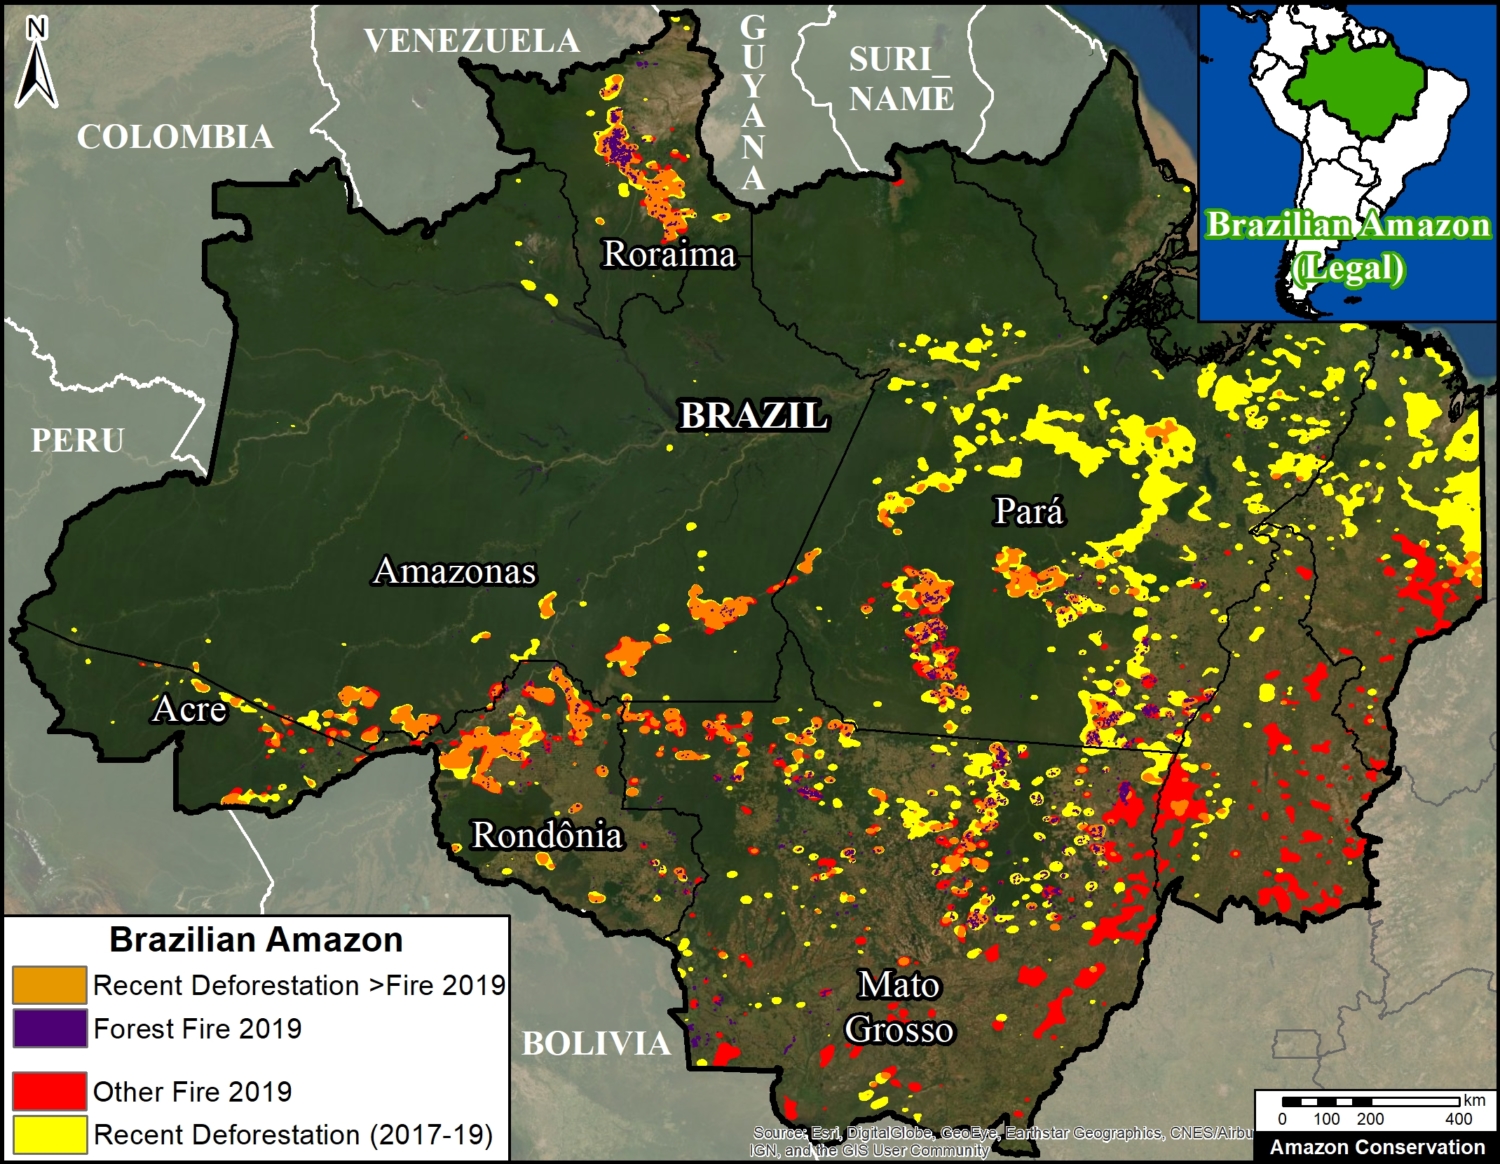
Second, we found 160,400 hectares of primary forest burned in 2019 (purple in Base Map).* Most of these areas surround deforested lands in the states of Mato Grosso and Pará, and were likely pasture or agricultural fires that escaped into the forest.

As far as we know, these are the first precise estimates based on detailed analysis of satellite imagery. Other estimates based solely on fire alerts tend to greatly overestimate burned areas due to their large spatial resolution.

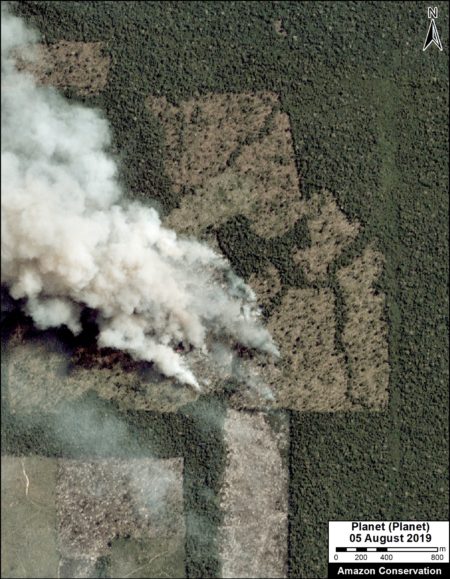
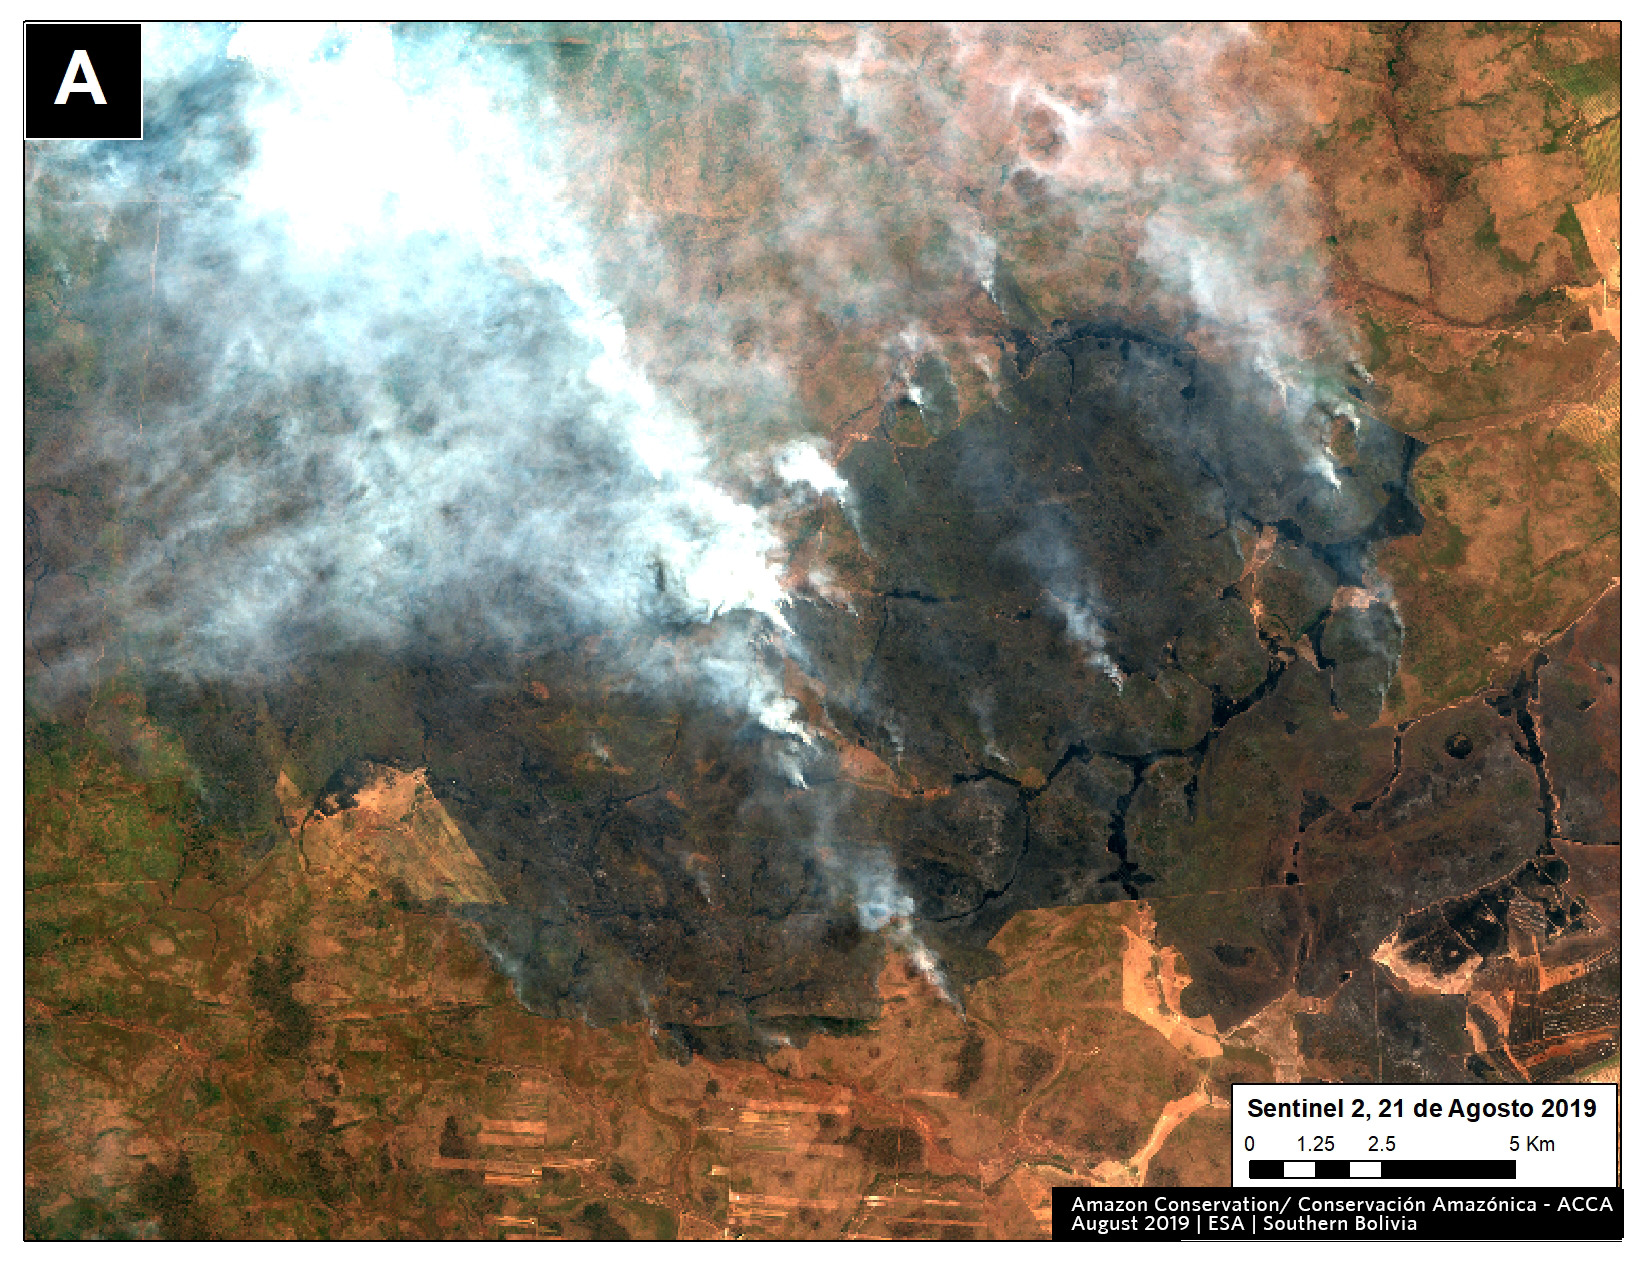
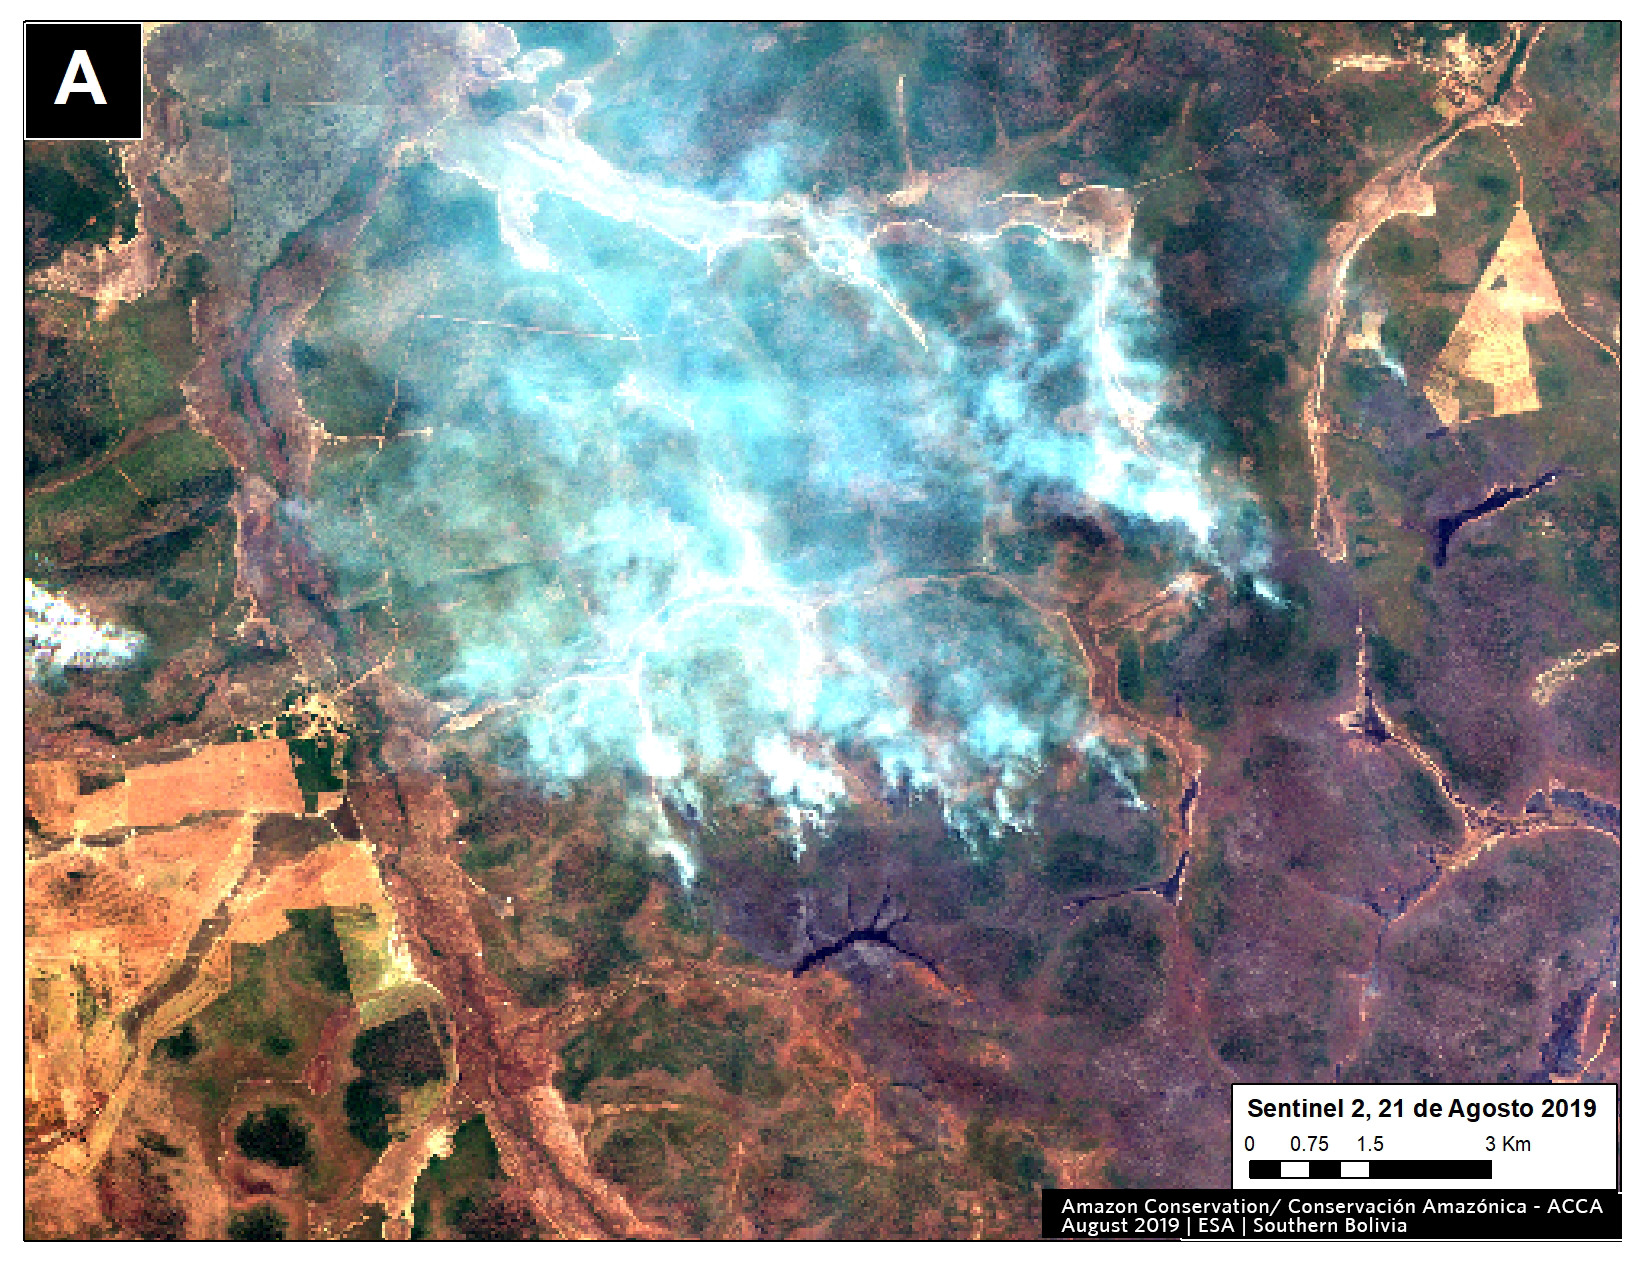
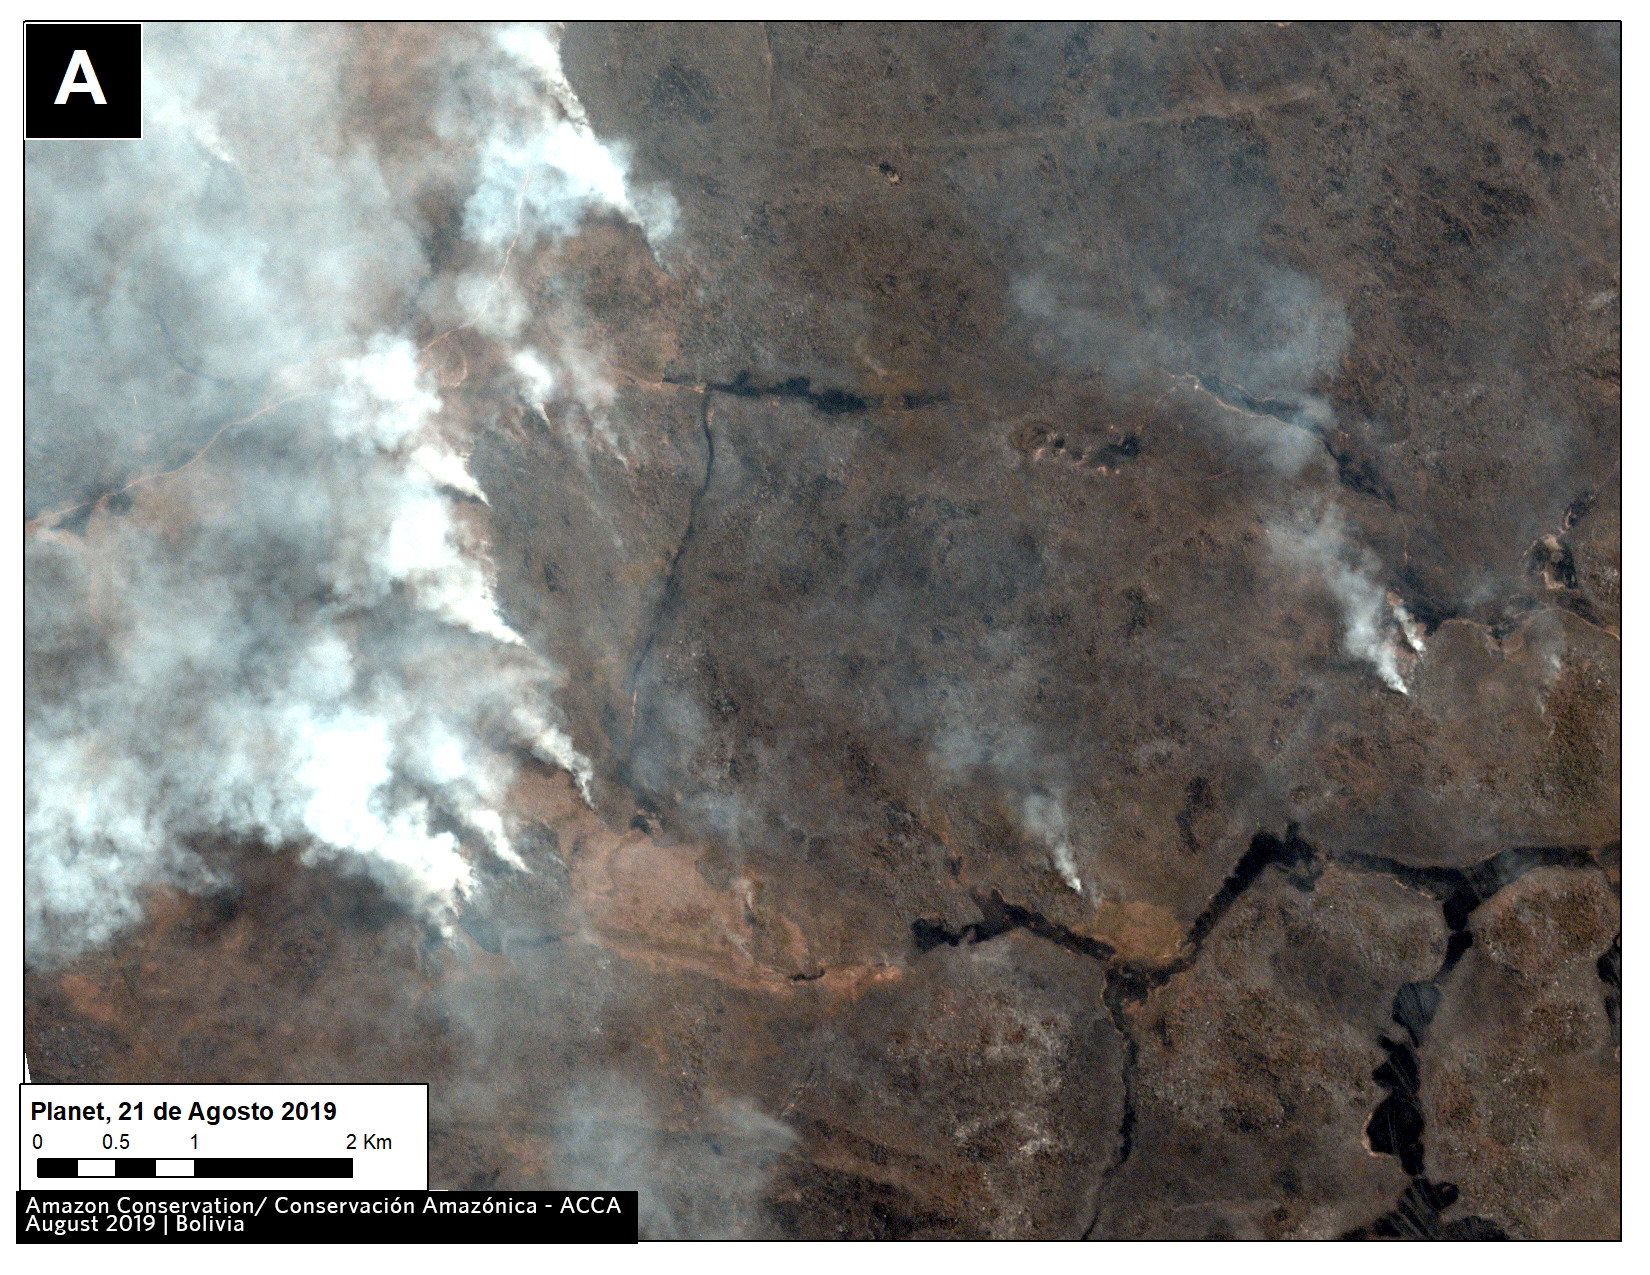
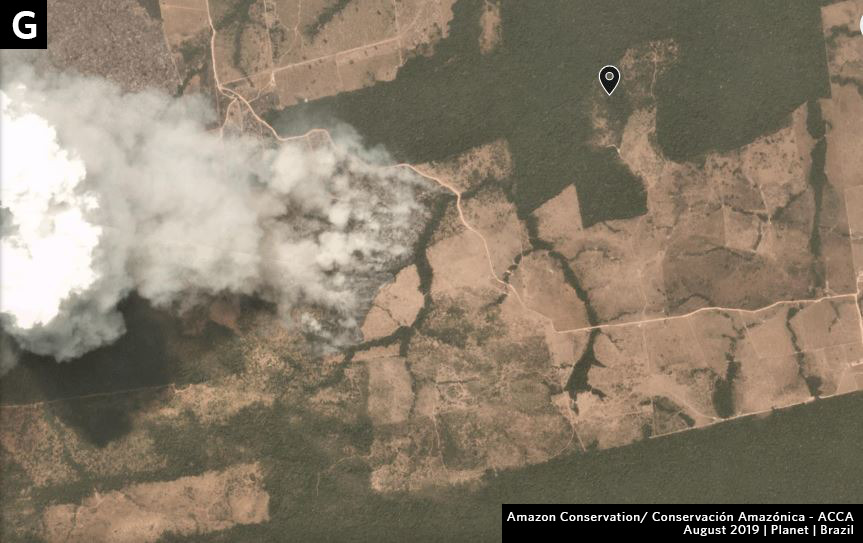
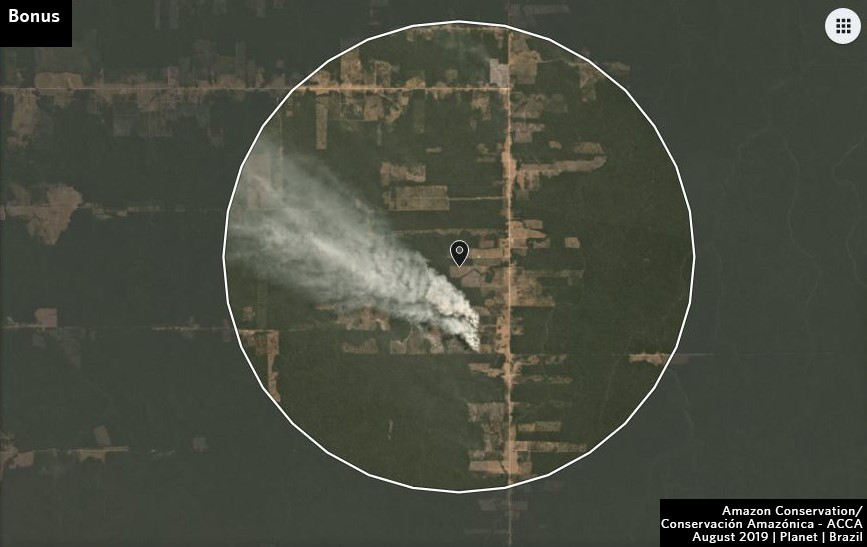
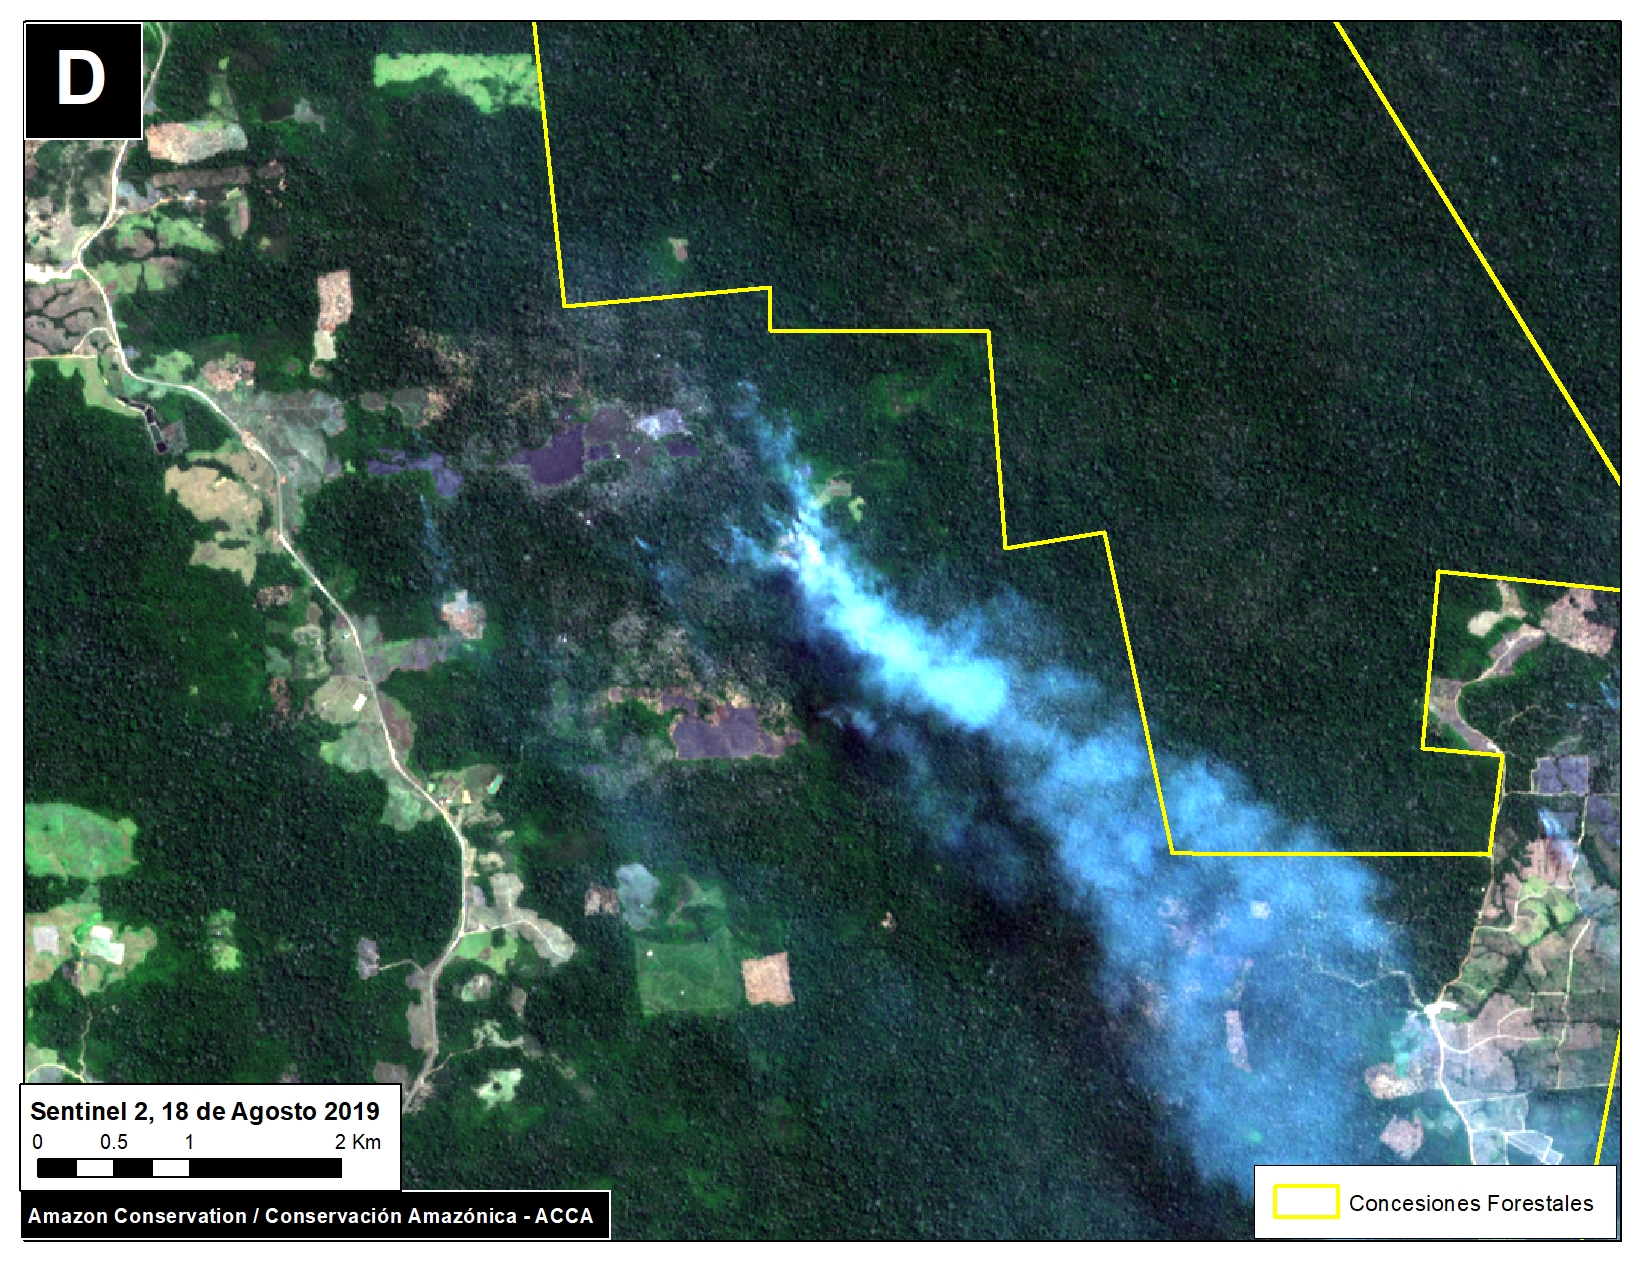
Below we present a series of satellite time-lapse videos showing examples of the different types of fires we documented.


Policy Implications

The policy implications of these findings are critically important: national and international focus needs to be on minimizing new deforestation, in addition to fire prevention and management.

That is, we need to recognize that many of the fires are in fact a lagging indicator of previous deforestation, thus to minimize fires we need to minimize deforestation.

For example, one of the leading deforestation drivers in the Brazilian Amazon is cattle ranching (1, 2, 3). What measures can be taken to prevent the further expansion of the ranching frontier?


Satellite Time-lapse Videos

Deforestation Followed by Fire

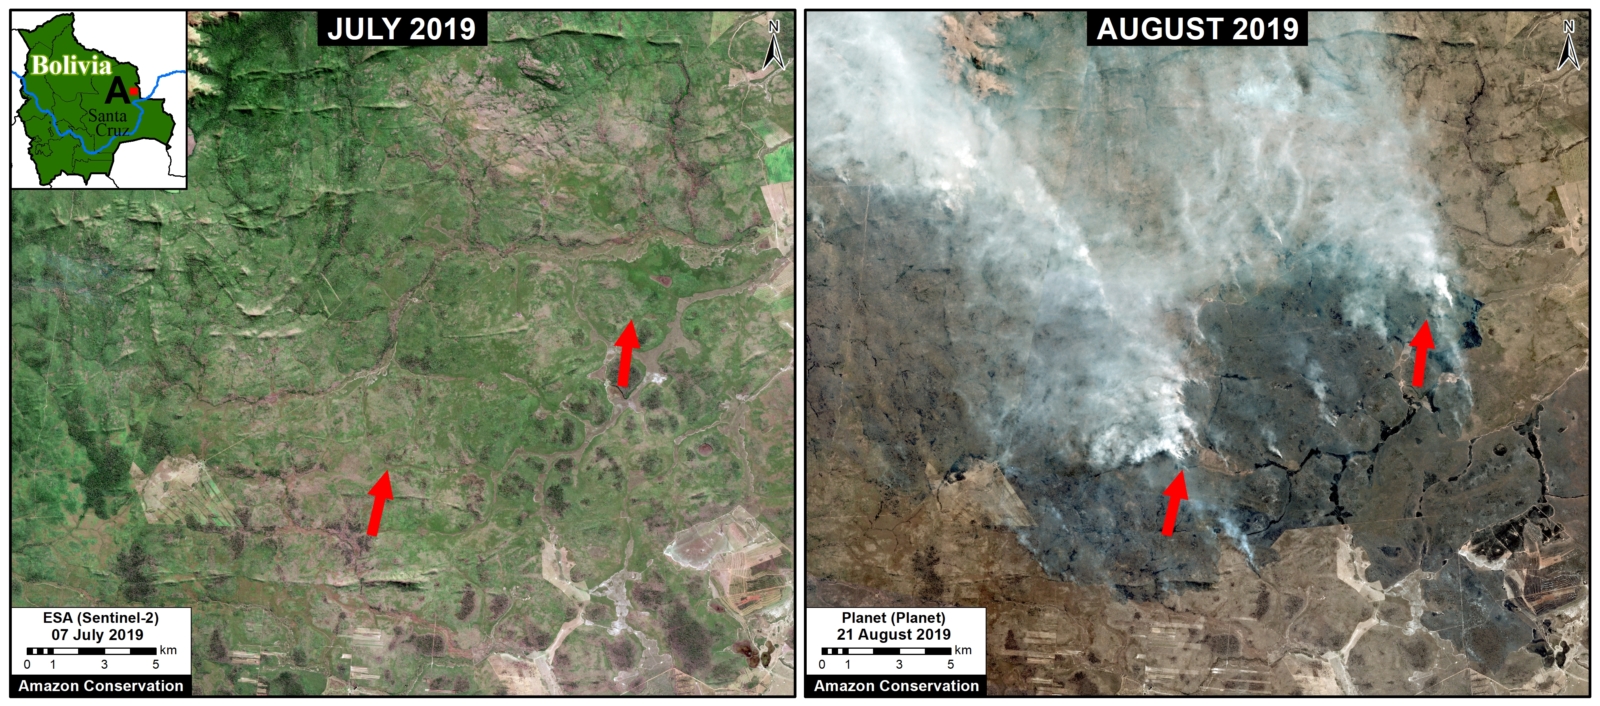
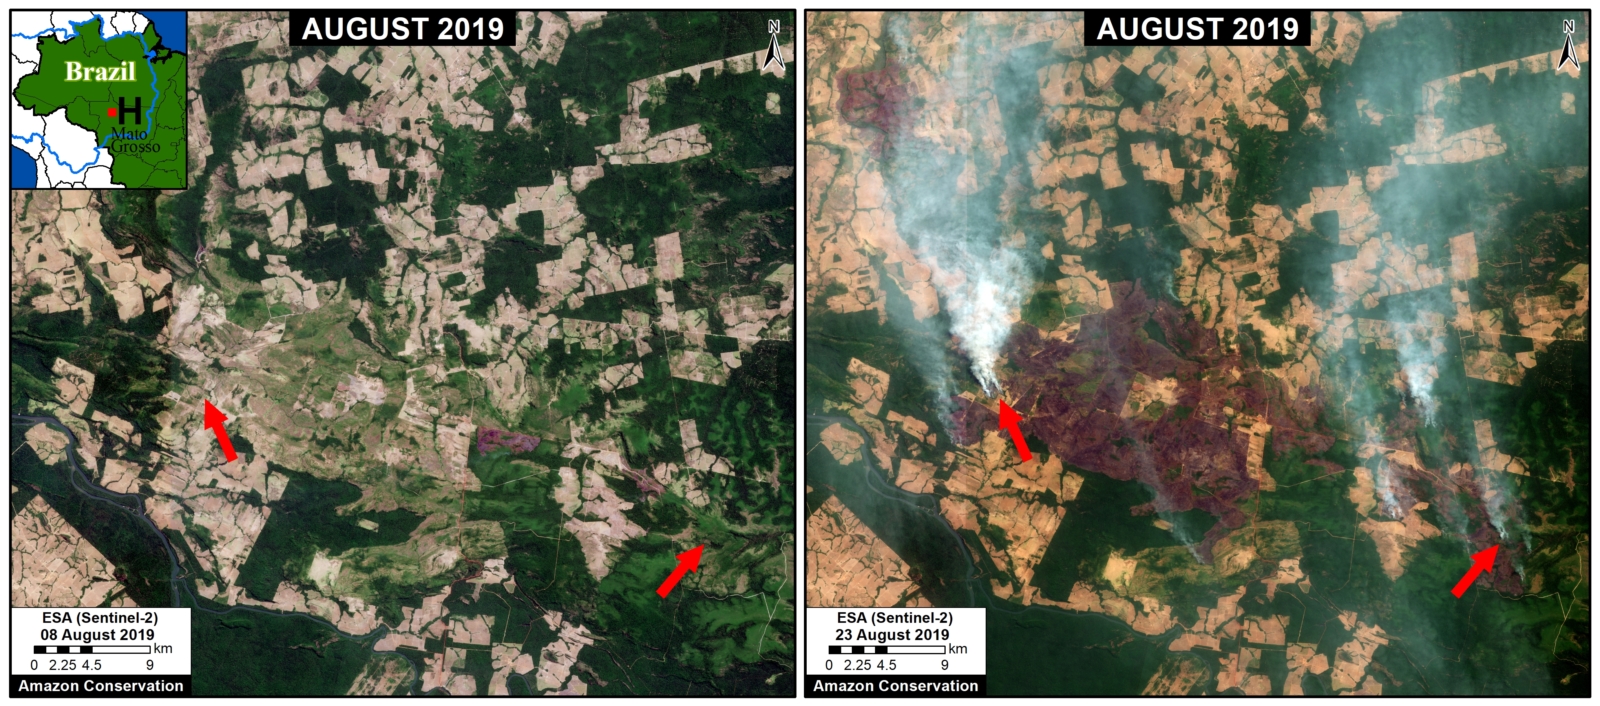
Video A shows the deforestation of 1,760 hectares (4,350 acres) in Mato Grosso state in 2019 (May to July), followed by fires in August. Planet link.

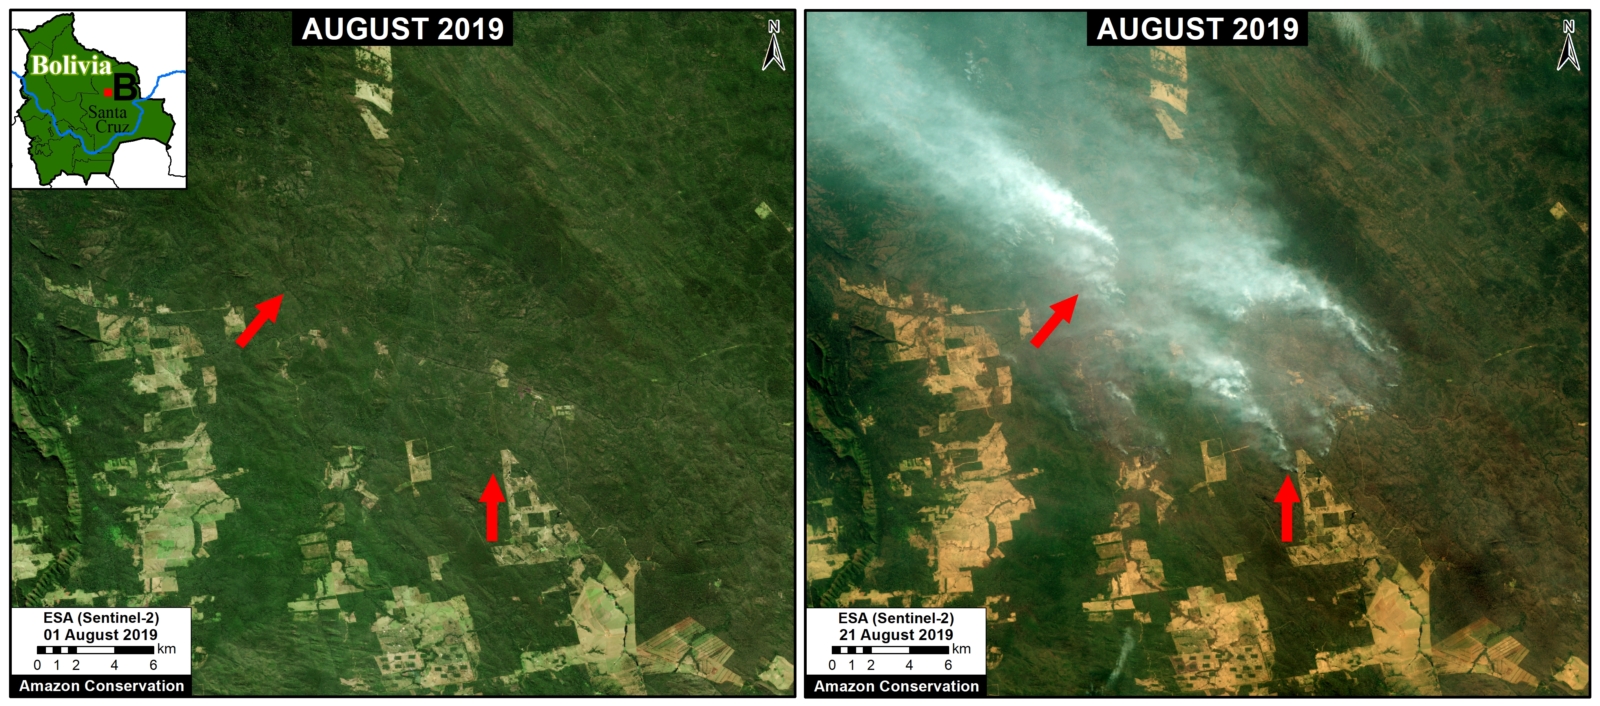
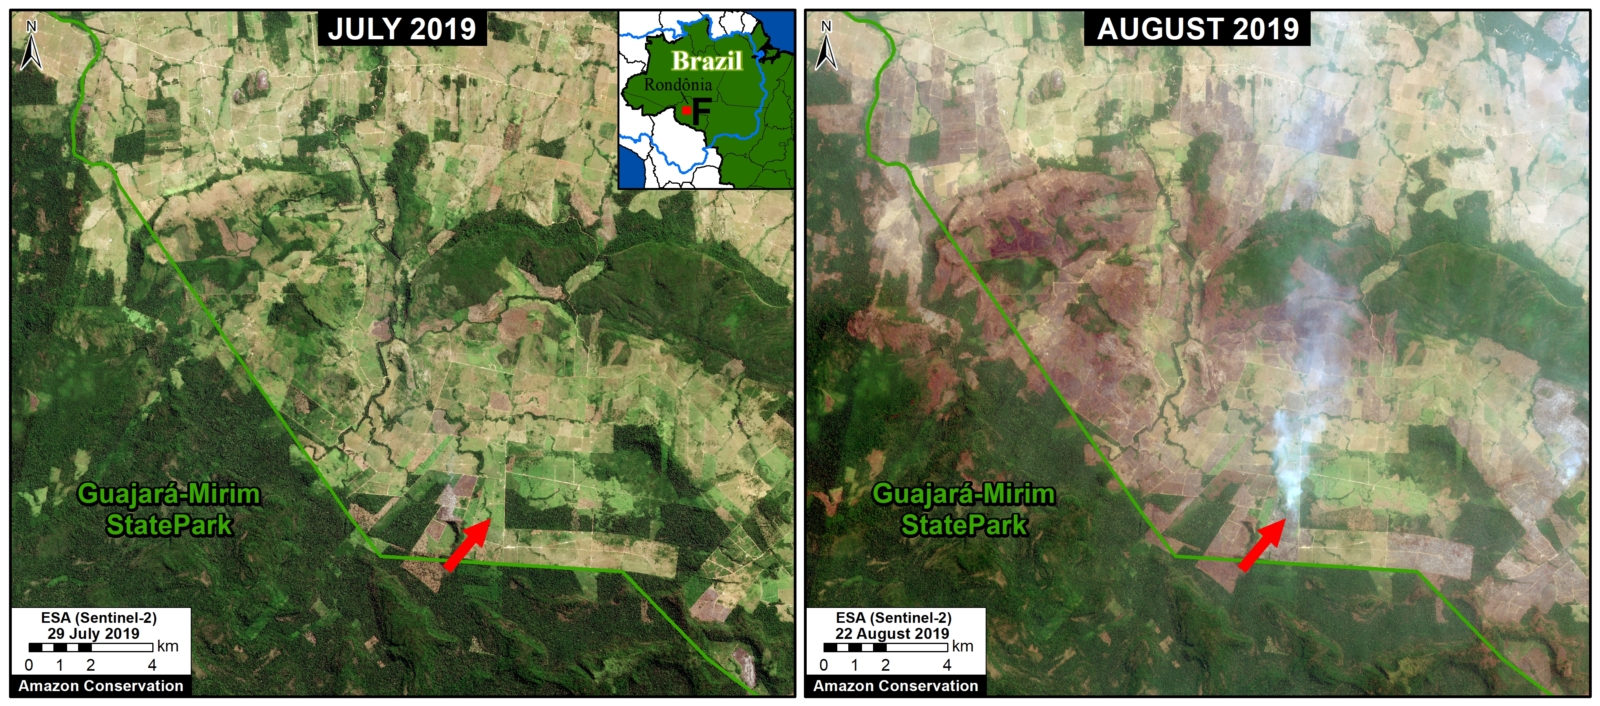
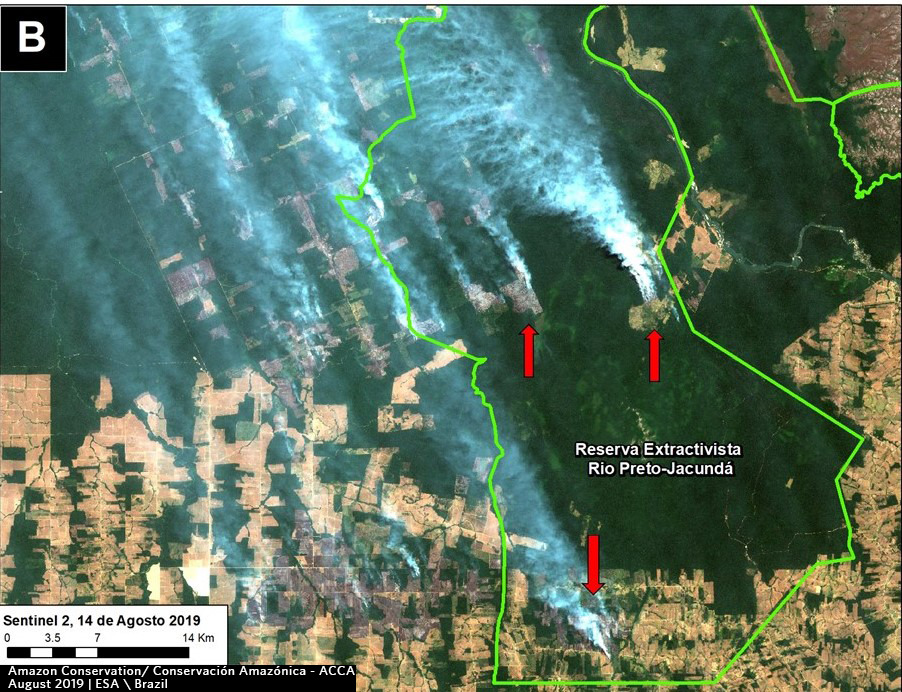
Video B shows the deforestation of 650 hectares (1,600 acres) in Rondônia state in 2019 (April to July), followed by fire in August. Planet link.


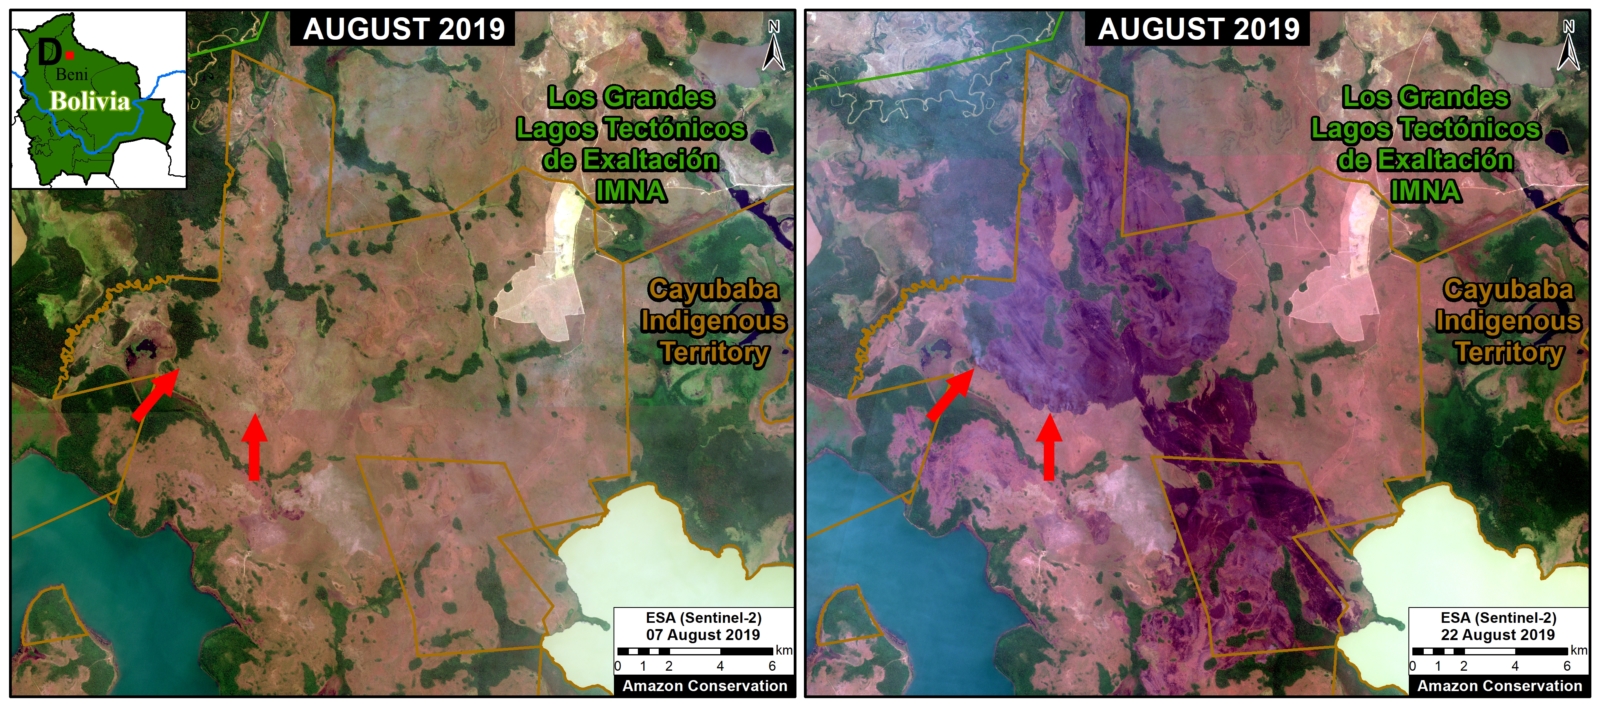
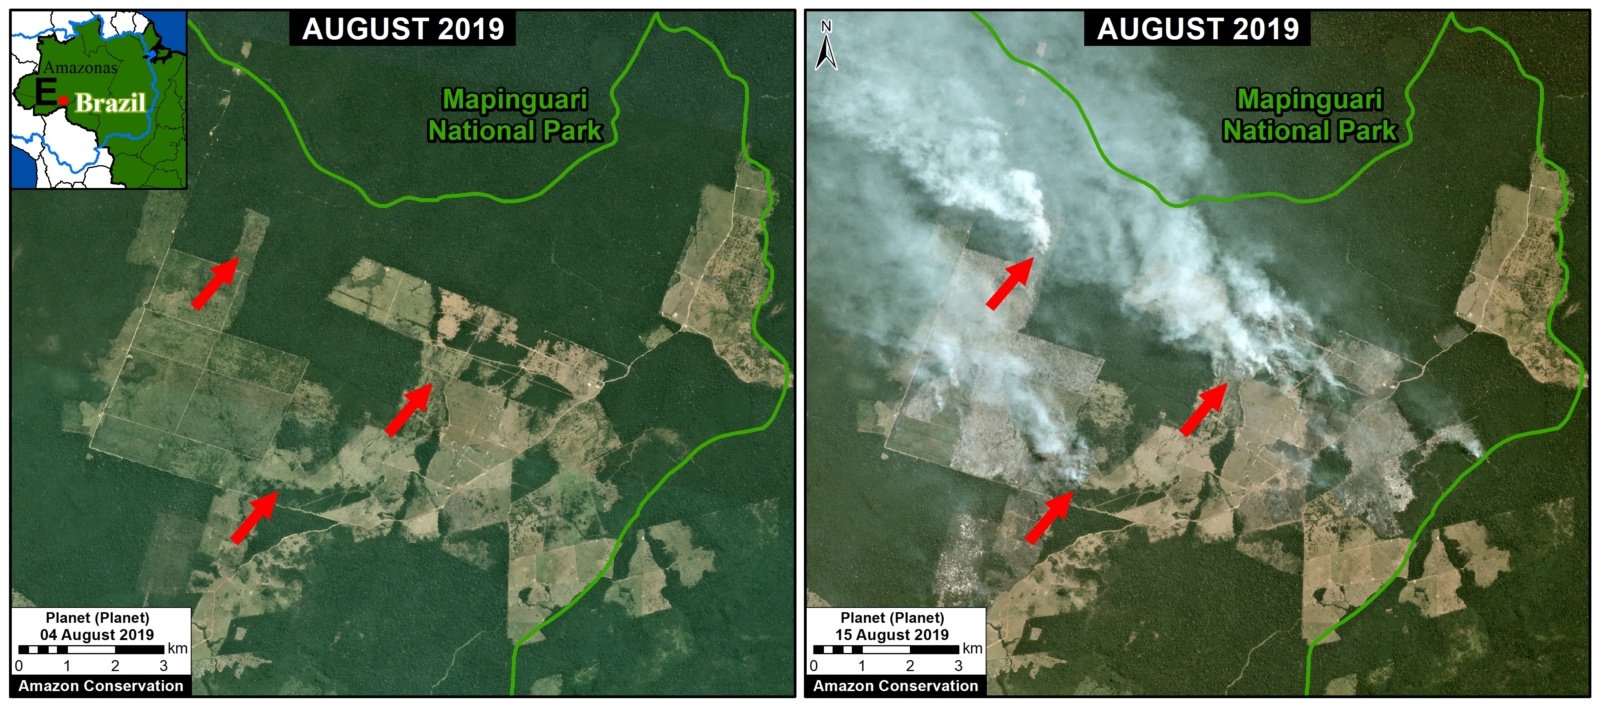
Deforestation Caused by Fire

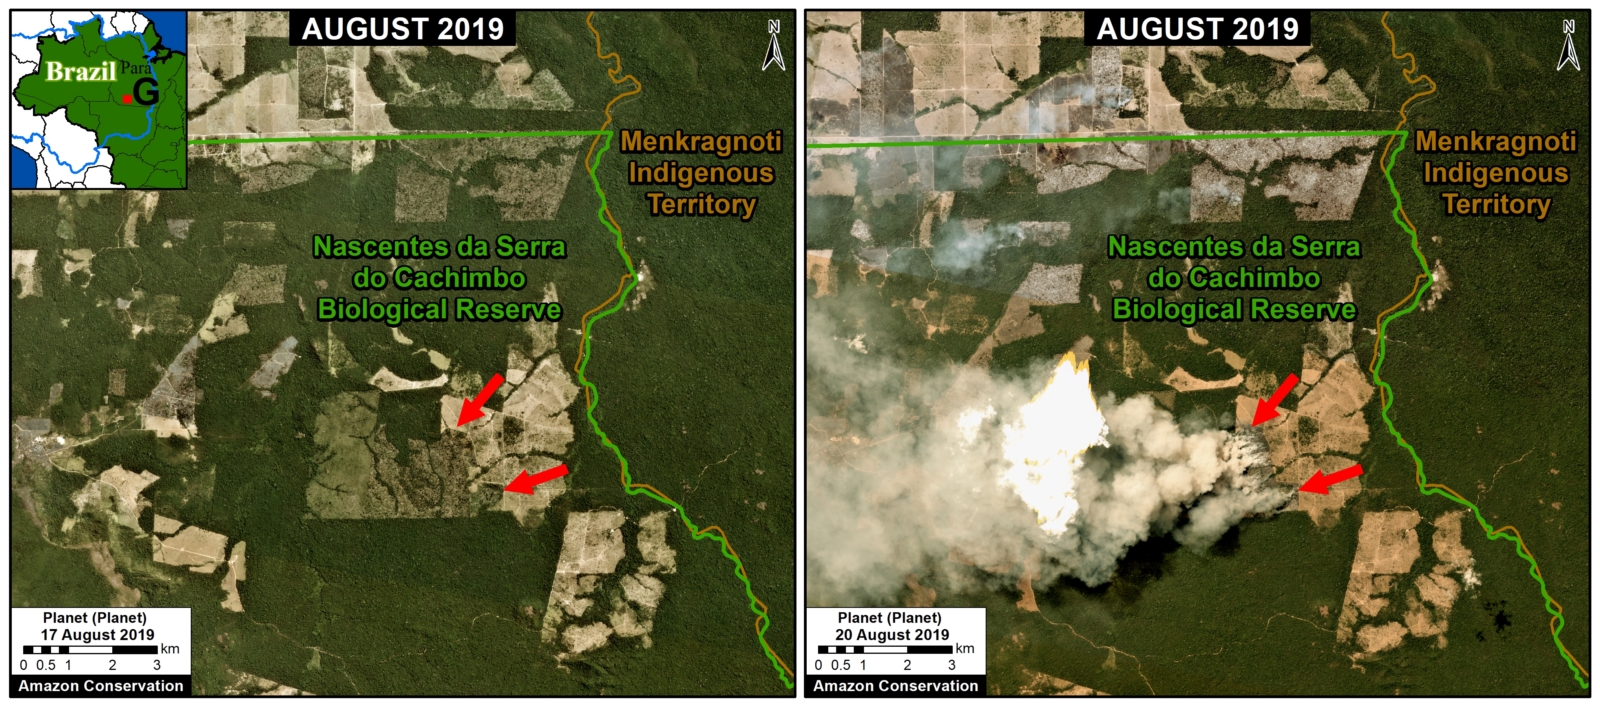
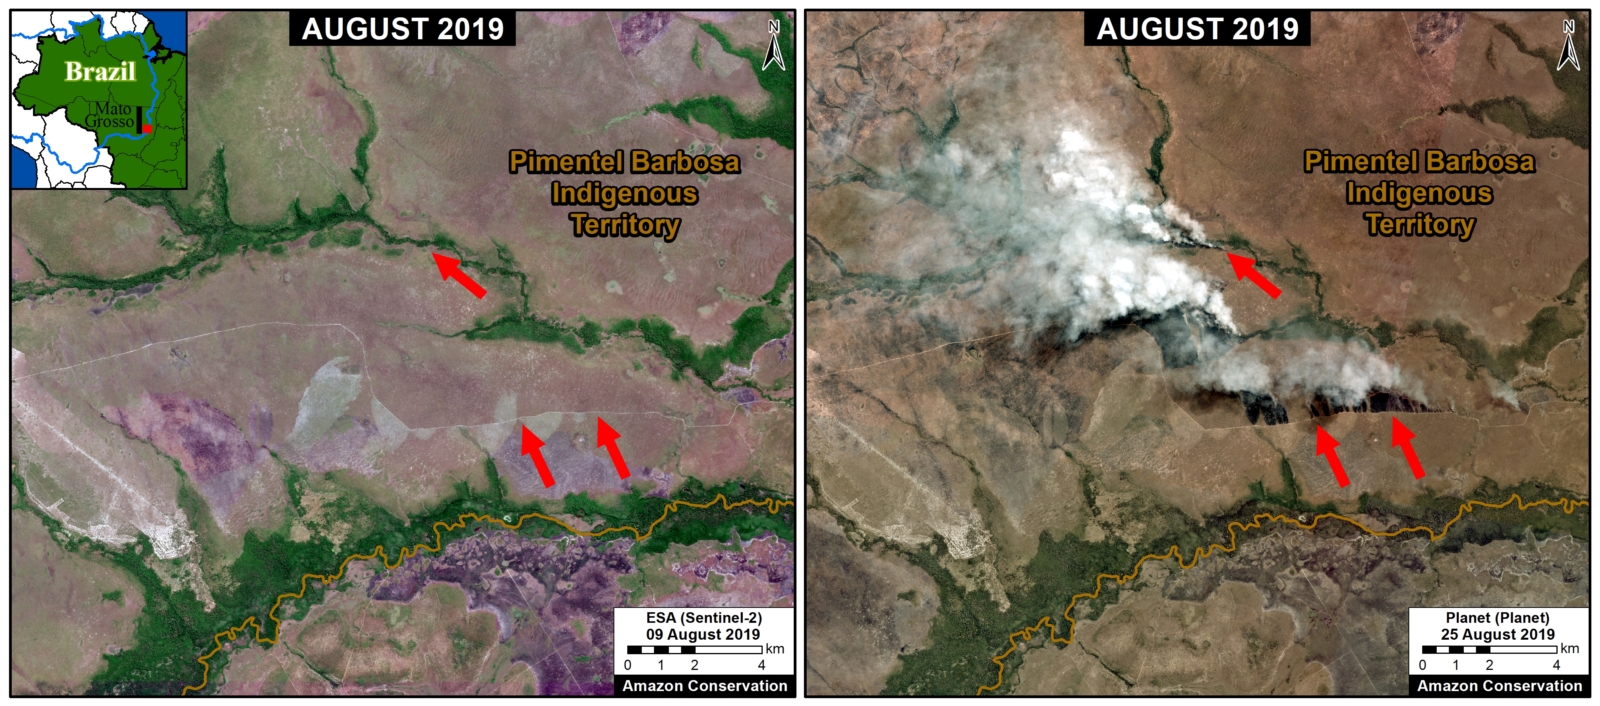
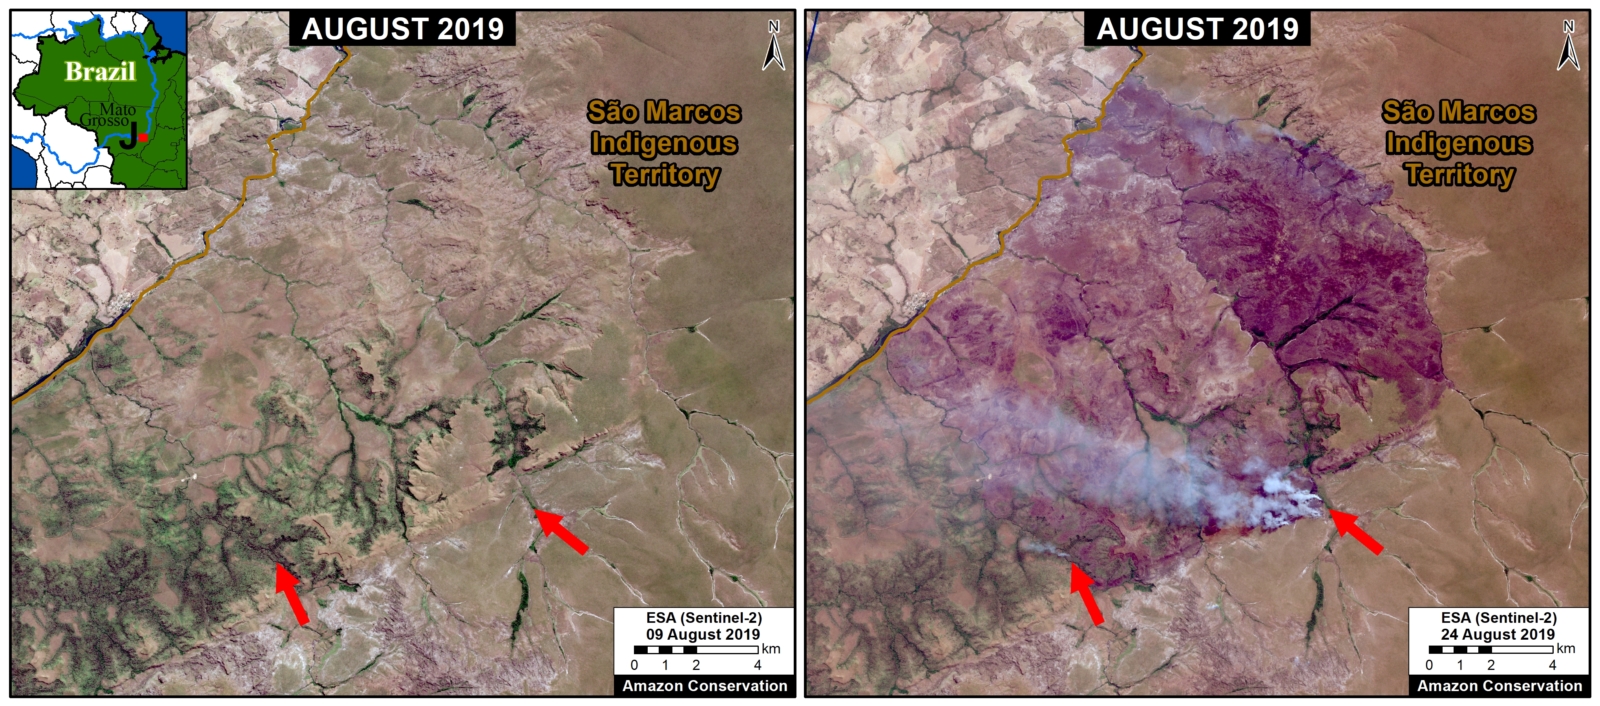
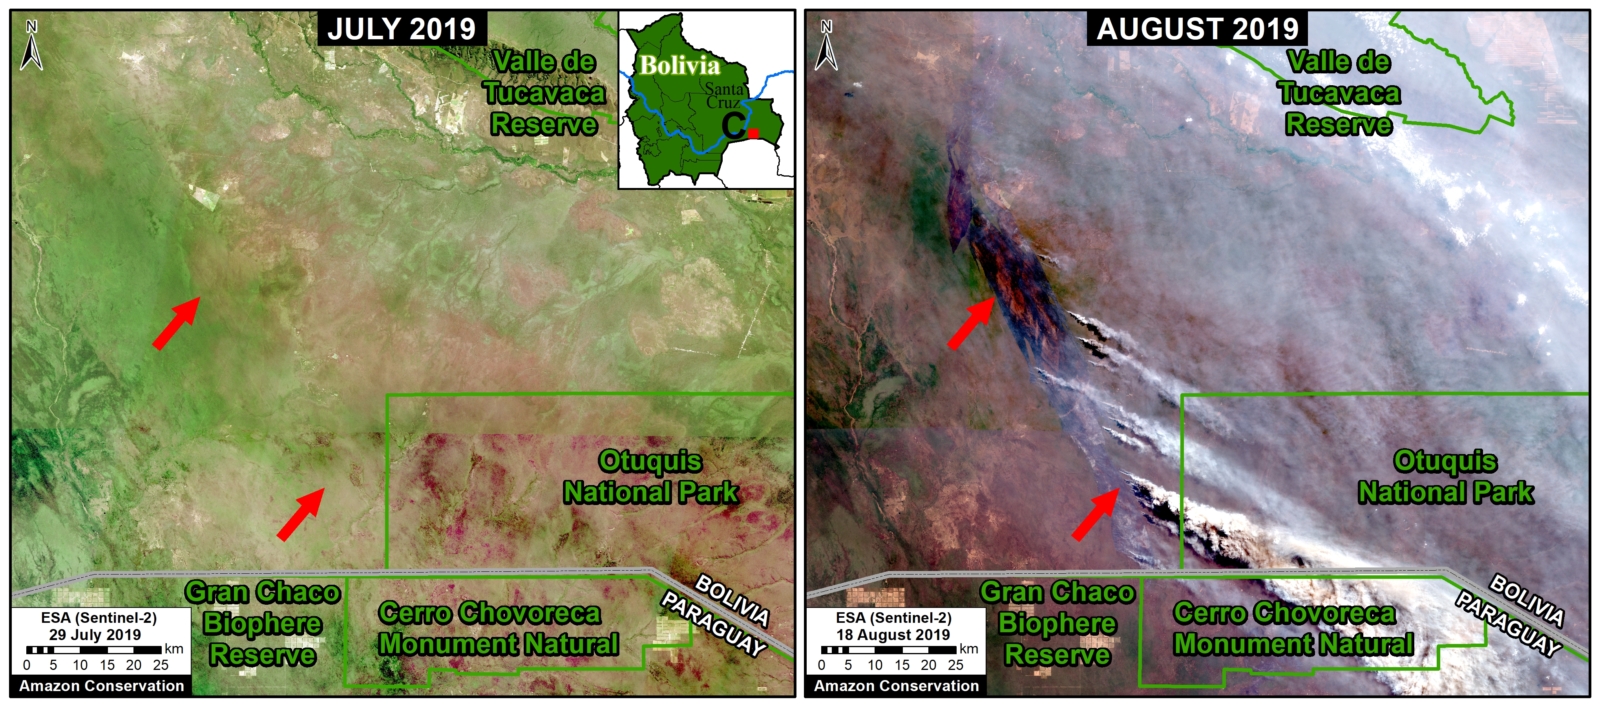
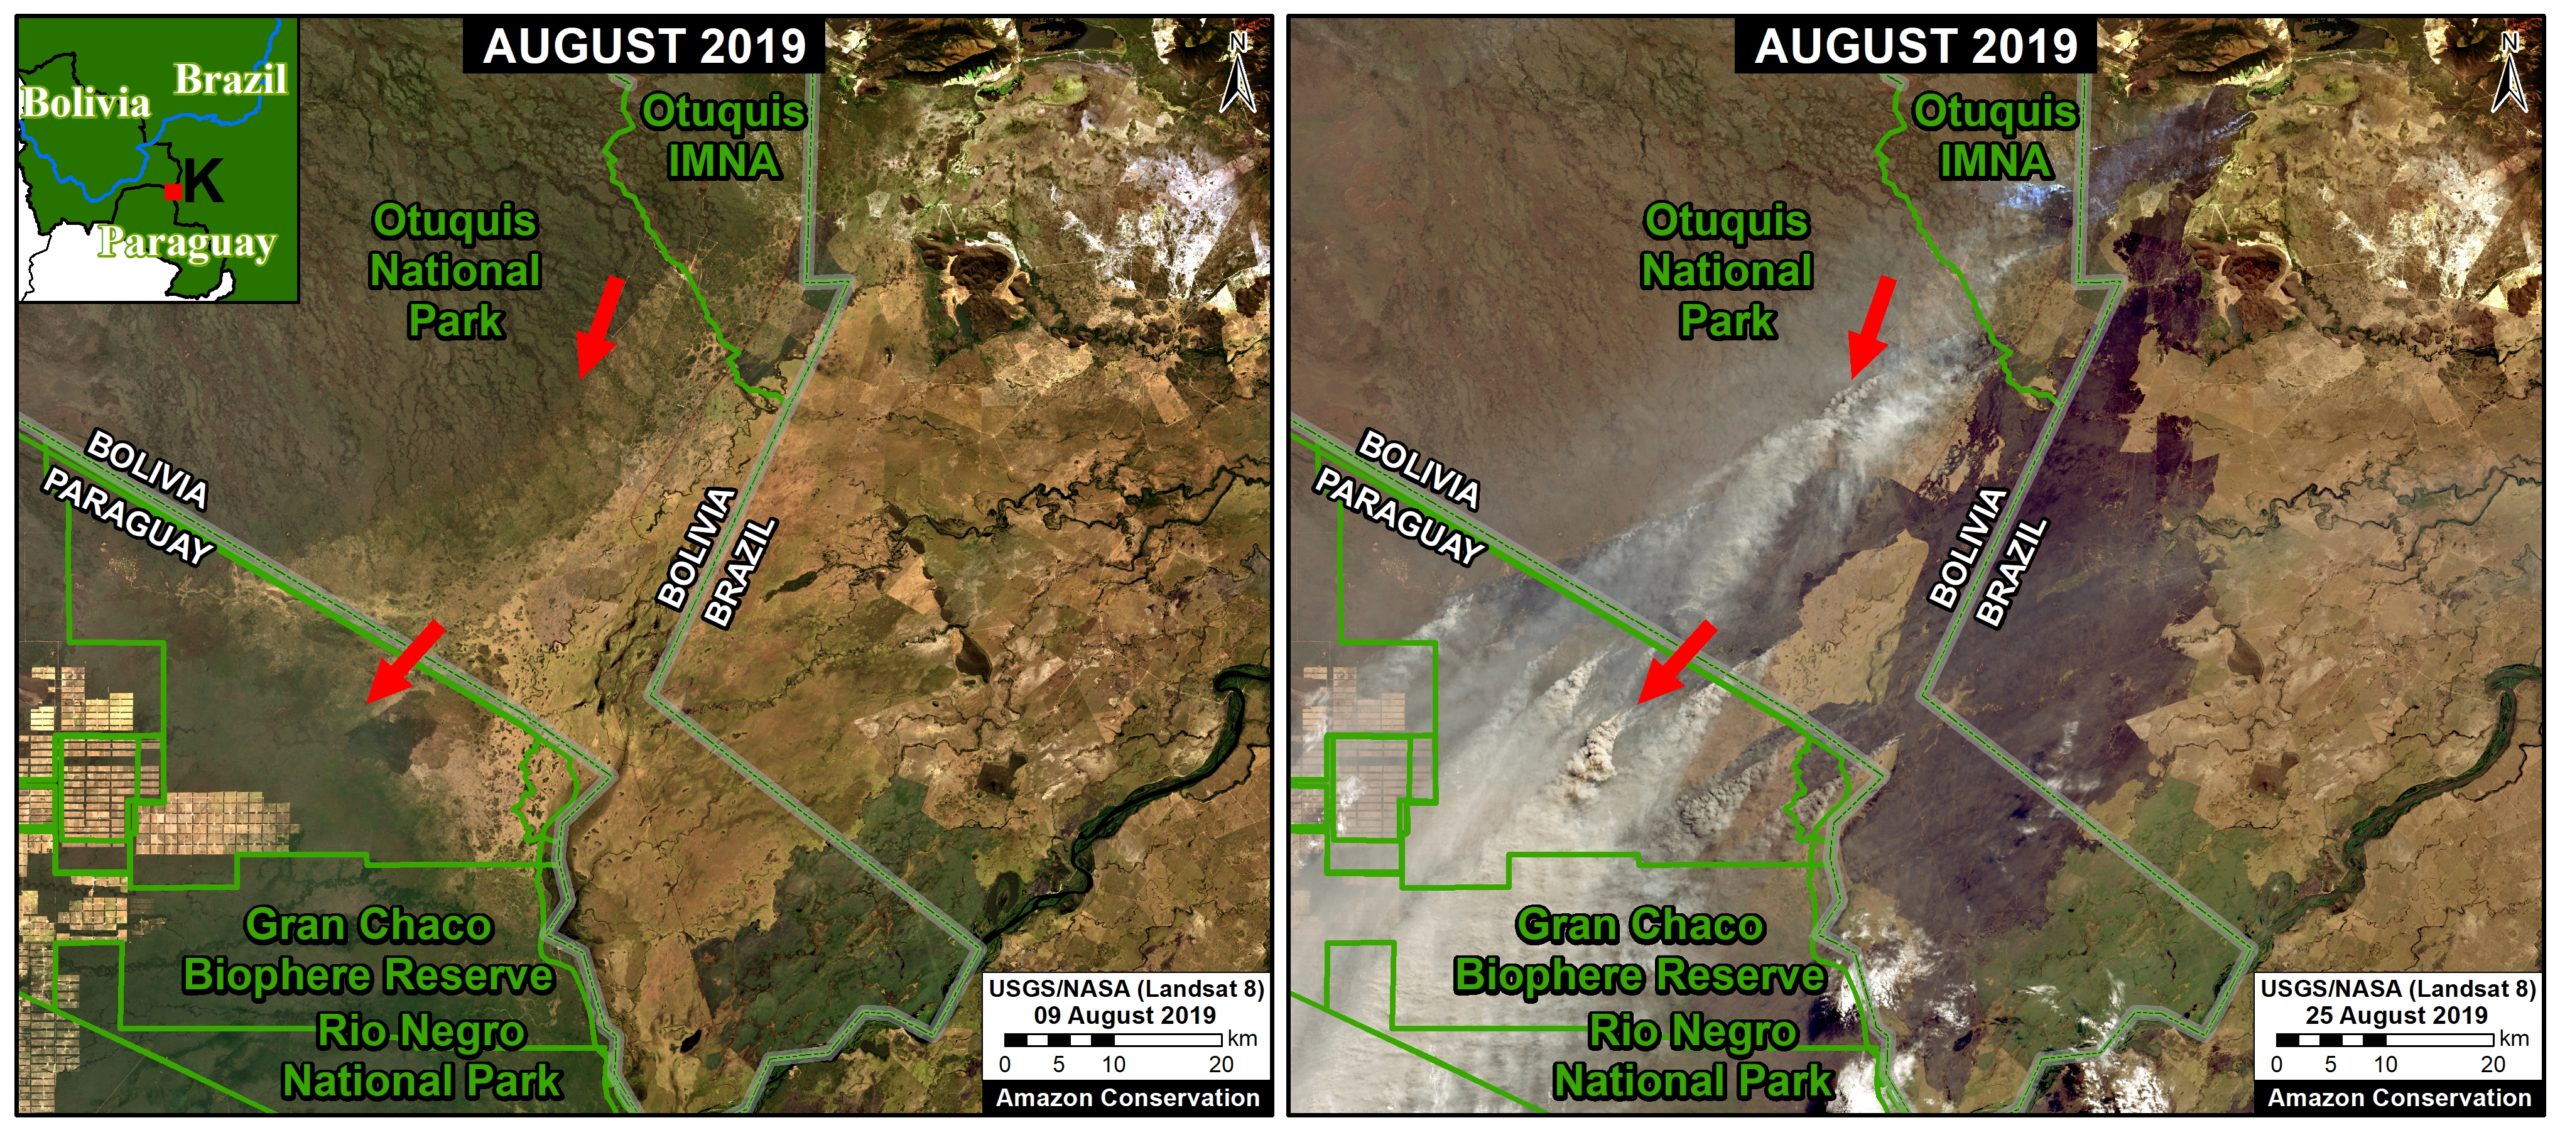
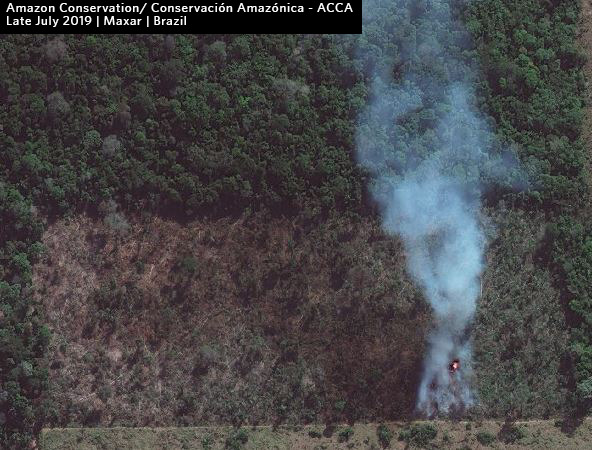
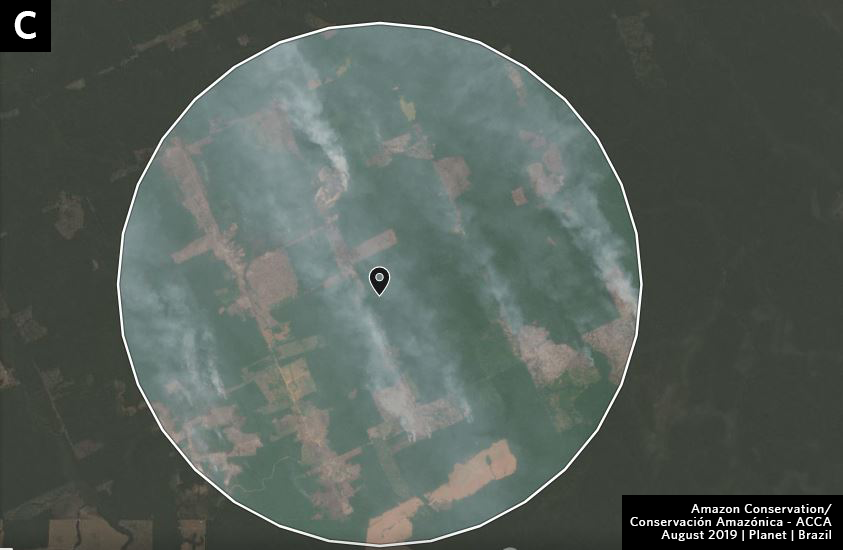
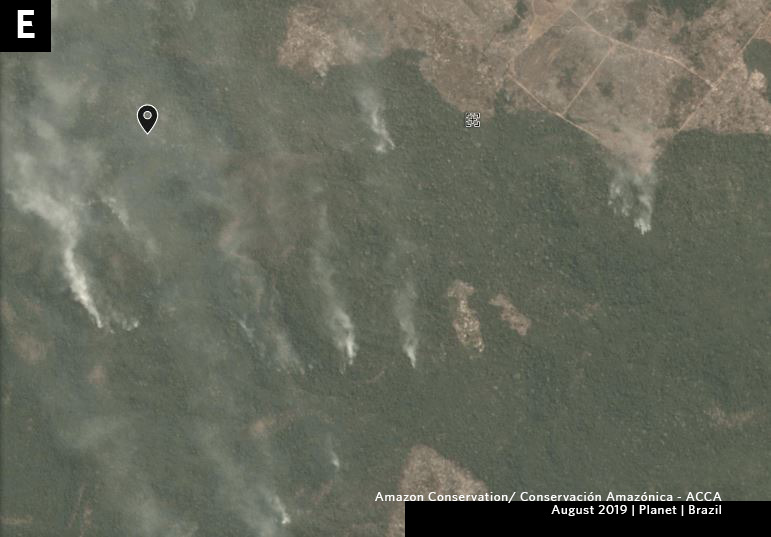
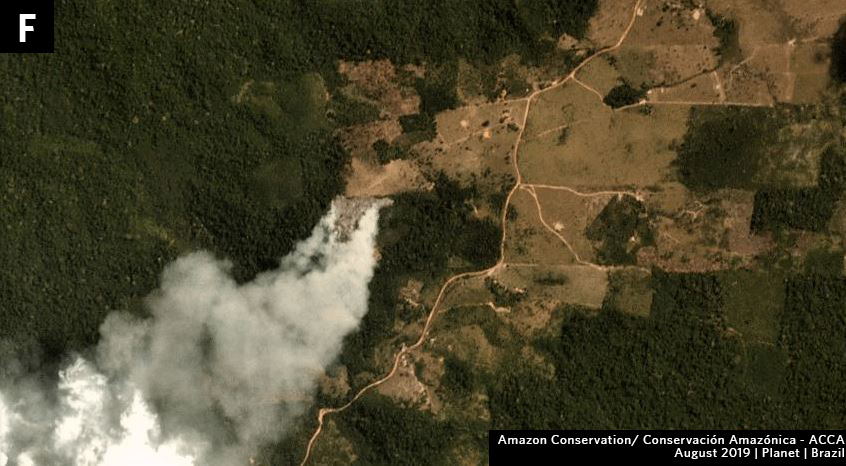
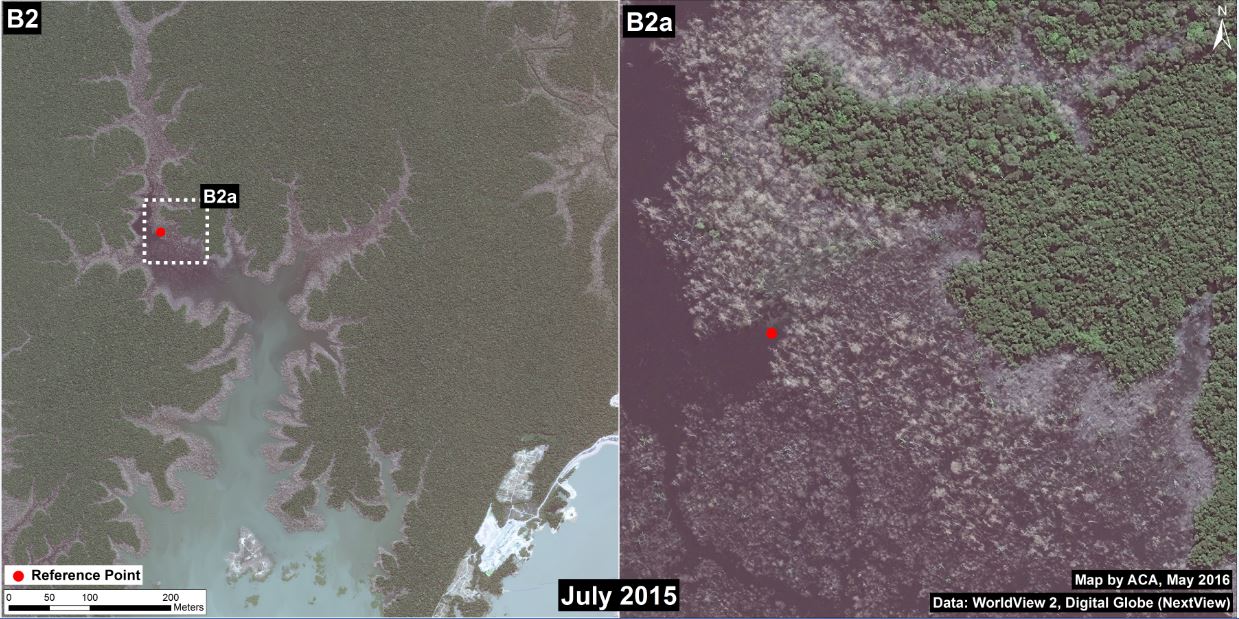
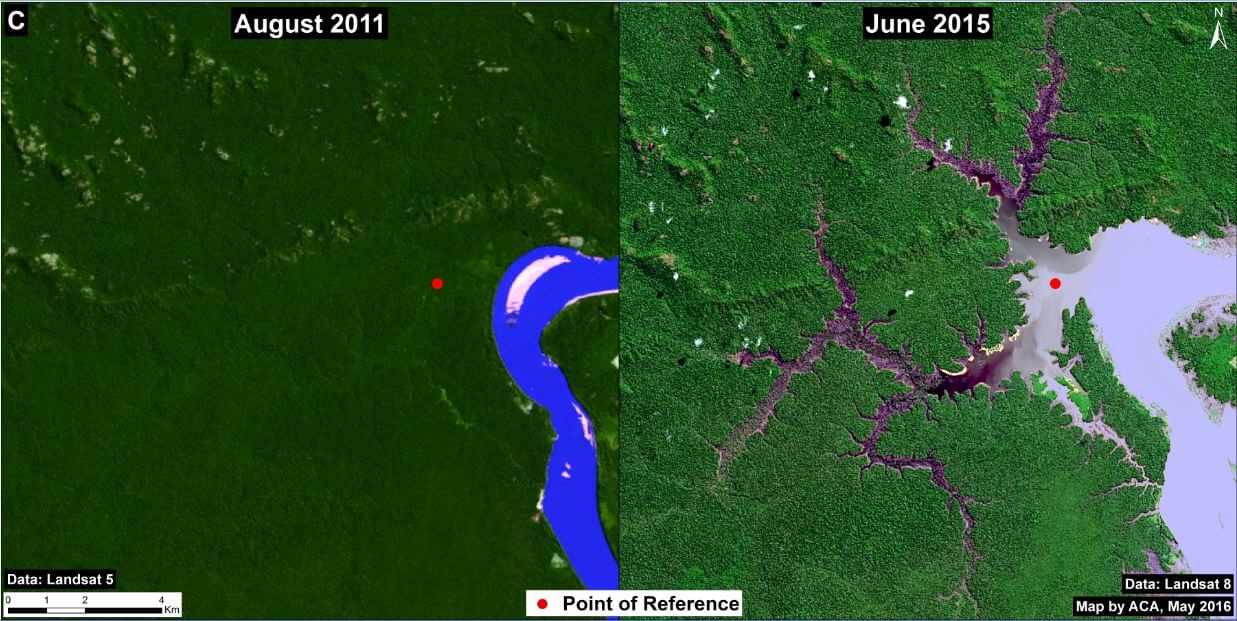
Videos C-D show 2019 fires burning primary or secondary forest surrounding recently or previously cleared areas.

*Notes

In addition to the finding of 160,400 hectares of primary forest burned in 2019, we also found: 25,800 hectares of secondary forest burned in 2019;
35,640 hectares of primary forest burned in the northern state of Roraima in March 2019 (plus an additional 16,500 hectares of secondary forest.


Methodology

Deforestation Fires

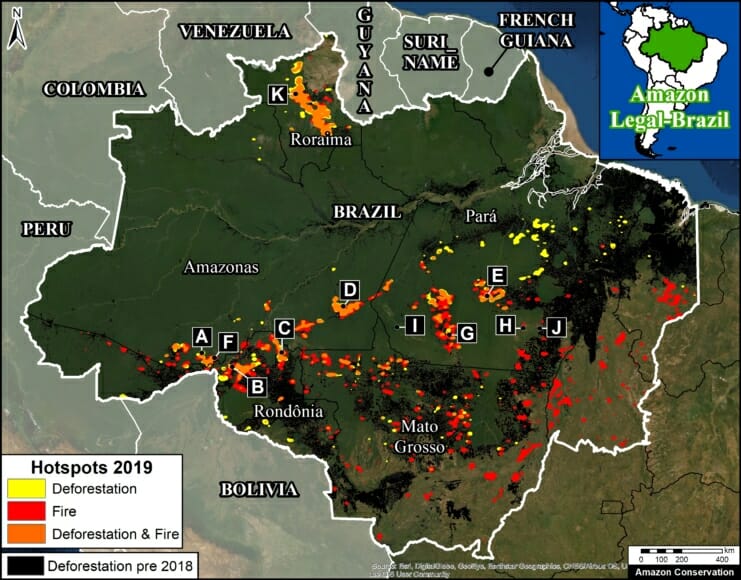
We created two “hotspots” layers, one for deforestation and the other for fires, by conducting a kernel density analysis. This type of analysis calculates the magnitude per unit area of a particular phenomenon, in this case forest loss alerts (proxy for deforestation) and temperature anomaly alerts (proxy for fires)

Specifically, we used the following data three sets:

2019 GLAD alert forest loss data (30 meter resolution) from the University of Maryland and available on Global Forest Watch.

2017 and 2018 forest loss data (30 meter resolution) from the University of Maryland and available on Global Forest Watch (4).

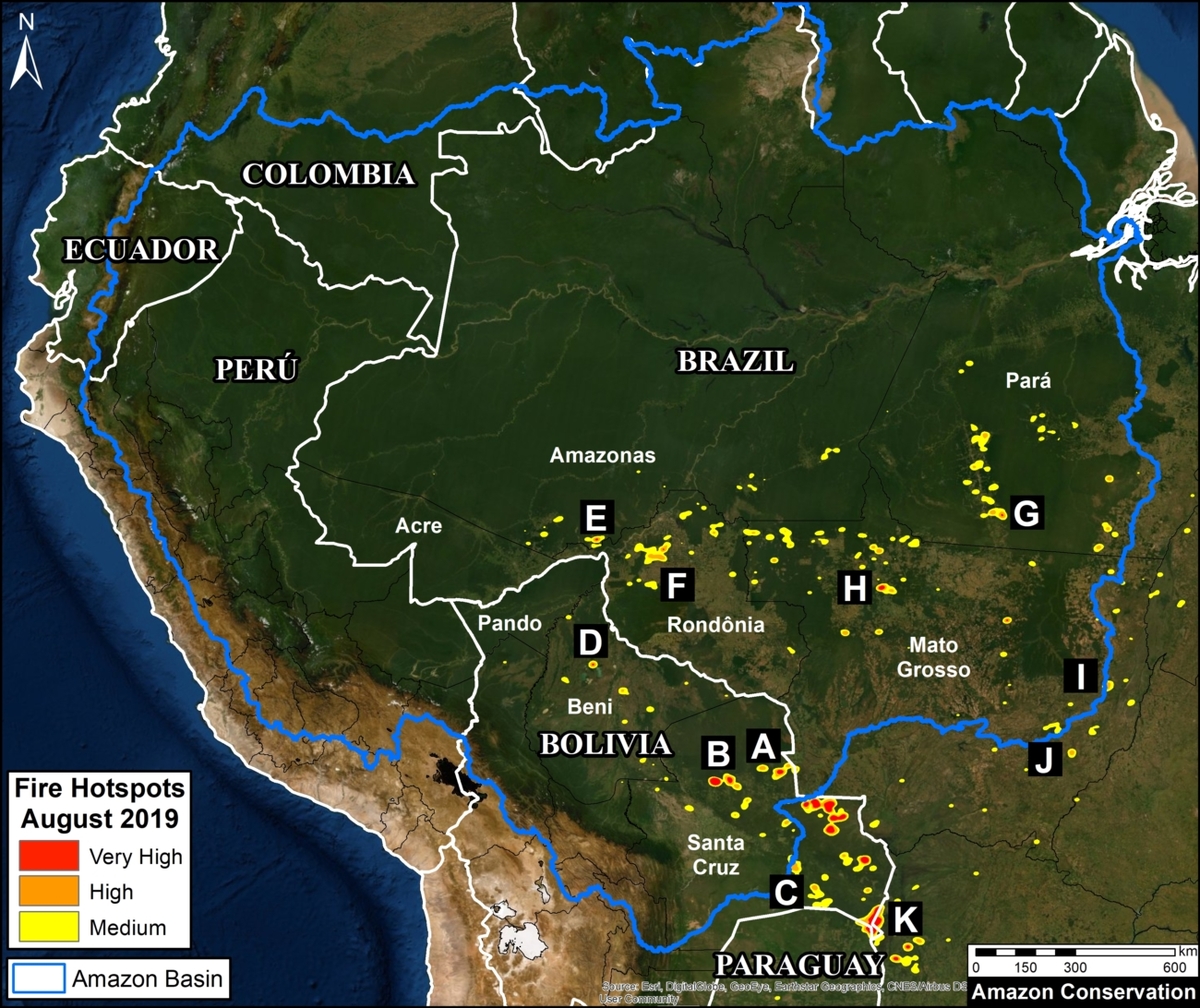
NASA’s Fire Information for Resource Management System (FIRMS) MODIS-based fire alert data (1 km resolution).

We conducted the analysis using the Kernel Density tool from Spatial Analyst Tool Box of ArcGIS, using the following parameters:

Search Radius: 15000 layer units (meters)
Kernel Density Function: Quartic kernel function
Cell Size in the map: 200 x 200 meters (4 hectares)
Everything else was left to the default setting.

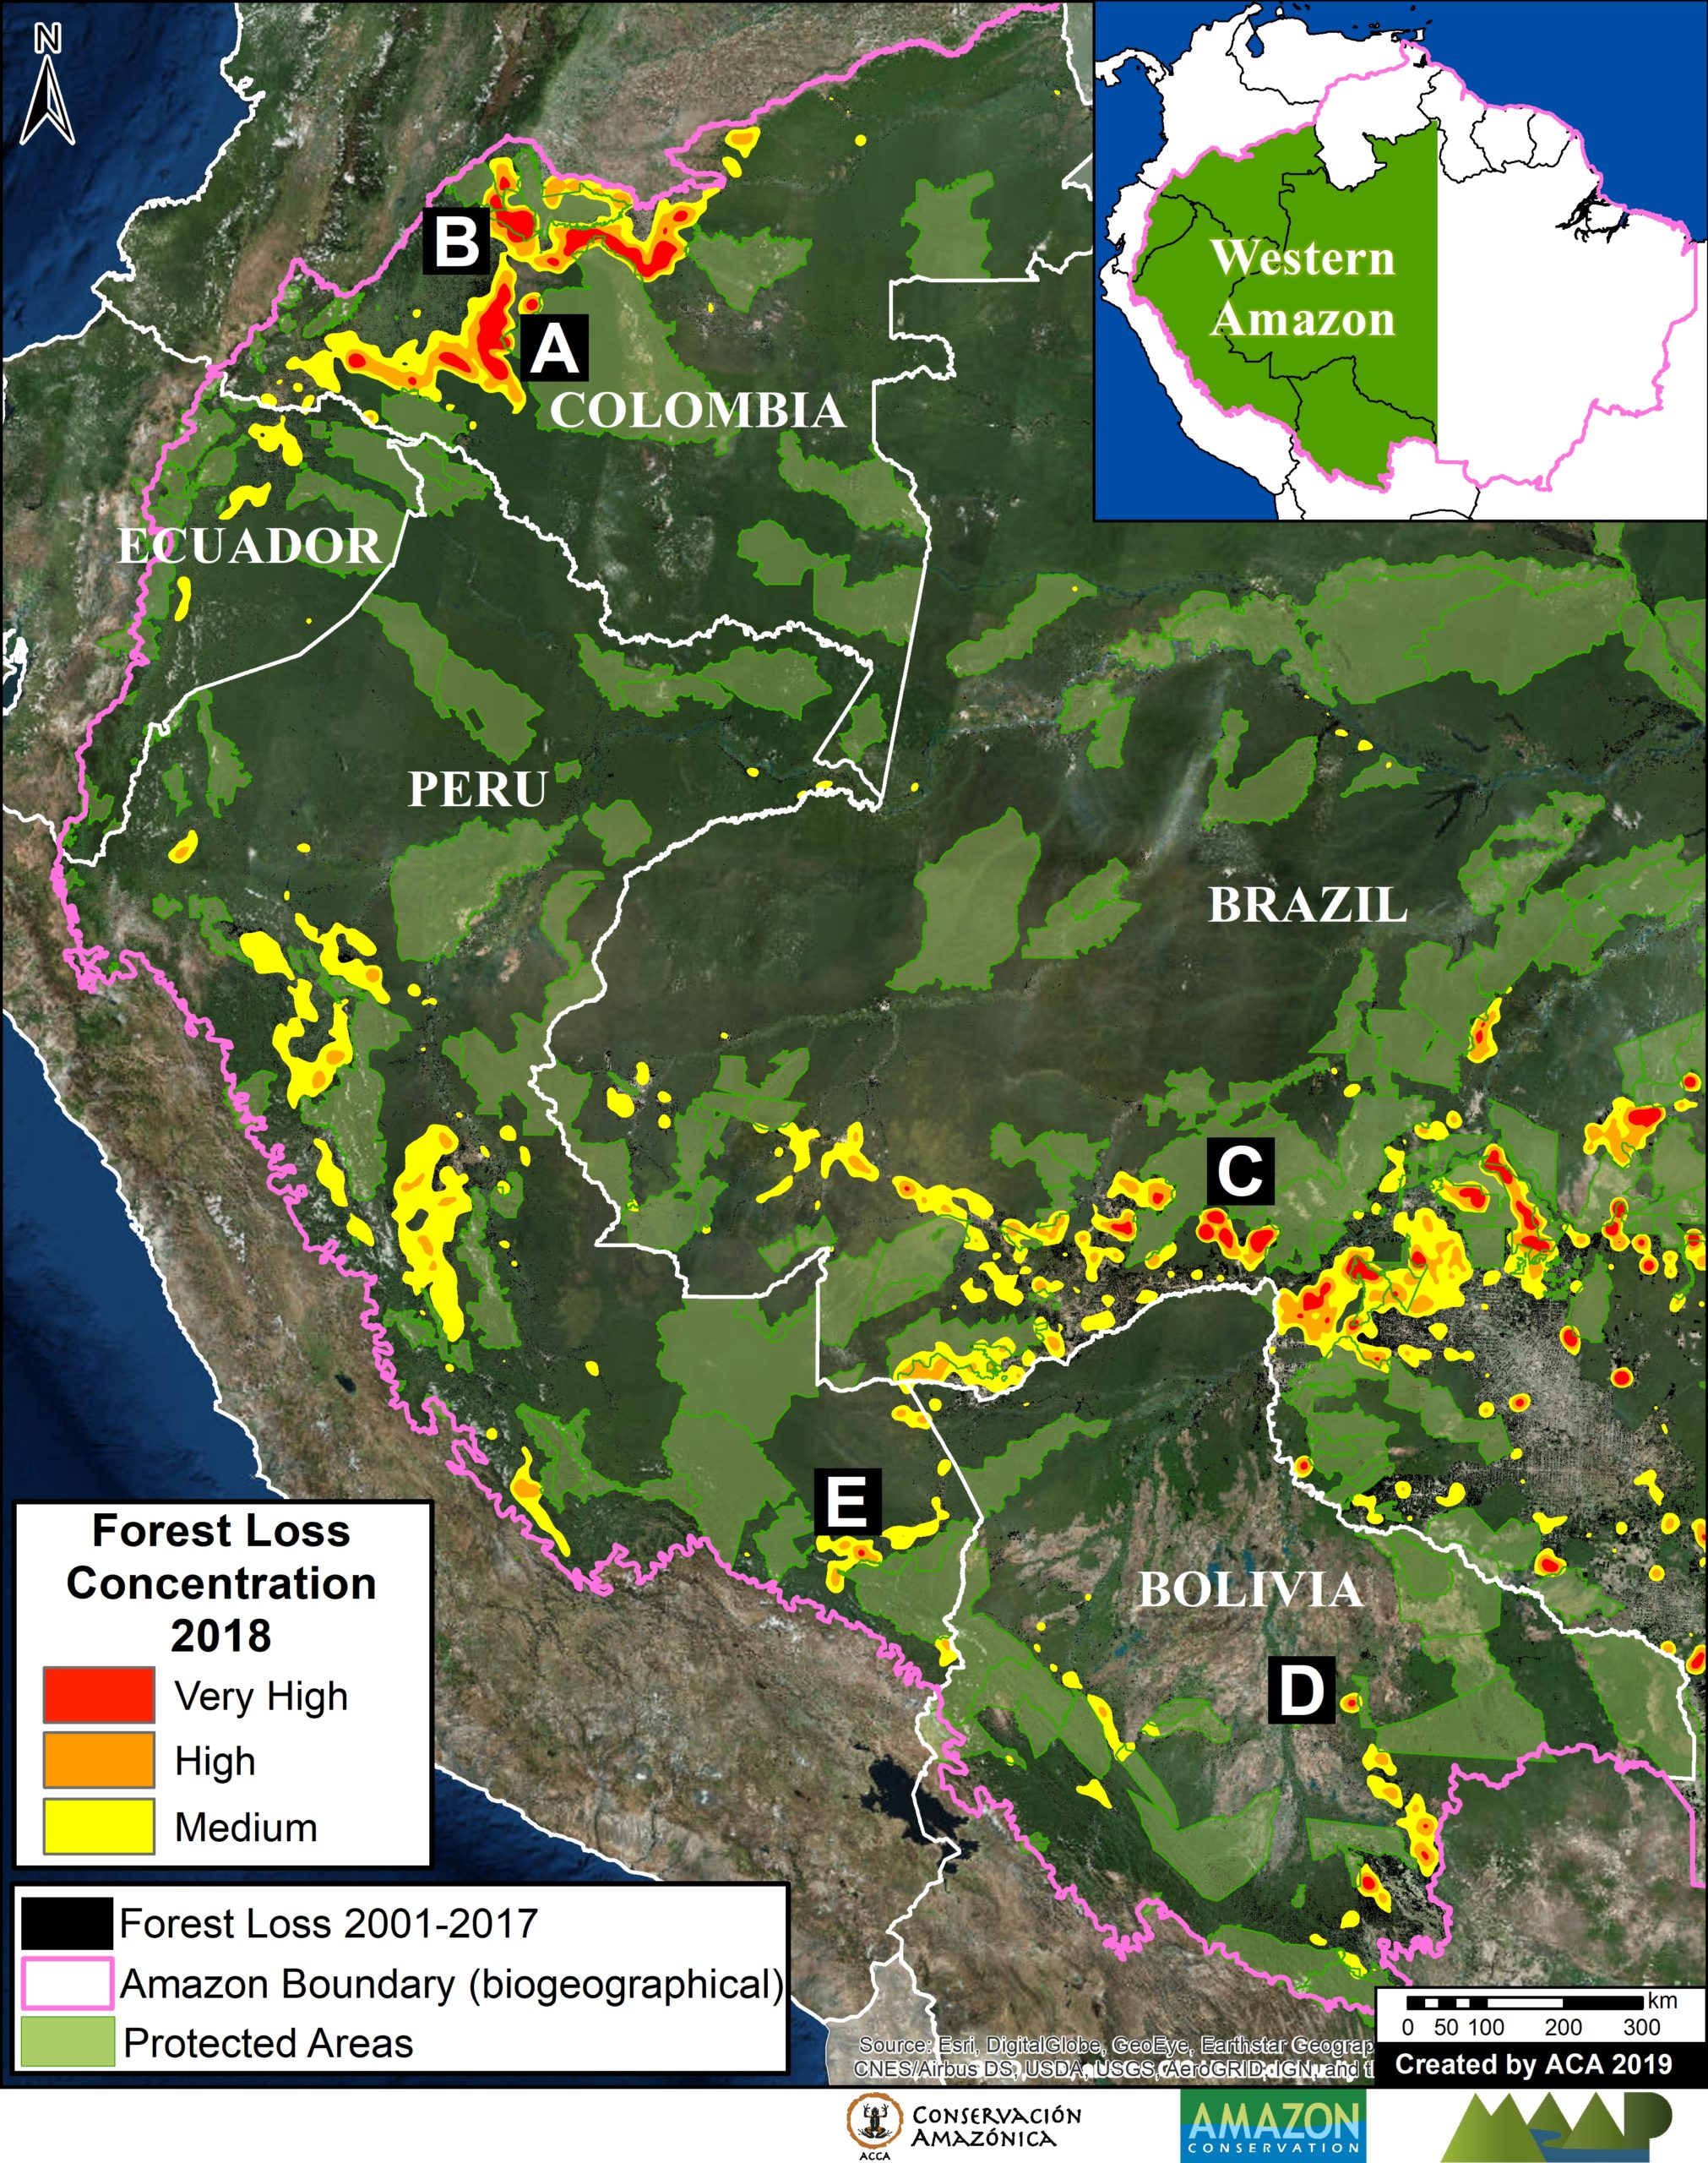
For the Base Map, we used the following concentration percentages: Medium: 10%-25%; High: 26%-50%; Very High: >50%. We then combined all three categories into one color (yellow for deforestation and red for fire). Orange indicates areas where both layers overlap. As background layer, we also included pre-2019 deforestation data from Brazil’s PRODES system.

We prioritized the orange overalp areas for further analysis. For the major orange areas in Rondônia, Amazonas, Mato Grosso, Acre, and Pará, we conducted a visual analysis using the satellite company Planet’s online portal, which includes an extensive archive of Planet, RapidEye, Sentinel-2, and Landsat data. Using the archive, we identified areas that we visually confirmed a) were deforested in 2017-19 and b) were later burned in 2019 between July and September. We then used the area measure tool to estimate the size of these areas, which ranged from large plantations ( ~1,000 hectares) to many smaller areas scattered across the focal landscape.

Forest Fires:

To estimate forests burned in 2019 we combined analysis of several datasets. First, we started with 30 meter resolution ‘burn scar’ data produced by INPE (National Institute for Space Research) DETER alerts, updated through October 2019. In order to avoid overlapping areas, we eliminated alerts previously reported from 2016 to 2018, and alerts from other land use categories (selective logging, deforestation, degradation and mining, and other). Second, we eliminated previously reported 2001-18 forest loss from University of Maryland and INPE (PRODES). Third, to distinguish burning of primary and secondary forest, we incorporated primary forest data from the University of Maryland (5).


References

  1. Krauss C, Yaffe-Bellany D, Simões M (2019) Why Amazon Fires Keep Raging 10 Years After a Deal to End Them. New York Times. https://www.nytimes.com/2019/10/10/world/americas/amazon-fires-brazil-cattle.html
  2. Kelly M, Cahlan S (2019) The Brazilian Amazon is still burning. Who is responsible? Washington Post. https://www.washingtonpost.com/politics/2019/10/07/brazilian-amazon-is-still-burning-who-is-responsible/#click=https://t.co/q2XkSQWQ77
  3. Al Jazeera (2019) See How Beef Is Destroying The Amazon. https://www.youtube.com/watch?v=9o2M_KL8X6g&feature=youtu.be
  4. Hansen, M. C., P. V. Potapov, R. Moore, M. Hancher, S. A. Turubanova, A. Tyukavina, D. Thau, S. V. Stehman, S. J. Goetz, T. R. Loveland, A. Kommareddy, A. Egorov, L. Chini, C. O. Justice, and J. R. G. Townshend. 2013. “High-Resolution Global Maps of 21st-Century Forest Cover Change.” Science 342 (15 November): 850–53.
  5. Turubanova S., Potapov P., Tyukavina, A., and Hansen M. (2018) Ongoing primary forest loss in Brazil, Democratic Republic of the Congo, and Indonesia. Environmental Research Letters https://doi.org/10.1088/1748-9326/aacd1c 


Acknowledgements

This work was supported by the following major funders: MacArthur Foundation, International Conservation Fund of Canada (ICFC), Norwegian Agency for Development Cooperation (NORAD), Metabolic Studio, and Global Forest Watch Small Grants Fund (WRI).

Citation

Finer M, Mamani N (2019) Satellites Reveal what Fueled Brazilian Amazon Fires. MAAP: 113.

MAAP #110: Major Finding – Many Brazilian Amazon Fires Follow 2019 Deforestation

In MAAP #109 we reported a major finding critical to understanding this year’s fires in the Brazilian Amazon: many of the 2019 fires followed 2019 deforestation events.

Here, we present our more comprehensive estimate: 125,000 hectares (310,000 acres) deforested in 2019 and then later burned in 2019 (July-September). This is equivalent to 172,000 soccer fields.*

Thus, the issue is both deforestation AND fire; the fires are often a lagging indicator of recent agricultural deforestation.

This key finding flips the widely reported assumption that the fires are burning intact rainforests for crops and cattle.

Instead, we find it’s the other way around, the forests were cut and then burned, presumably to enrich the soils. It is “slash and burn” agriculture, not “burn and slash.”

The policy implications are important: national and international focus needs to be on minimizing new deforestation, in addition to fire prevention and management.

This breakthrough data is based on our analysis of an extensive satellite imagery archive, allowing us to visually confirm areas that were deforested in 2019 and later burned in 2019 (see Methodology).

Below we present a new series of 7 striking timelapse videos that vividly show examples of 2019 deforestation followed by fires (See Base Map below for exact zoom locations).

MAAP #109: Fires and Deforestation in The Brazilian Amazon, 2019

Base Map. 2019 deforestation and fire hotspots in the Brazilian Amazon. Data: UMD/GLAD, NASA (MODIS), PRODES

The fires in the Brazilian Amazon have been the subject of intense global attention over the past month.

As part of our ongoing coverage, we go a step further and analyze the relationship between fire and deforestation in 2019.

First, we present the first known Base Map showing both 2019 deforestation and fire hotspots, and, importantly, the areas of overlap. The letters correspond to Zooms below.

Second, we present a series of 16 high-resolution timelapse videos (Zooms A-K), courtesy of the satellite company Planet. They show five scenarios that we have documented thus far in 2019:

  1. Deforestation (No Fire)
  2. Deforestation (Followed by Fire)
  3. Agriculture Fire
  4. Savanna Fire
  5. Forest Fire

The key finding is that Deforestation (Followed by Fire) is critically important to understanding this year’s fire season (see Zooms B-E).

We documented numerous cases of 2019 deforestation events followed by intense fires, covering at least 52,500 hectares (130,000 acres) and counting. That is equivalent to 72,000 soccer fields.

The other common scenario is Agriculture Fire in areas cleared prior to 2019, but close to surrounding forest (see Zooms F and G).

We are also now seeing more examples of Savanna Fire in grassland areas among the rainforest. These fires can be large — we show a 24,000 hectare burn (60,000 acres) in Kayapó indigenous territory (see Zoom H).

We did not observe major Forest Fires in the moist Brazilian Amazon during August, but we did document such fires in early March in Roraima state. As the dry season continues into September and October, however, forest fires become a greater risk.

MAAP #108: Understanding The Amazon Fires With Satellites, Part 2

Base Map. Updated Amazon fire hotspots map, August 20-26, 2019. Red, Orange, and Yellow indicate the highest concentrations of fire, as detected by NASA satellites that detect fires at 375 meter resolution. Data. VIIRS/NASA, MAAP.

Here we present an updated analysis on the Amazon fires, as part of our ongoing coverage and building off what we reported in MAAP #107.

First, we show an updated Base Map of the “fire hotspots” across the Amazon, based on very recent fire alerts (August 20-26). Hotspots (shown in red, orange, and yellow) indicate the highest concentrations of fire as detected by NASA satellites.

Our key findings include:

– The major fires do NOT appear to be in the northern and central Brazilian Amazon characterized by tall moist forest (Rondônia, Acre, Amazonas, Pará states),* but in the drier southern Amazon of Brazil and Bolivia characterized by dry forest and shrubland (Mato Grosso and Santa Cruz).

– The most intense fires are actually to the south of the Amazon, along the border of Bolivia and Paraguay, in areas characterized by drier ecosystems.

– Most of the fires in the Brazilian Amazon appear to be associated with agricultural lands. Fires at the agriculture-forest boundary may be expanding plantations or escaping into forest, including indigenous territories and protected areas.

– The large number of agriculture-related fires in Brazil highlights a critical point: much of the eastern Amazon has been transformed into a massive agricultural landscape over the past several decades. The fires are a lagging indicator of massive previous deforestation.

– We continue to warn against using satellite-based fire detection data alone as a measure of impact to Amazonian forests. Many of the detected fires are in agricultural areas that were once forest, but don’t currently represent forest fires.

In conclusion, the classic image of wildfires scorching everything in their path are currently more accurate for the unique and biodiverse dry forests of the southern Amazon then the moist forests to the north. However, the numerous fires at the agriculture-moist forest boundary are both a threat and stark reminder of how much forest has been, and continues to be, lost by deforestation.

Next, we show a series of 11 satellite images that show what the fires look like in major hotspots and how they are impacting Amazonian forests. The location of each image corresponds to the letters (A-K) on the Base Map.

*If anyone has detailed information to the contrary, please send spatial coordinates to maap@amazonconservation.org

Zooms A, B: Chiquitano Dry Forest (Bolivia)

Some of the most intense fires are concentrated in the dry Chiquitano of southern Bolivia. The Chiquitano is part of the largest tropical dry forest in the world and is a unique, high biodiversity, and poorly explored Amazonian ecosystem. Zooms A-C illustrate fires in the Chiquitano between August 18-21 of this year, likely burning a mixture of dry forest, scrubland, and grassland.

Zoom A. Recent fires in the dry Chiquitano of southern Bolivia. Data- Planet

Zoom B. Recent fires in the dry Chiquitano of southern Bolivia. Data- Planet.

Zoom D: Beni Grasslands (Bolivia)

Zoom D. Recent fires and burned areas in Bolivia’s Beni grasslands. Data- ESA

Zooms E,F,G,H: Brazilian Amazon (Amazonas, Rondônia, Pará, Mato Grosso)

Zoom E-H take us to moist forest forests of the Brazilian Amazon, where much of the media and social media attention has been focused. All fires we have seen in this area are in agricultural fields or at the agriculture-forest boundary. Note Zoom E is just outside a national park in Amazonas state; Zoom F shows fires at the agriculture-forest boundary in Rondônia state; Zoom G shows fires at the agriculture-forest boundary within a protected area in Pará state; and Zoom H shows fires at the agriculture-forest boundary in Mato Grosso state.

Zoom E. Fires at the agriculture-forest boundary outside a national park in Amazonas state. Data- Planet
Zoom F. Fires at the agriculture-forest boundary in Rondônia state. Data- ESA


Zoom G. Fires at the agriculture-forest boundary within a protected area in Pará state


Zoom H. Fires at the agriculture-forest boundary in Mato Grosso. Data- ESA

Zooms I, J: Southern Mato Grosso (Brazil)

Zooms I and J shows fires in grassland/scrubland at the drier southern edge of the Amazon Basin. Note both of these fires are within Indigenous Territories.

Zoom I. Fires within an Indigenous Territory at the drier southern edge of the Amazon Basin. Data- Planet
Zoom J. Fires within an Indigenous Territory at the drier southern edge of the Amazon Basin. Data- Planet

Zooms C, K: Bolivia/Brazil/Paraguay Border

Zooms C and K show large fires burning in the drier ecosytems at the Bolivia-Brazil-Paraguay border. This area is outside the Amazon Basin, but we include it due it’s magnitude.

Zoom C. Recent fires in the dry Chiquitano of southern Bolivia. Data- Planet
Zoom K. Large fires burning around the Gran Chaco Biosphere Reserve. Data- NASA:USGS.

Acknowledgements

We thank  J. Beavers (ACA), A. Folhadella (ACA), M. Silman (WFU), S. Novoa (ACCA), M. Terán (ACEAA), and D. Larrea (ACEAA) for helpful comments to earlier versions of this report.

This work was supported by the following major funders: MacArthur Foundation, International Conservation Fund of Canada (ICFC), Metabolic Studio, and Global Forest Watch Small Grants Fund (WRI).

Citation

Finer M, Mamani N (2019) Seeing the Amazon Fires with Satellites. MAAP: 108.

MAAP #107: Seeing The Amazon Fires With Satellites

Recent fire (late July 2019) in the Brazilian Amazon. Data: Maxar.

Fires now burning in the Amazon, particularly Brazil and Bolivia, have become headline news and a viral topic on social media.

Yet little information exists on the impact on the Amazon rainforest itself, as many of the detected fires originate in or near agricultural lands.

Here, we advance the discussion on the impact of the fires by presenting the first Base Map of current “fire hotspots” across three countries (Bolivia, Brazil, and Peru). We also present a striking series of satellite images that show what the fires look like in each hotspot and how they are impacting Amazonian forests. Our focus is on the most recent fires in August 2019.

Our key findings include:

  • Fires are burning Amazonian forest in BoliviaBrazil, and Peru.
    .
  • The fires in Bolivia are concentrated in the dry Chiquitano forests in the southern Amazon.
    .
  • The fires in Brazil are much more scattered and widespread, often associated with agricultural lands. Thus, we warn against using fire detection data alone as a measure of impact as many are clearing fields. However, many of the fires are at the agriculture-forest boundary and maybe expanding plantations or escaping into forest.
    .
  • Although not as severe, we also detected fires burning forest in southern Peru, in an area that has become a deforestation hotspot along the Interoceanic Highway.

Given the nature of the fires in Bolivia and Brazil, estimates of total burned forest area are still difficult to determine. We will continue monitoring and reporting on the situation over the coming days.

Base Map

The Base Map shows “fire hotspots” for the Amazonian regions of Bolivia, Brazil, and Peru in August 2019. The data comes from a NASA satellite that detects fires at 375 meter resolution. The letters (A-G) correlate to the satellite image zooms below.

Base Map. Fire Hotspots in the Amazon during August 2019. Data- VIIRS:NASA.

Zoom A: Southern Bolivian Amazon

Fires are concentrated in the dry Chiquitano of southern Bolivia. It is part of the largest tropical dry forest in the world. The fires coincide with areas that have been part of cattle ranching expansion in recent decades (References 1 and 2), suggesting that poor burning practices could be the cause of the fires. Ranching using sown pastures has previously been referred to as a direct cause of forest loss in Bolivia (References 2 and 3). The Bolivian National Service of Meteorology and Hydrology (SENAMHI) issued high wind alerts in July and August for southern Bolivia, which could have led to the expansion of poorly managed fires. Also, August is usually the driest month of the year in this region. These conditions could explain the origin (poor fire practice) and expansion (little rain and strong winds) of the current fires.

Zoom A1. Fire in southern Bolivian Amazon. Data- ESA
Zoom A2. Fire in southern Bolivian Amazon. Data- ESA
Zoom A3. Fire in southern Bolivian Amazon. Data- Planet

Zooms B, C, E, F, G: Western Brazilian Amazon

The major fires in western Brazil seem to be at the agriculture-forest boundary. Note that Zoom B shows fire in a protected area in Amazonas state; Zoom C seems to show fire escaping (or deliberately set) in the primary forests in Rondonia state; and Zooms F and G seems to show fire expanding plantation into forest in Amazonas and Mato Grosso states, respectively.

Zoom B. Fire in a protected area in Amazonas state. Data- ESA
Zoom C. Fires at agriculture-forest boundary in Rondonia state. Data- Sentinel
Zoom E. Fire escaping (or deliberately set) in the primary forests in Rondonia state. Data- Planet
Zoom F. Fire that seems to be expanding plantation into forest in Amazonas state. Data- Planet.
Zoom G. Fire that seems to be expanding plantation into forest in Mato Grosso state. Data- Planet
Bonus Zoom. Recent fire in Brazilan Amazon. Data- Planet


Zoom D: Southern Peruvian Amazon

Fires burning forest near the town of Iberia, an area along the Interoceanic Highway that has become a deforestation hotspot in the region of Madre de Dios (see MAAP #28 and MAAP #47).

Zoom D. Fire in southern Peruvian Amazon (near Iberia, Madre de Dios). Data- ESA

Additional References

We have these to be some of the most informative additional references:

New York Times, Aug 24

Global Forest Watch, Aug 23

Technical References

1 Müller, R., T. Pistorius, S. Rohde, G. Gerold & P. Pacheco. 2013. Policy options to reduce deforestation based on a systematic analysis of drivers and agents in lowland Bolivia. Land Use Policy 30(1): 895-907. http://dx.doi.org/10.1016/j. landusepol.2012.06.019

Muller, R., Larrea-Alcázar, D.M., Cuéllar, S., Espinoza, S. 2014.  Causas directas de la deforestación reciente (2000-2010) y modelado de dos escenarios futuros  en las tierras bajas de Bolivia. Ecología en Bolivia 49: 20-34.

Müller, R., P. Pacheco & J. C. Montero. 2014. El contexto de la deforestación y degradación de los bosques en Bolivia: Causas, actores e instituciones. Documentos Ocasionales CIFOR 100, Bogor. 89 p.

Acknowledgements

We thank  J. Beavers, D. Larrea, T. Souto, M. Silman, A. Condor, and G. Palacios for helpful comments to earlier versions of this report.

This work was supported by the following major funders: MacArthur Foundation, International Conservation Fund of Canada (ICFC), Metabolic Studio, and Global Forest Watch Small Grants Fund (WRI).

Citation

Novoa S, Finer M (2019) Seeing the Amazon Fires with Satellites. MAAP: 107.

MAAP #100: Western Amazon – Deforestation Hotspots 2018 (A Regional Perspective)

For the 100th MAAP report, we present our first large-scale western Amazon analysis: Colombia, Peru, Ecuador, Bolivia, and western Brazil (see Base Map).

We use the new 2018 data for forest cover loss, generated by the  University of Maryland (Hansen et al 2013) and presented by Global Forest Watch.

These data indicate 2.5 million acres of forest cover loss in the western Amazon in 2018.*

We conducted an additional analysis that indicates, of this total, 1.9 million acres were primary forest.*

Base Map. Deforestation Hotspots in the western Amazon. Data: Hansen/UMD/Google/USGS/NASA, GFW, SERNANP, SNAP, SINAP, SERNAP, RAISG

To identify deforestation hotspots consistently across this vast landscape, we conducted a kernel density analysis (see Methodology).

The Base Map shows the hotspots in yellow, orange and red, indicating areas with medium, high, and very high forest loss concentrations, respectively.

Next, we focus on five zones of interest (Zooms A-E) in Colombia, Brazil, Bolivia, and Peru. For all images, please click to enlarge.

*Forest Cover Loss: 5 acres per minute. Almost half (49%) occurred in Brazil, followed by Peru (20%), Colombia (20%), Bolivia (8%), and Ecuador (3%). see Annex.

**Primary Forest Loss: 3.5 acres per minute. Over half (53%) occurred in Brazil, followed by Peru (20%), Colombia (18%), Bolivia (7%), and Ecuador (2%). see Annex.


Colombia

The largest concentration of 2018 forest loss is in the northeast Colombian Amazon (494,000 acres). Out of this total, 11% (56,800 acres) occurred in national parks. National experts indicate that land grabbing has emerged as a leading direct driver of deforestation (Arenas 2018). See MAAP #97 for more information.

Zoom A shows the forest loss expanding towards western Chiribiquete National Park, including distinct deforestation in this protected area during 2018.

Zoom B shows the extensive 2018 deforestation (30,000 acres) within Tinigua National Park. A recent news report indicates that cattle ranching is one of the factors related to this deforestation.

Zoom A. Colombia-Chiribiquete. Data: Hansen/UMD/Google/USGS/NASA, SINAP, Planet, ESA
Zoom B. Colombia – Tinigua. Data: Hansen/UMD/Google/USGS/NASA, SINAP, Planet, ESA


Brazil (border with Bolivia)

Another important result is the contrast between northern Bolivia (Pando department) and adjacent side Brazil (states of Acre, Amazonas, and Rondônia). Zoom C shows several deforestation hotspots on the Brazilian side, while the Bolivian side is much more intact.

Zoom C. Brazil, Bolivia border. Data: Hansen/UMD/Google/USGS/NASA, ESA, RAISG


Bolivia

In Bolivia, the major forest loss hotspots are further south. Zoom D shows the recent deforestation (5,000 acres in 2018) due to agricultural activity associated with one of the first major Mennonite settlements in Beni department (Kopp 2015). The other Mennonite settlements are located further south.

Zoom D. Bolivia, Black River Mennonite settlement. Data: Hansen/UMD/Google/USGS/NASA, SERNAP, Planet

Peru

The Hansen data indicates over 200,000 acres of forest loss during 2018 in the Peruvian Amazon. One of the most important deforestation drivers, especially in southern Peru, is gold mining. We estimate 23,000 acres of gold mining deforestation during 2018 in the southern Peruvian Amazon (see MAAP #96).

Zoom E shows the most emblematic case of gold mining deforestation: the area known as La Pampa.

It is important to emphasize, however, that in February 2019 the Peruvian government launched “Operation Mercury 2019” (Operación Mercurio 2019), a multi-sectoral and comprehensive mega-operation aimed at eradicating illegal mining and associated crime in La Pampa, as well as promote development in the region.

Zoom D. Peru – La Pampa. Data: Hansen/UMD/Google/USGS/NASA, SERNAP, Planet

Annex

Annex. Forest cover and primary forest loss in the western Amazon.  Data: Hansen/UMD/Google/USGS/NASA, Global Forest Watch.

Methods

The 2018 forest loss data presented in this report were generated by the Global Land Analysis and Discovery (GLAD) laboratory at the University of Maryland (Hansen et al 2013) and presented by Global Forest Watch. Our study area is strictly what is presented in the Base Map: the areas within the Amazonian biogeographic boundary of the western Amazon.

Specifically, for our estimate of forest cover loss, we multiplied the annual “forest cover loss” data by the density percentage of the “tree cover” from the year 2000 (values >30%).

For our estimate of primary forest loss, we intersected the forest cover loss data with the additional dataset “primary humid tropical forests” as of 2001 (Turubanova et al 2018). For more details on this part of the methodology, see the Technical Blog from Global Forest Watch (Goldman and Weisse 2019).

All data were processed under the geographical coordinate system WGS 1984. To calculate the areas in metric units the UTM (Universal Transversal Mercator) projection was used: Peru and Ecuador 18 South, Colombia 18 North, Western Brazil 19 South and Bolivia 20 South.

Lastly, to identify the deforestation hotspots, we conducted a kernel density estimate. This type of analysis calculates the magnitude per unit area of a particular phenomenon, in this case forest cover loss. We conducted this analysis using the Kernel Density tool from Spatial Analyst Tool Box of ArcGIS. We used the following parameters:

Search Radius: 15000 layer units (meters)

Kernel Density Function: Quartic kernel function

Cell Size in the map: 200 x 200 meters (4 hectares / 9.88 acres)

Everything else was left to the default setting.

For the Base Map, we used the following concentration percentages: Medium: 10%-20%; High: 21%-35%; Very High: >35%.


References

Arenas M (2018) Acaparamiento de tierras: la herencia que recibe el nuevo gobierno de Colombia. Mongabay, 2 AGOSTO 2018. https://es.mongabay.com/2018/08/acaparamiento-de-tierras-colombia-estrategias-gobierno/

Goldman L, Weisse M (2019) Technical Blog: Global Forest Watch’s 2018 Data Update Explained. https://blog.globalforestwatch.org/data-and-research/blog-tecnico-explicacion-de-la-actualizacion-de-datos-de-2018-de-global-forest-watch

Hansen, M. C., P. V. Potapov, R. Moore, M. Hancher, S. A. Turubanova, A. Tyukavina, D. Thau, S. V. Stehman, S. J. Goetz, T. R. Loveland, A. Kommareddy, A. Egorov, L. Chini, C. O. Justice, and J. R. G. Townshend. 2013. “High-Resolution Global Maps of 21st-Century Forest Cover Change.” Science 342 (15 November): 850–53. Data available on-line from: http://earthenginepartners.appspot.com/science-2013-global-forest.

Kopp Ad (2015) Las colonias menonitas en Bolivia. Tierra. http://www.ftierra.org/index.php/publicacion/libro/147-las-colonias-menonitas-en-bolivia

Planet Team (2017). Planet Application Program Interface: In Space for Life on Earth. San Francisco, CA. https://api.planet.com

Turubanova S., Potapov P., Tyukavina, A., and Hansen M. (2018) Ongoing primary forest loss in Brazil, Democratic Republic of the Congo, and Indonesia. Environmental Research Letters  https://doi.org/10.1088/1748-9326/aacd1c 


Acknowledgements

We thank M. Terán (ACEAA), M. Weisse (GFW/WRI), A. Thieme (UMD), R. Catpo (ACCA) and A. Cóndor (ACCA) for helpful comments to this report.


Citation

Finer M, Mamani N (2019) Western Amazon – Deforestation Hotspots 2018 (a regional perspective). MAAP: 100.

MAAP Interactive: Deforestation Drivers In The Andean Amazon

Since its launch in April 2015, MAAP has published over 70 reports related to deforestation (and natural forest loss) in the Andean Amazon. We have thus far focused on Peru, with several reports in Colombia and Brazil as well.

These reports are meant to be case studies of the most important and urgent deforestation events. We often use forest loss alerts (known as GLAD) to guide us, and satellite imagery (from Planet and DigitalGlobe) to identify the deforestation driver.

Here we present an interactive map highlighting the drivers identified in all published MAAP reports. These drivers include gold mining, agriculture (e.g. oil palm and cacao), cattle pasture, roads, and dams (see icon legend below map). We also include natural causes such as floods and blowdowns (fire included under agriculture since most human caused). Furthermore, we highlight deforestation events within protected areas. Note that you can filter by driver by checking boxes of interest.

We hope the result is one of the most detailed and up-todate resources on patterns and drivers of deforestation in the Andean Amazon. Over the coming year we will continue to focus on Peru and Colombia, and begin to include Ecuador and Bolivia as well.

To view the interactive map, please visit:

MAAP Interactive: Deforestation Drivers in the Andean Amazon
https://maaproject.org/interactive/

For more information on patterns and drivers of deforestation in the Peruvian Amazon, see our latest News and Resources 

MAAP #66: Satellite Images of Belo Monte Dam Project (Brazil)

Image 66a. Red circle indicates dam project area.

The Belo Monte hydroelectric dam complex, located on the Xingu River in the state of Para in the eastern Brazilian Amazon (see Image 66a), has been controversial since its inception over 15 years ago, due to both environmental and social concerns related to building and operating one of the largest dams in the world in a sensitive environment.

The dam has recently become operational, providing an opportunity to evaluate initial impacts.

The objective of this article is to present satellite imagery, including a time series from 2011 to 2017, that provides insight into major ecological impacts of the hydroelectric dam project.

Image 66b. NASA/USGS

Despite legal challenges and strong opposition from impacted indigenous groups, construction of Belo Monte began in 2011 and the first turbines became operational in early 2017. Image 66b shows a direct comparison of before (left panel, July 2011) and after (right panel, July 2017) dam construction.

The dam is in fact a complex: the main dam (red circle) on the Xingu River creates a main reservoir (blue circle); a canal diverts much (up to 80%) of the river’s flow from the main reservoir to the canal reservoir (yellow circle), which feeds the turbines generating the electricity. As a result, downstream of the main dam is left with a much reduced flow (20%) for a stretch of 100 km. This reduced flow stretch, known as the Xingu River’s “Big Bend,” is home to two indigenous peoples (Arara and Juruna). The reference points in the images show these four areas of the complex across time, including before construction.

MAAP #34: New Dams on The Madeira River in Brazil Cause Forest Flooding

The Amazon lowlands have been connected to the Andes Mountains for millions of years by only six major rivers: the Caqueta, Madeira, Maranon, Napo, Putumayo, and Ucayali* (see Image 34a). This intimate connection allows rich Andean nutrients to fuel the Amazon floodplain and enables long-distance catfish migration between feeding grounds in the lowlands and spawning grounds in the highlands.

Image 34a. Data: Esri, DigitalGlobe, GeoEye, Earthstar Geographics, CNES/Airbus DS, USDA, AEX, Getmapping, Aerogrid, IGN, IGP, swisstopo

However, one of these six major Andean tributaries has recently been dammed on its main channel: the Madeira River in western Brazil (See Inset A). The Santo Antônio dam was completed in 2011, followed by the upstream Jirau dam in 2013.

Note in Image 34a that these dams are are located downstream of the Madre de Dios River in southern Peru. Thus, major ecological impacts — such as blocking the route of migratory catfish**— are also very relevant to Peru.

Here in MAAP #34, we describe the forest loss—over 36,100 hectares—associated with the flooding caused by these two dams (with a focus on the Jirau dam).


Zoom A: Forest Loss due to Flooding

Image 34b shows the forest loss due to flooding immediately upstream of the Jirau dam. As of 2015, the total flooded area for both dams is 36,139 hectares (89,301 acres). Major flooding was first detected in 2010, rose substantially in 2011-12, and peaked in 2014.

According to Fearnside 2014, although much of the forest along the Madeira is seasonally flooded, it dies when permanently flooded.*** Therefore, the flooded area is an appropriate measure of forest loss.

Further below, we show a series of satellite images of the areas indicated by Inset B (see Images 34c-e) and Inset C (see Image 34f).

Image 34b. Flooding-related forest loss along the Upper Madeira River. Data: USGS, CLASlite, Hansen/UMD/Google/USGS/NASA.

Zoom B: Flooding Immediately Upstream Jirau Dam

Image 34c shows the flooding immediately upstream of the Jirau dam between 2011 (left panel) and 2015 (right panel). The red dot is a point of reference that indicates the same place in both images. Below, we show high-resolution images of the areas indicated by Insets B1 and B2.

Image 34c shows the flooding immediately upstream of the Jirau dam between 2011(left panel) and 2015 (right panel).

Zooms B1 and B2: Jirau Dam and Flooding

Image 34d shows a high-resolution view of the Jirau dam in July 2015. Image 34e shows a high-resolution view of a portion of the flooded area immediately upstream of the Jirau dam in August 2015. The red dot is a point of reference that indicates the same place in both panels.

Image 34d. High-resolution view of the Jirau dam. Data: WorldView-2 from Digital Globe (NextView).

Image 34e: High-resolution view of flooded area immediately upstream of the Jirau dam. Data: WorldView-2 from Digital Globe (NextView).

Zoom C: Flooding Further Upstream of Jirau Dam

Image 34f shows the flooding further upstream of the Jirau dam between 2011 (left panel) and 2015 (right panel). The red dot is a point of reference that indicates the same point in both images.

Image 34e: High-resolution view of flooded area immediately upstream of the Jirau dam. Data: WorldView-2 from Digital Globe (NextView).

References

*Finer M, Jenkins CN (2012) Proliferation of Hydroelectric Dams in the Andean Amazon and Implications for Andes-Amazon Connectivity. PLOS ONE: 7(4): e35126. Link: http://journals.plos.org/plosone/article?id=10.1371/journal.pone.0035126

**Duponchelle F et al (2016) Trans-Amazonian natal homing in giant catfish. J. Appl. Ecol. http://doi.org/bd45

***Fearnside PM (2014) Impacts of Brazil’s Madeira River dams: Unlearned lessons for hydroelectric development in Amazonia. Environmental Science & Policy 38: 164-172.


Citation

Finer M, Olexy T (2015) New Dams on the Madeira River (Brazil) Cause Forest Flooding. MAAP: 34.