Amazon Fire Tracker 2020: Brazil #4 (June 17, 2020)

As presented in MAAP #118, Amazon Conservation launched a real-time fire monitoring app that specializes in detection of elevated aerosol emissions in the smoke coming from burning Amazon fires. As detailed below, the app just detected the fourth major Amazon fire of 2020 on June 17. All four fires thus far have been in the state of Mato Grosso and burning recently deforested areas (see MAAP #113 for background).

Step 1.

Detection of elevated emissions in the southeastern Brazilian Amazon (Mato Grosso).

Step 1 of Amazon Fire App. Detection of elevated emissions in the southeastern Brazilian Amazon (Mato Grosso).

Step 2.

Zoom in on the emissions.

Step 3.

Adjust the transparency to see the underlying fire alerts that indicate the exact location of the fires. Obtain coordinates of the source of the fires.


Step 4.

Check the satellite imagery in Planet Explorer. Here is a high resolution Planet image showing the fire burning on June 17. Also see the comparisons below, comparing the the June 17 fires with a pre-fire image from June 10.

Pre-fire image, June 10:

pre-fire image, June 10


June 17 fires:

Imagery source: Planet.

Step 5.

Using Planet’s extensive imagery archive, we were able to determine that the fires were burning an area deforested in 2019 (and not a forest fire).

Coordinates: -10.45, -53.55


Annex – Fire Alert vs. Aerosol Emission Data

This two images show us how aerosol emission data allows users to prioritize hundreds (or thousands) of heat-based fire alerts (photo 1). In other words, the aerosol data indicates just the fires that are  actually burning lots of biomass and putting out abundant smoke.

References

Gorelick, N., Hancher, M., Dixon, M., Ilyushchenko, S., Thau, D., & Moore, R. (2017). Google Earth Engine: Planetary-scale geospatial analysis for everyone. Remote Sensing of Environment.”
https://earthengine.google.com/faq/
Planet Team (2017). Planet Application Program Interface: In Space for Life on Earth. San Francisco, CA. https://api.planet.com

Acknowledgements

This work was supported by the following major funders: USAID/NASA (SERVIR), Global Forest Watch Small Grants Fund (WRI), Norwegian Agency for Development Cooperation (NORAD),  International Conservation Fund of Canada (ICFC), Metabolic Studio, and Erol Foundation.


Citation

Finer M, Villa L (2020) Amazon Fire Tracker 2020: Brazil #4 (June 17, 2020). MAAP.

MAAP: Amazon Fire Tracker #2 – Brazil, June 8 2020

As presented in MAAP #118, Amazon Conservation launched a real-time fire monitoring app that specializes in detection of elevated aerosol emissions from burning Amazon fires. As detailed below, the app detected the second major 2020 fire on June 8, 2020 in Mato Grosso, Brazil.

Step 1. Detection of elevated emissions in the southeastern Brazilian Amazon (Mato Grosso).

Step 4. Check the satellite imagery archive in Planet Explorer.

Step 2. Zoom in on the emissions, adjust the transparency to see the underlying fire alerts that indicate the fire location.

Step 2. Zoom in on the emissions, adjust the transparency to see the underlying fire alerts that indicate the fire location.

Step 3. Zoom in again to see precisely the fire location and obtain coordinates.

Step 3. Zoom in again to see precisely the fire location and obtain coordinates.

Step 4. Check the satellite imagery archive in Planet Explorer. Here is a Landsat image (30 meter resolution) showing the fire burned around 3,000 hectares (7,400 acres) of an area deforested in July 2018. Note that MAAP #113 made the important discovery that most of the 2019 Brazilian Amazon fires were burning recently deforested areas (and not uncontrolled forest fires).

Step 1. Detection of elevated emissions in the southeastern Brazilian Amazon (Mato Grosso).

Coordinates

lat: -12.57, lon: -54.06


References

Gorelick, N., Hancher, M., Dixon, M., Ilyushchenko, S., Thau, D., & Moore, R. (2017). Google Earth Engine: Planetary-scale geospatial analysis for everyone. Remote Sensing of Environment.”
https://earthengine.google.com/faq/

Acknowledgements

This work was supported by the following major funders: USAID/NASA (SERVIR), Global Forest Watch Small Grants Fund (WRI), Norwegian Agency for Development Cooperation (NORAD),  International Conservation Fund of Canada (ICFC), Metabolic Studio, and Erol Foundation.


Citation

Finer M, Villa L (2020) Amazon 2020 Fire Tracker #2 – Brazil, June 8. MAAP.

MAAP #119: Predicting 2020 Brazilian Amazon Fires

The Brazilian Amazon fires made international headlines last year.

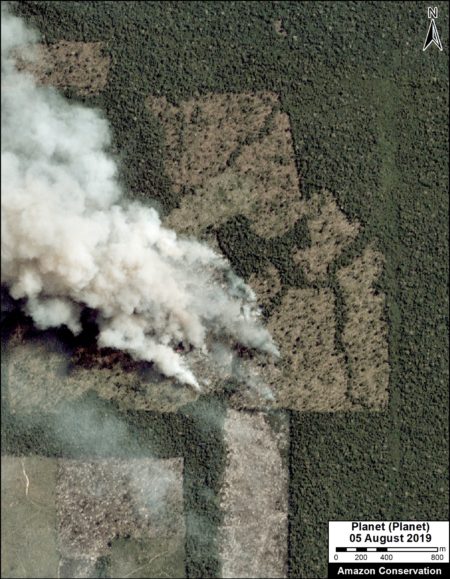
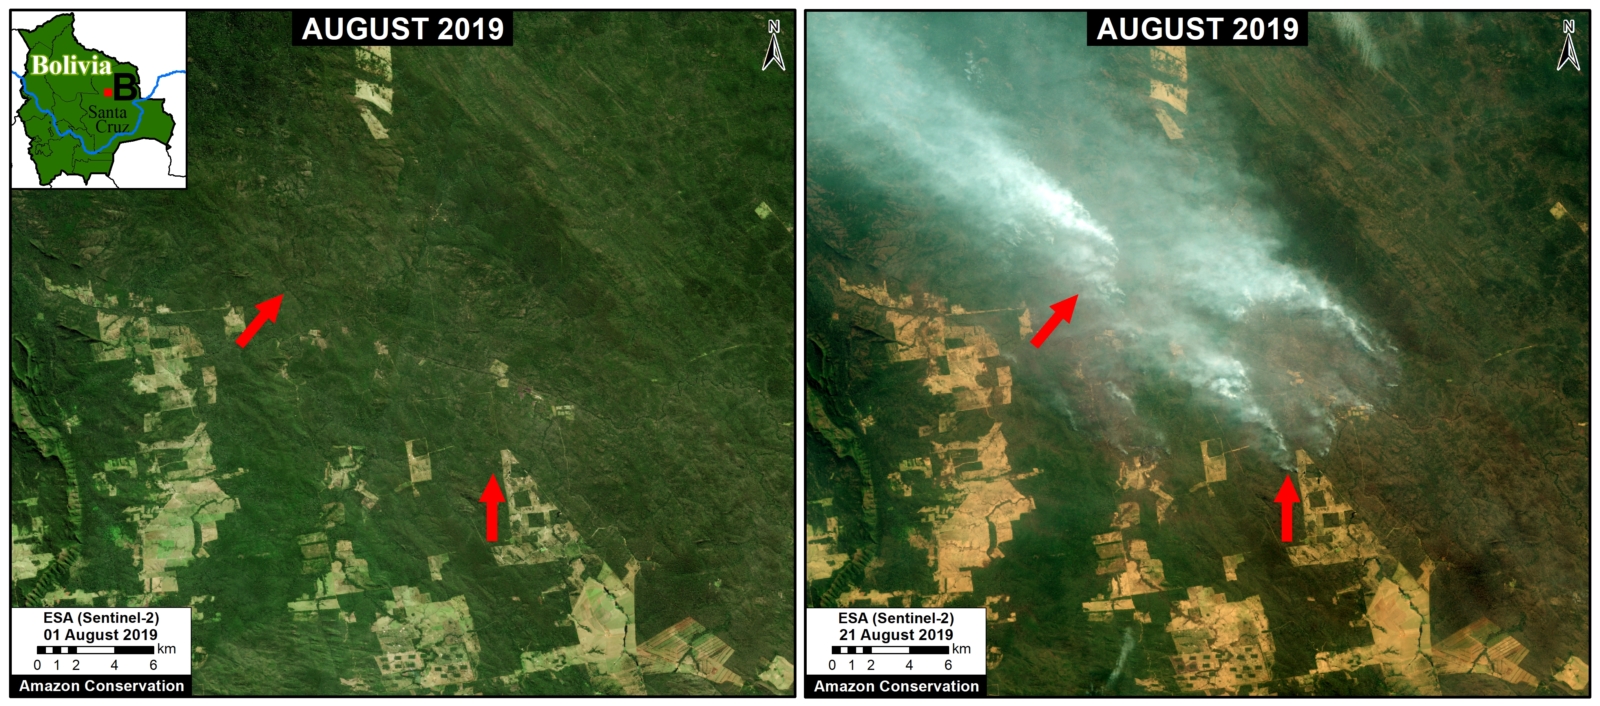
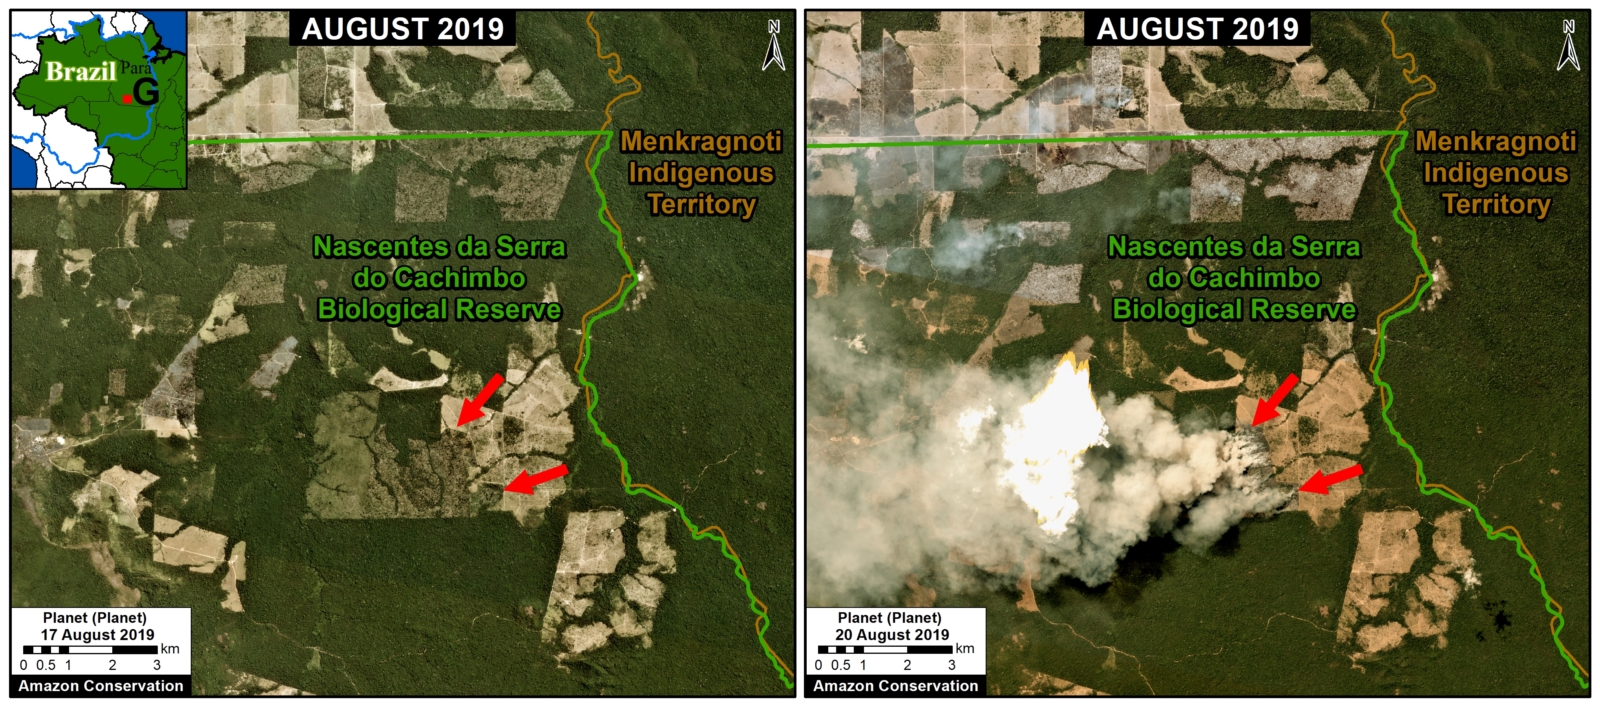
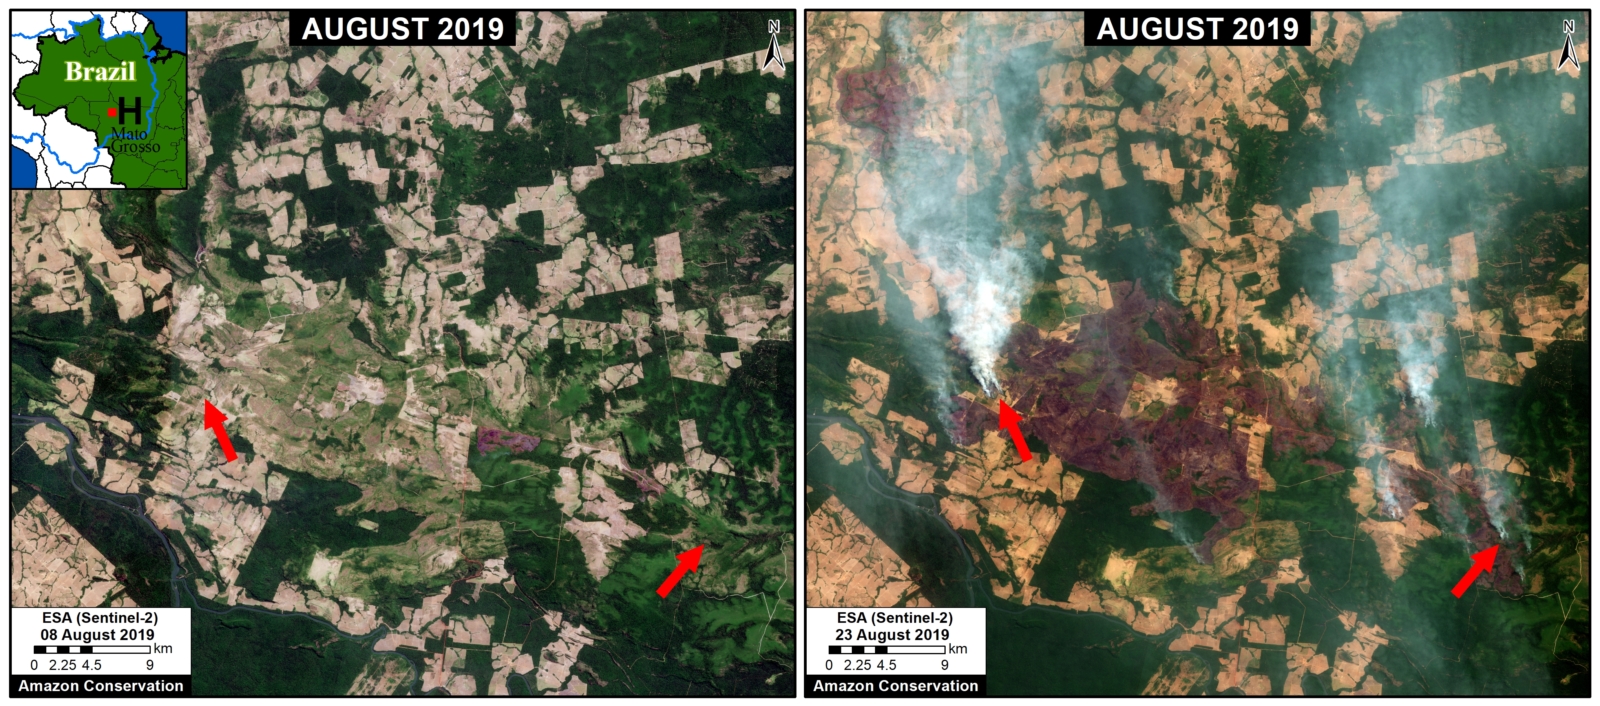
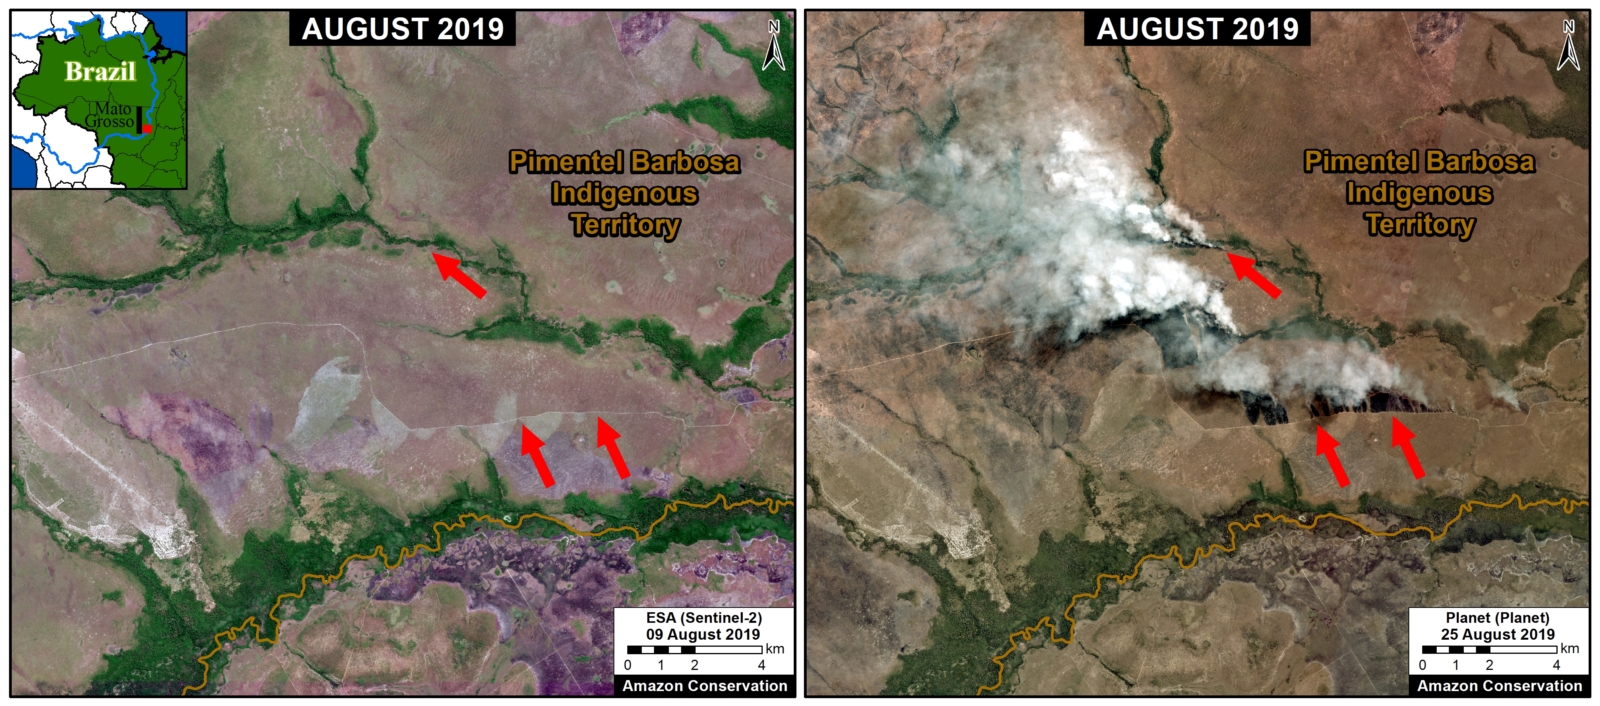
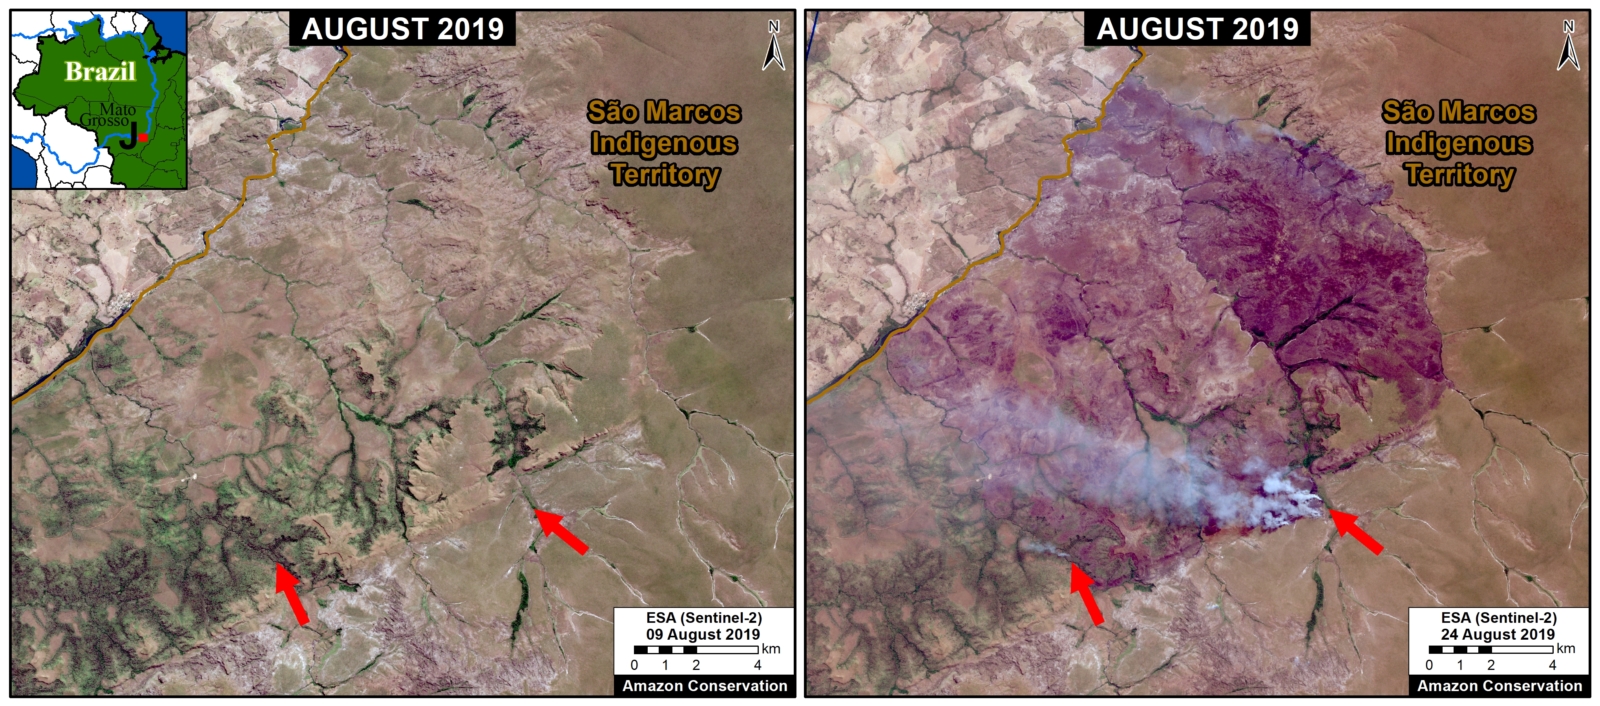
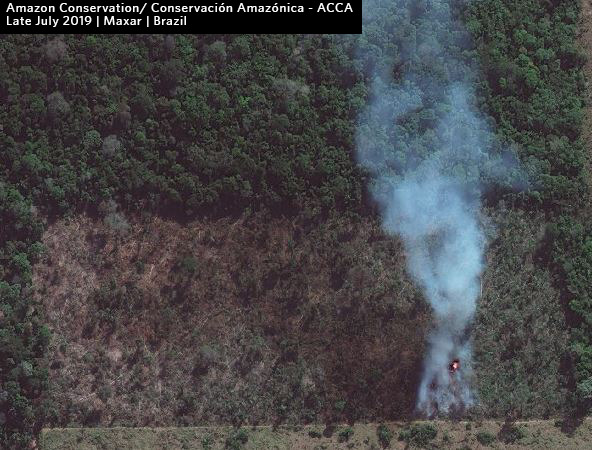
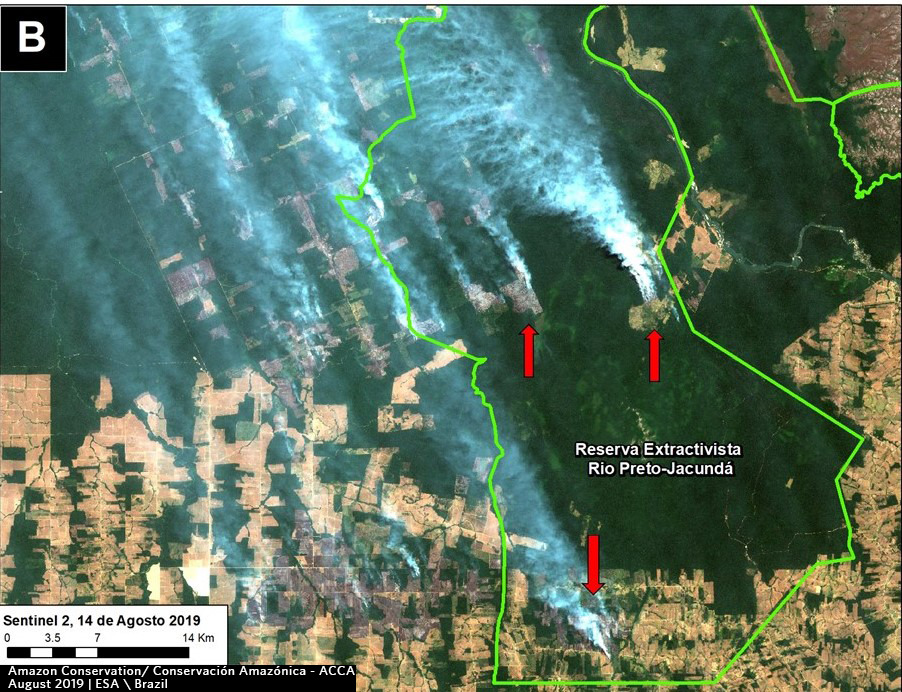
By analyzing an archive of satellite imagery (from Planet Explorer), we made the major discovery that many of the 2019 fires were actually burning recently deforested areas (MAAP #113). In fact, many of the fires were burning areas deforested earlier that same year of 2019.

Thus, we may predict 2020 fire locations based on identifying major deforestation events in the early months of this year.

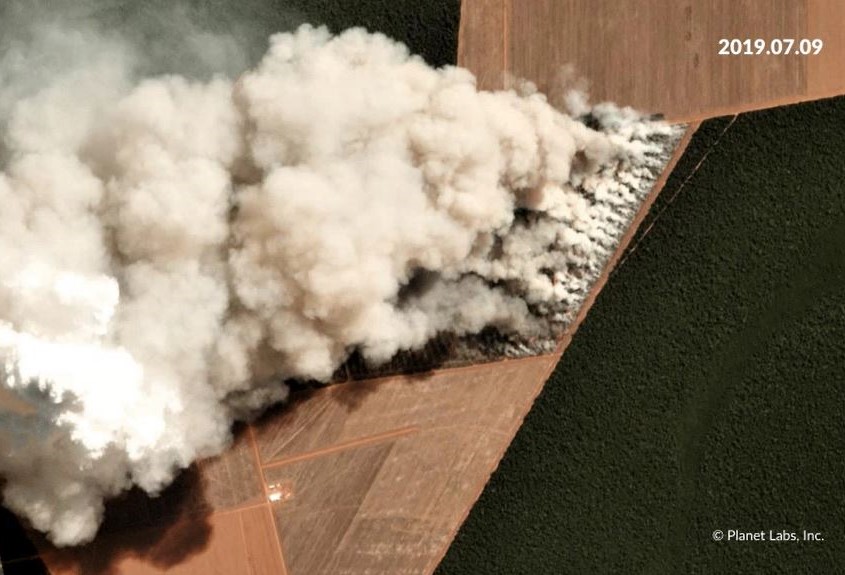
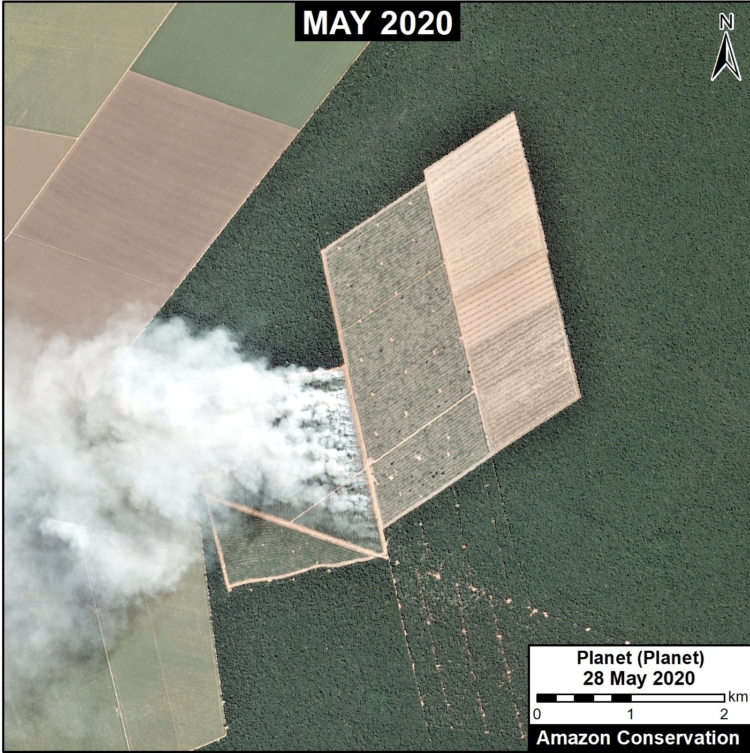
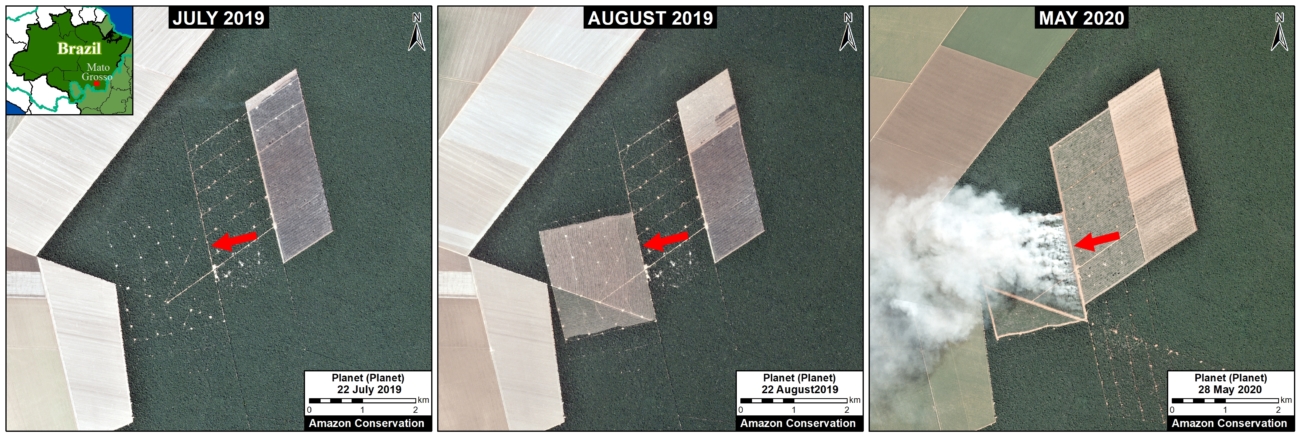
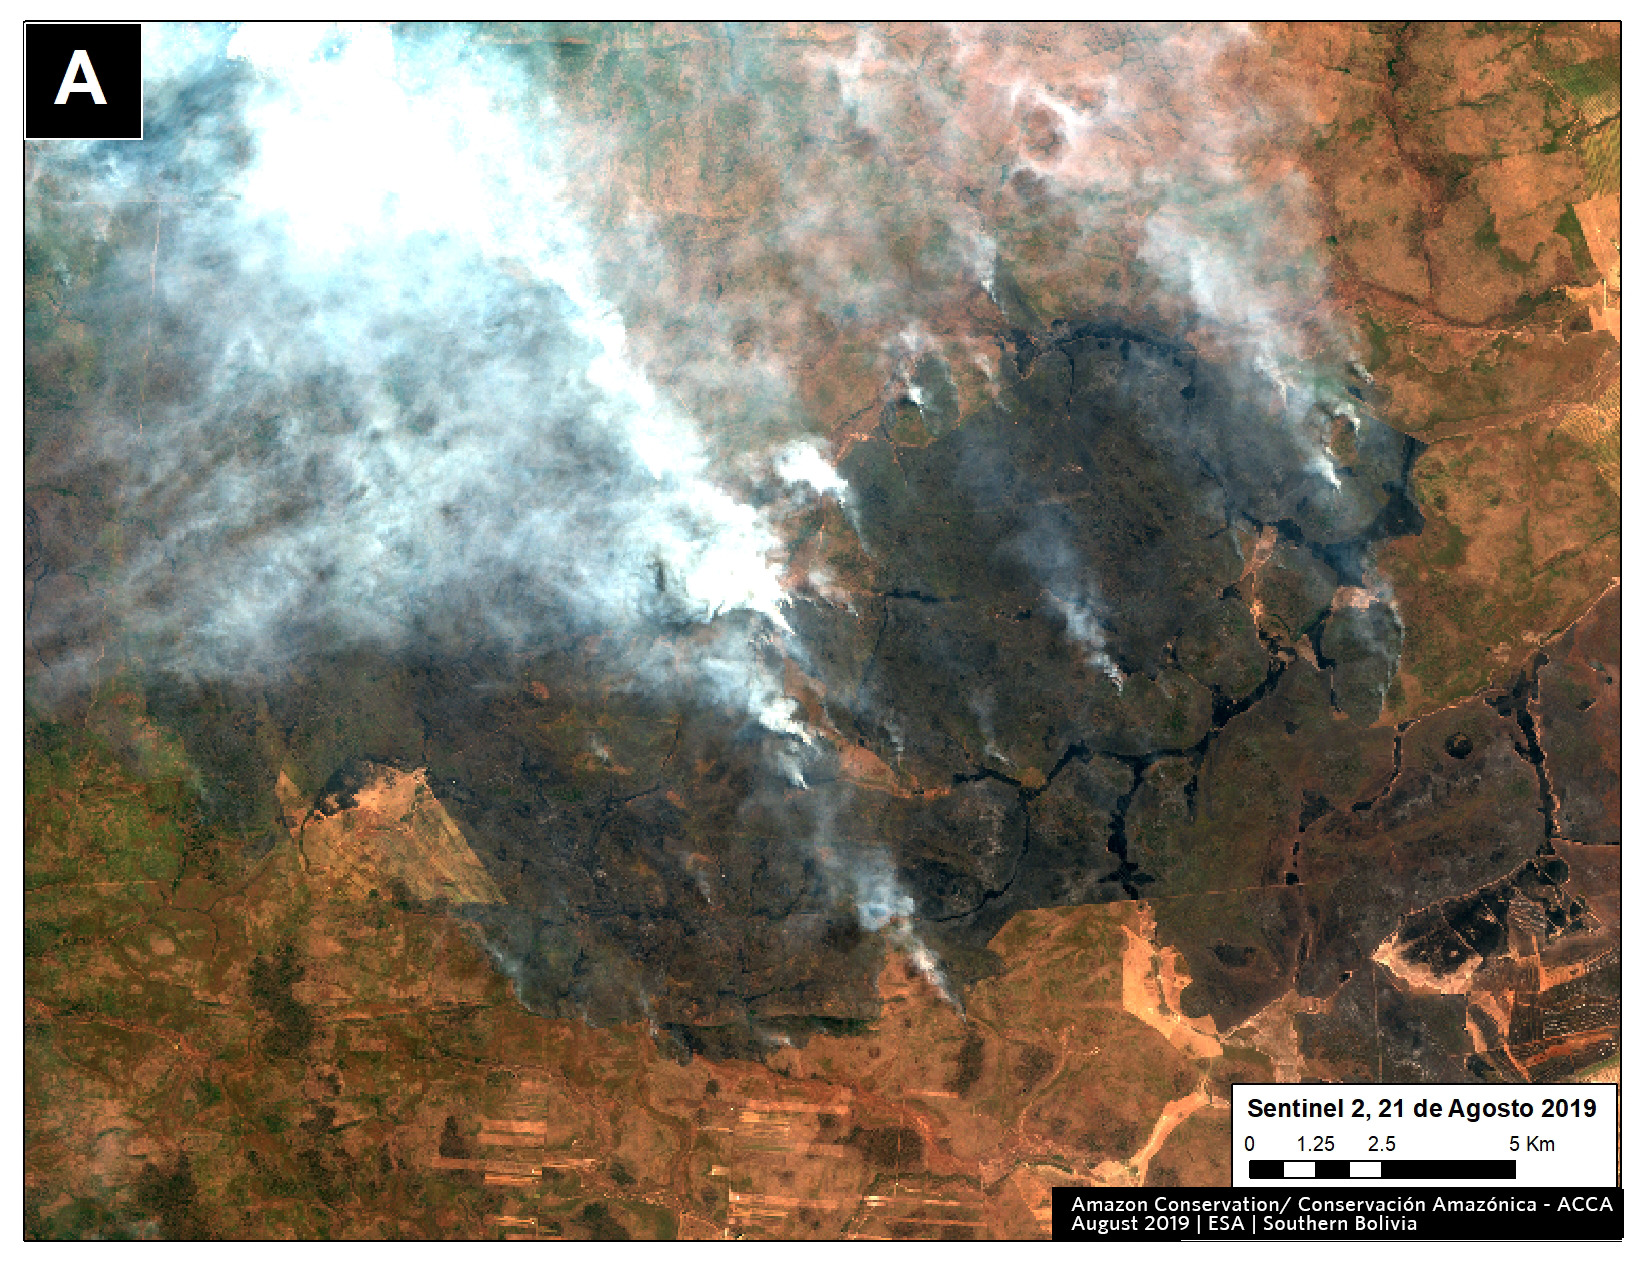
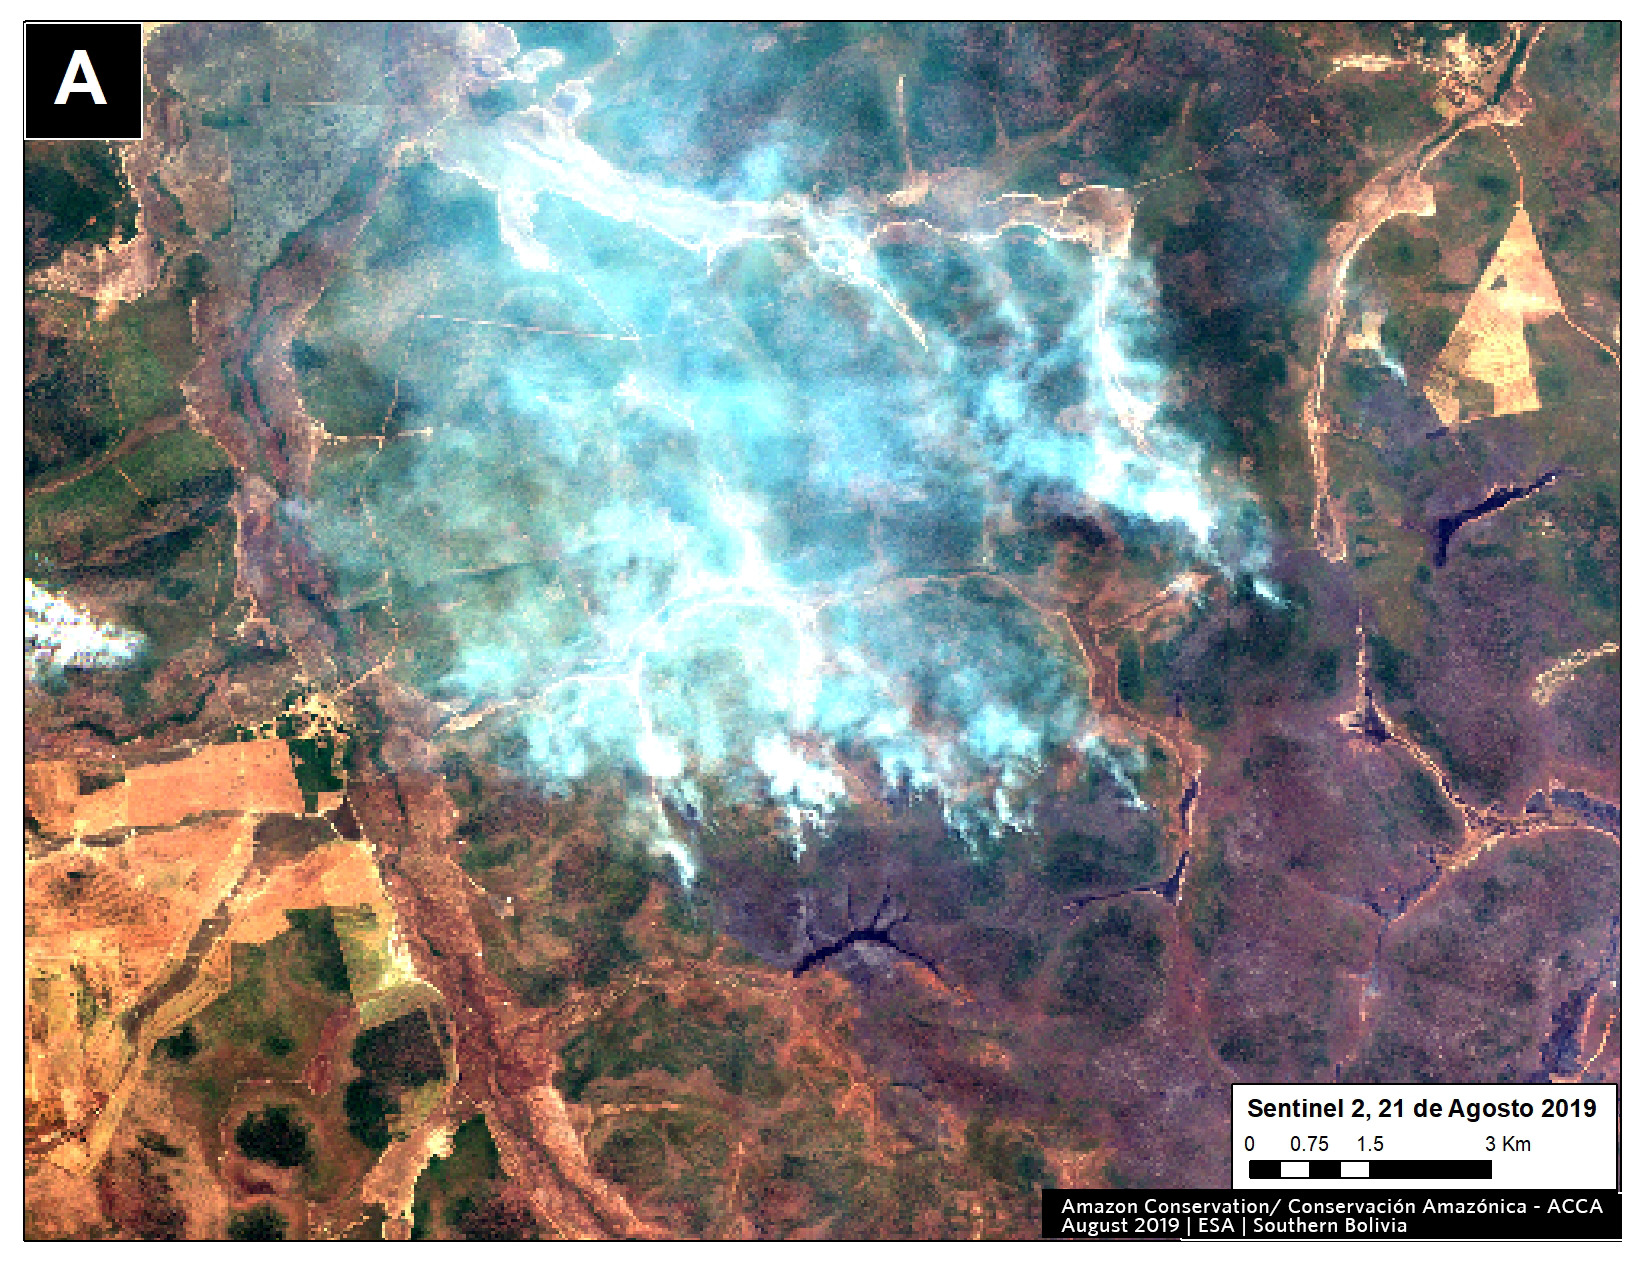
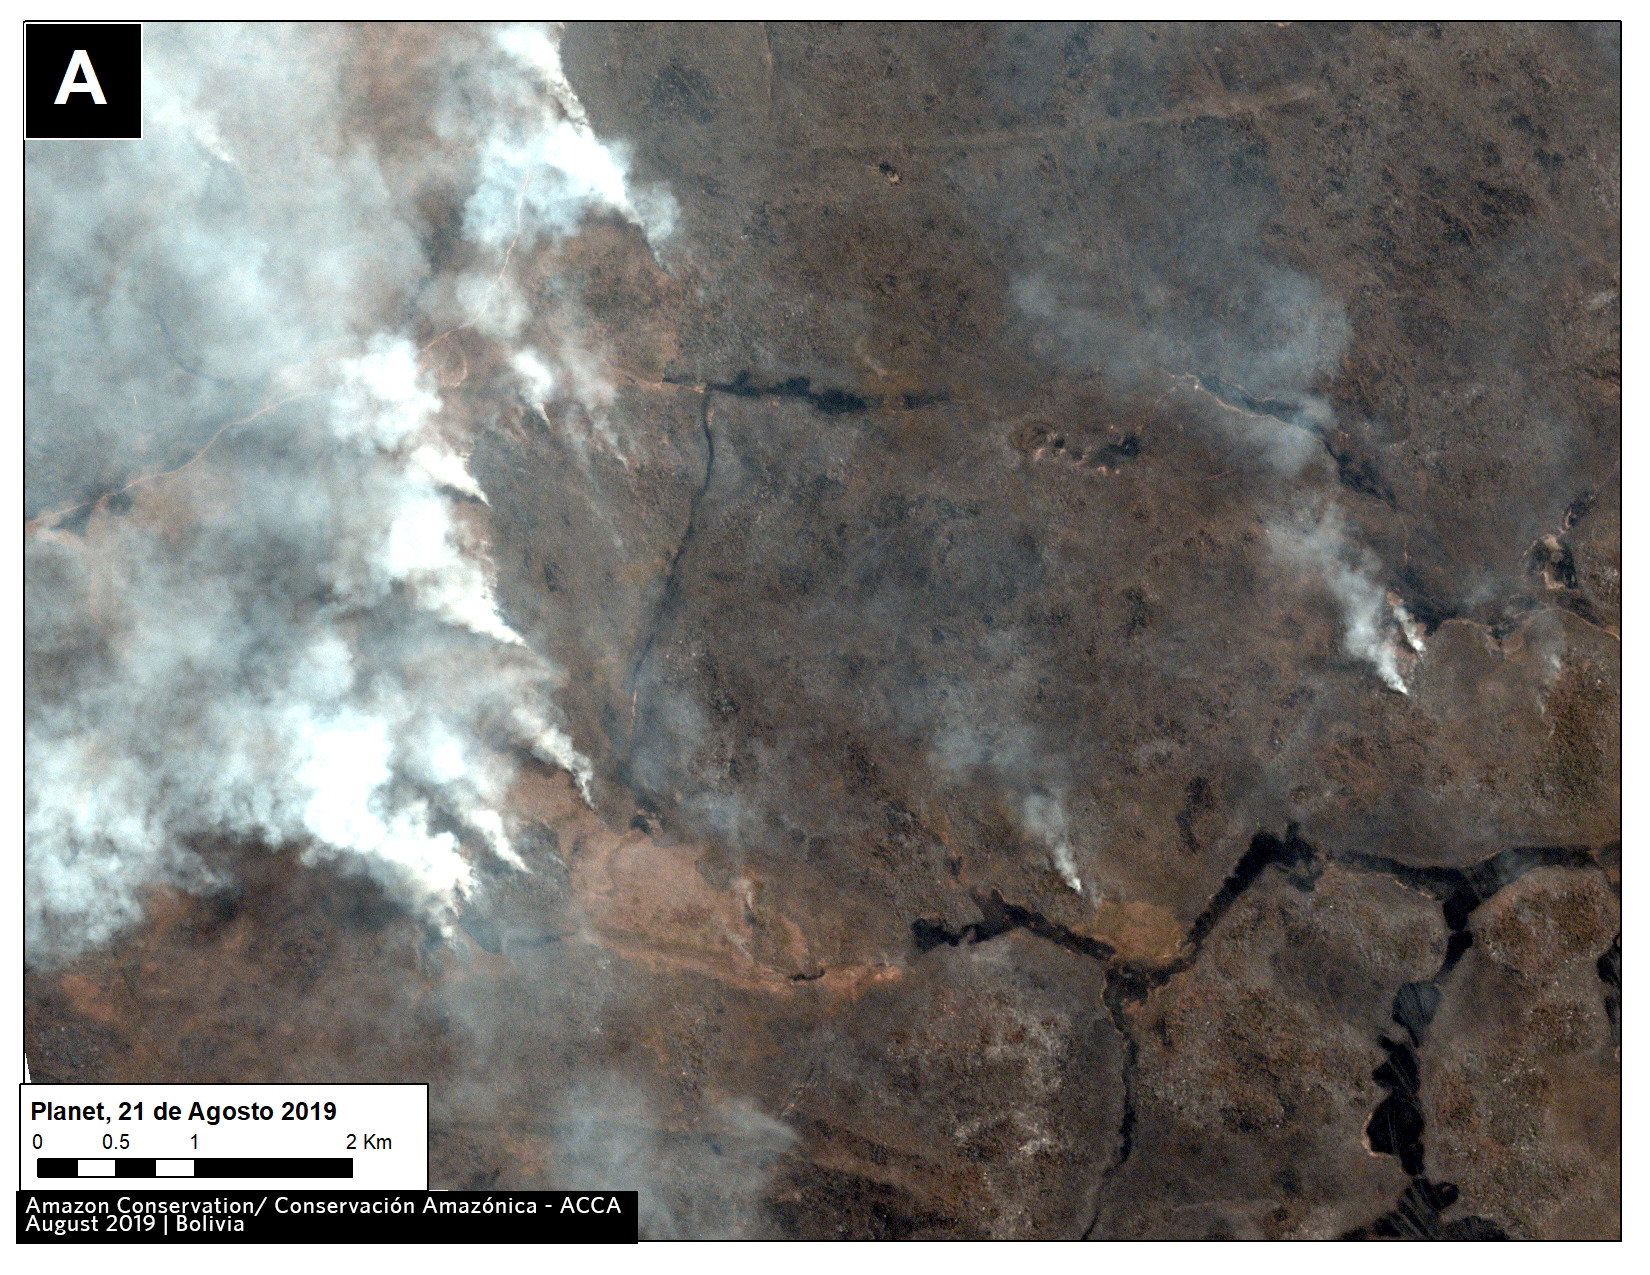
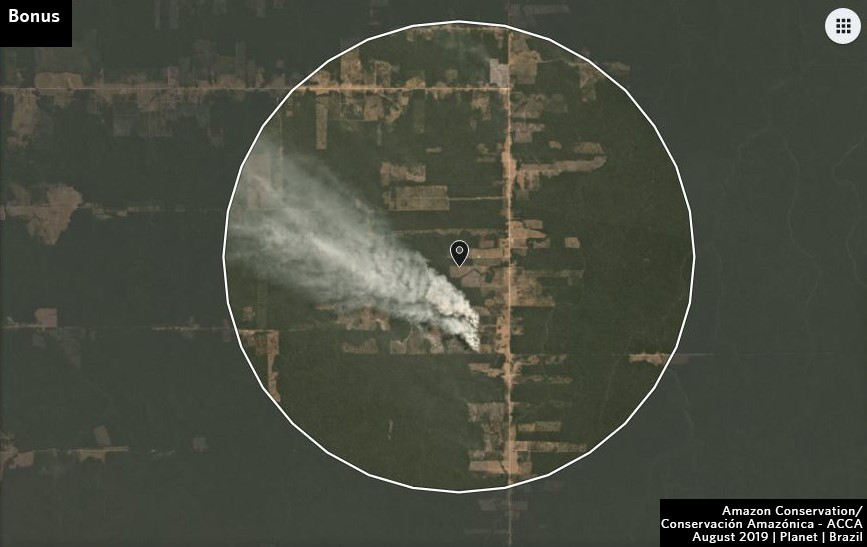
2019 Brazilian Amazon fire burning recently deforested area, not uncontrolled forest fire. Data: Planet; Analysis: MAAP.

Using a novel methodology*, we estimate the deforestation of over 150,000 hectares (373,240 acres) of primary forest in the Brazilian Amazon thus far in 2020 (through May 25). Thus, there is high potential for another intense fire season.

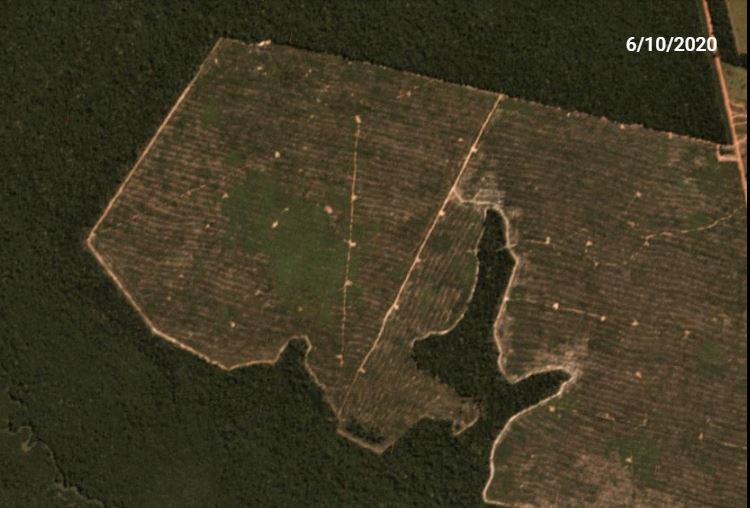
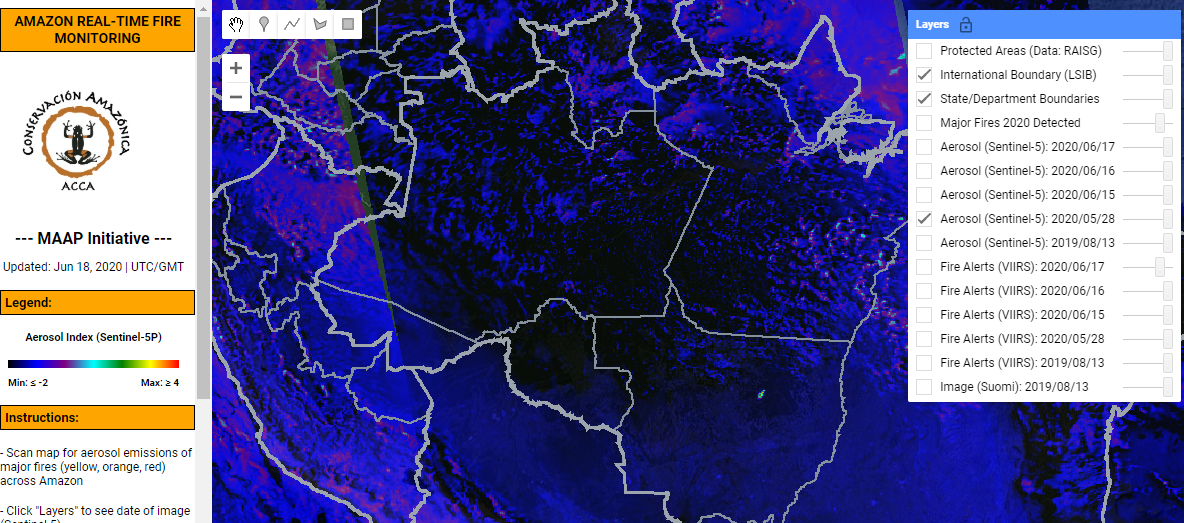
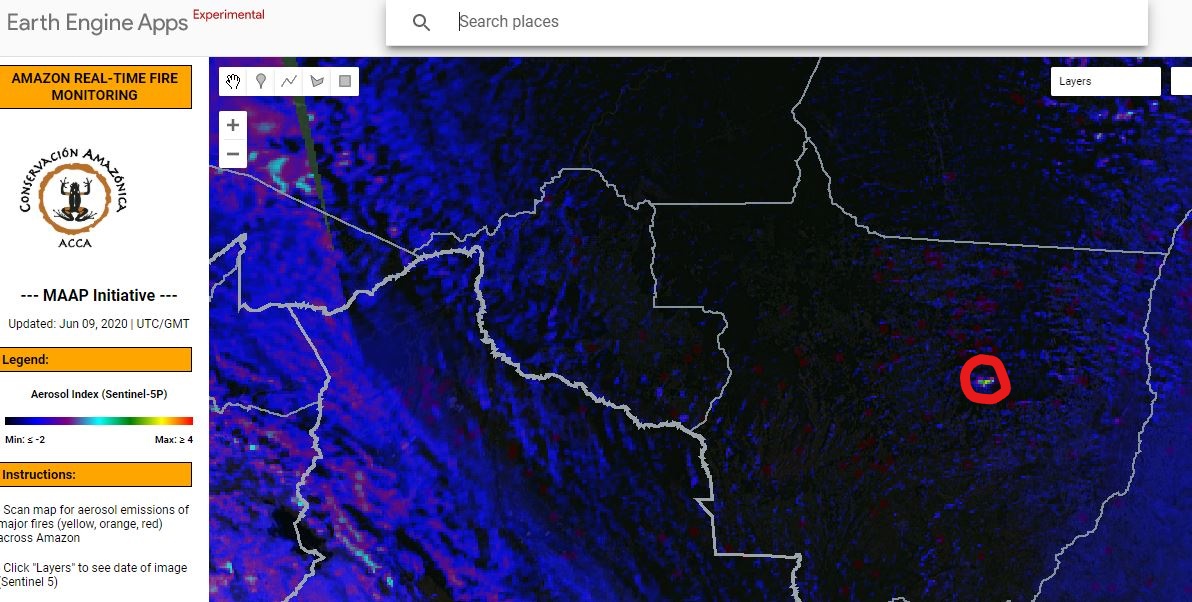
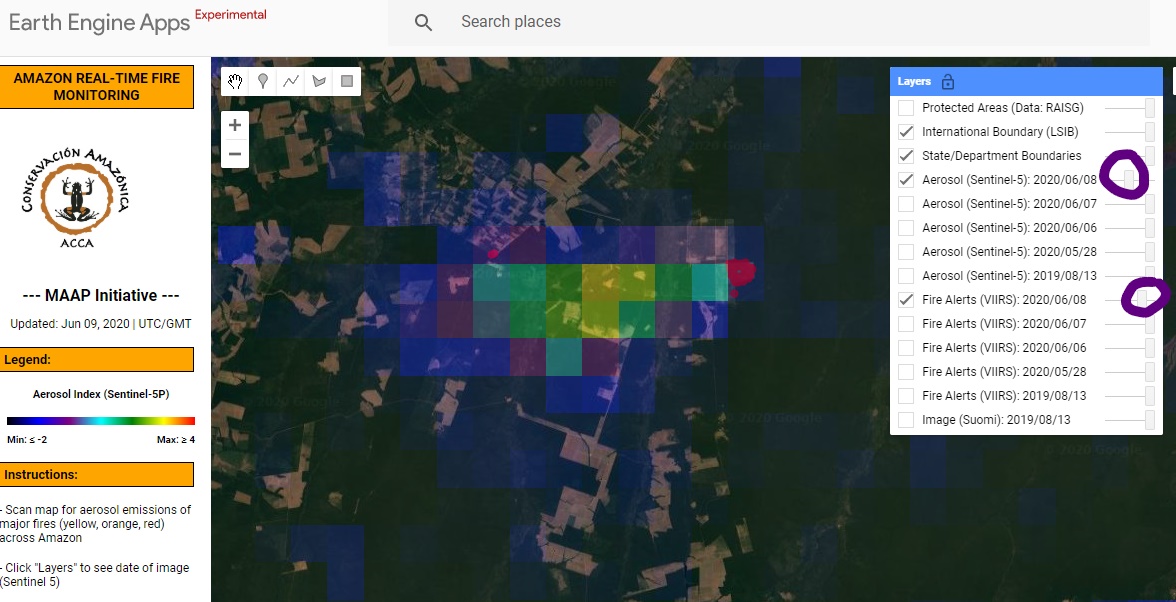
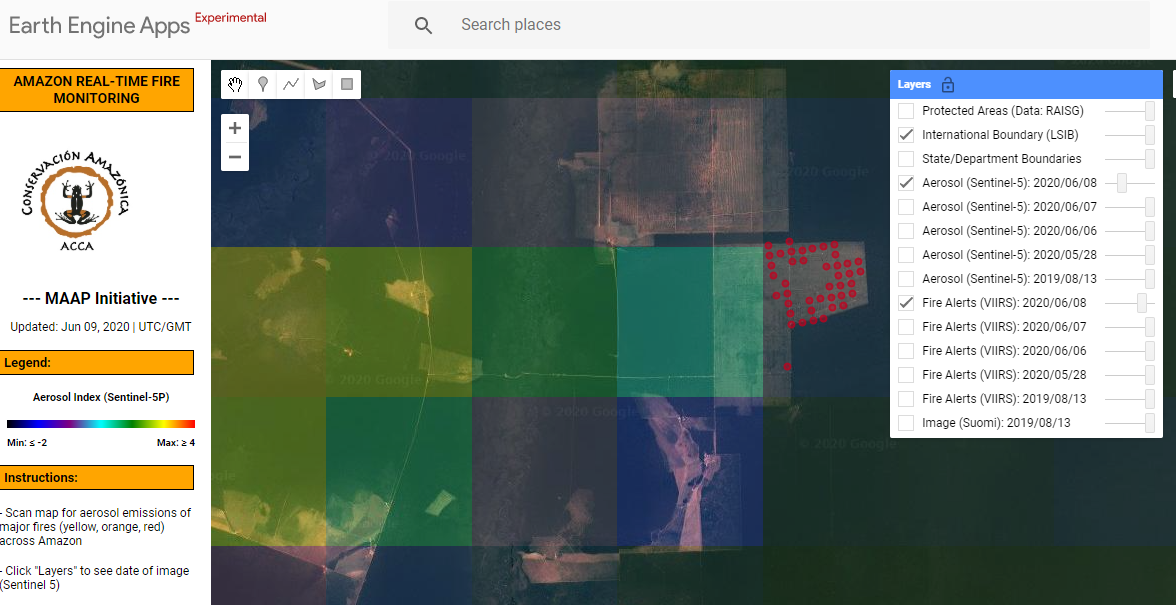
Below, we illustrate the process of predicting 2020 fires based on recent deforestation.

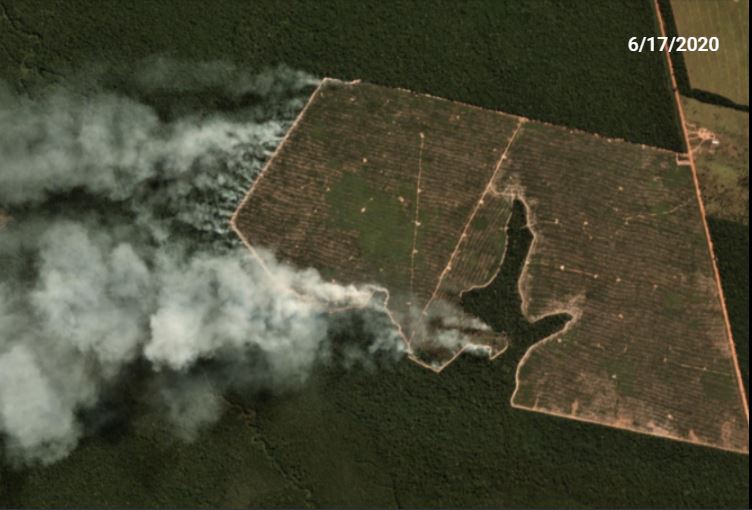
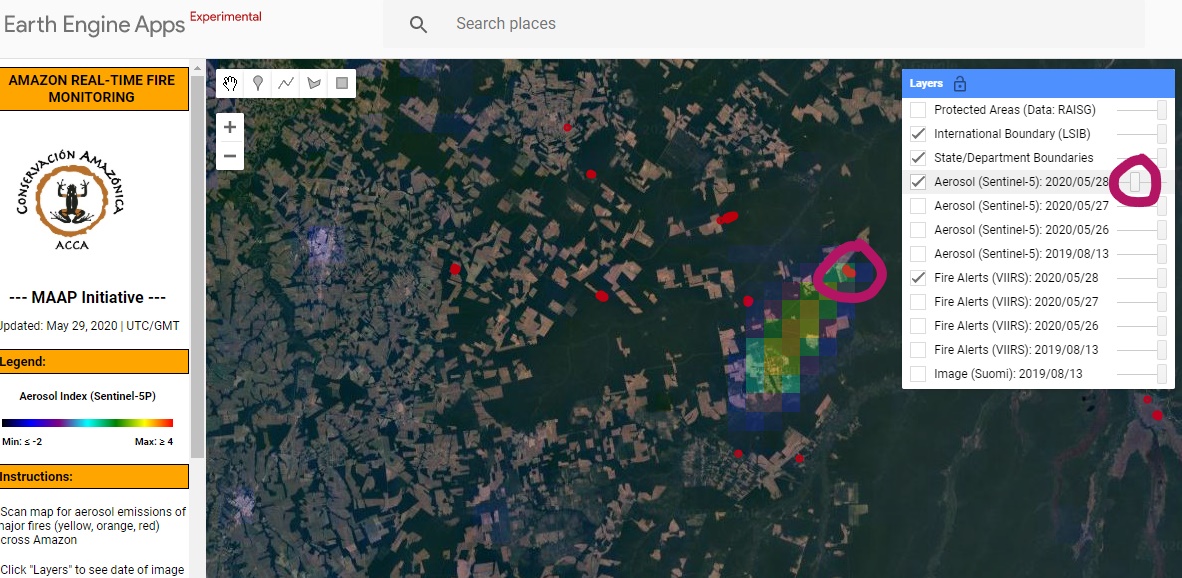
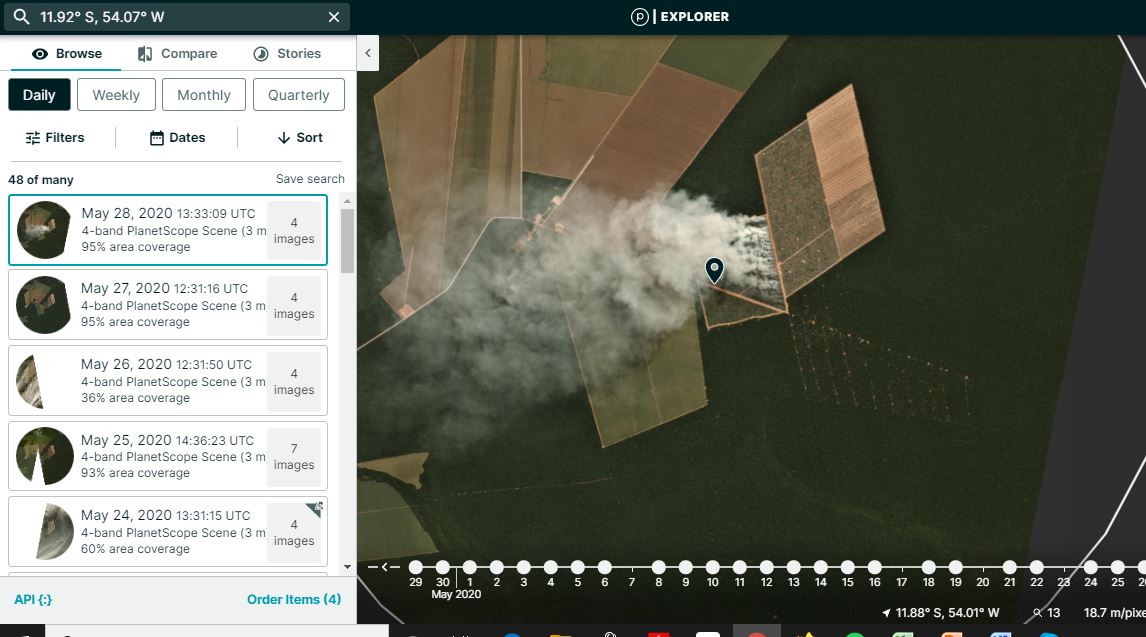
Note: In MAAP #118 we just reported that the first major fires of 2020 were in fact burning recently deforested areas (2018-19).


Predicting 2020 fires

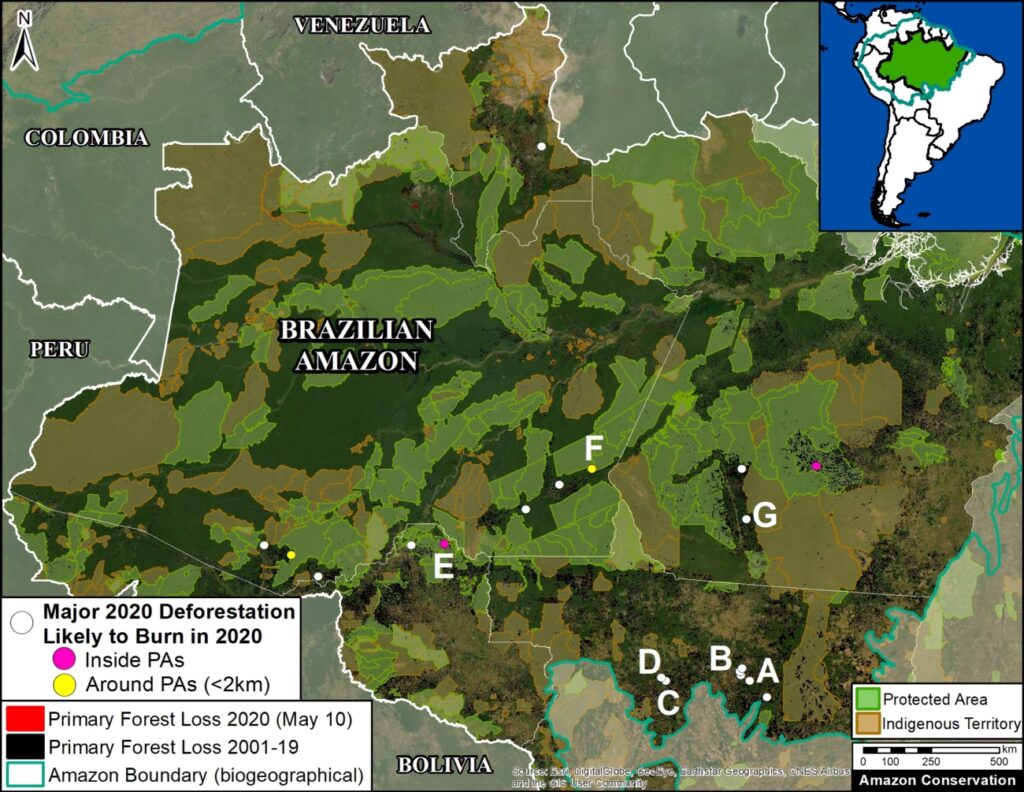
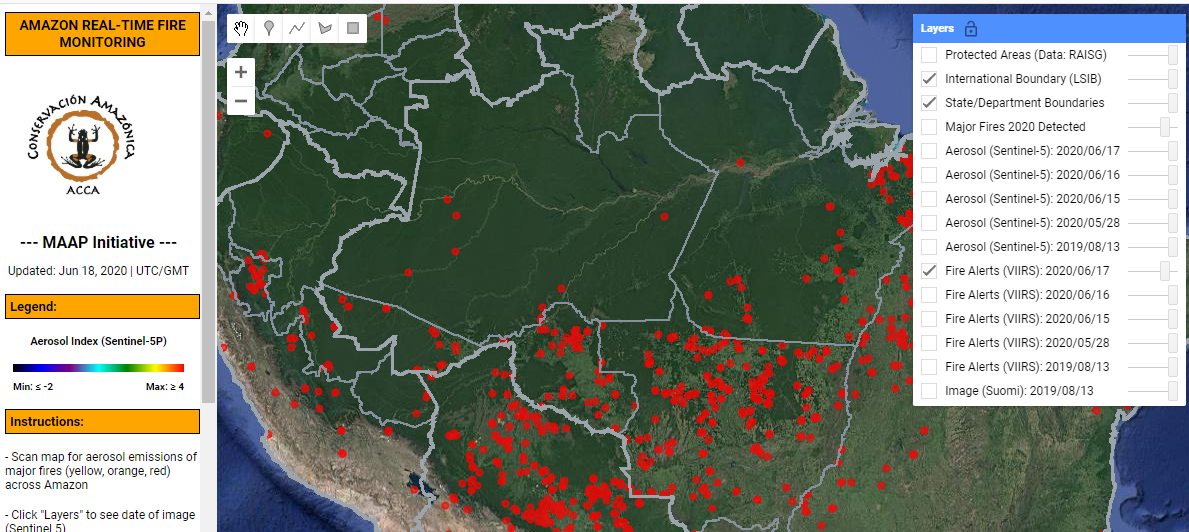
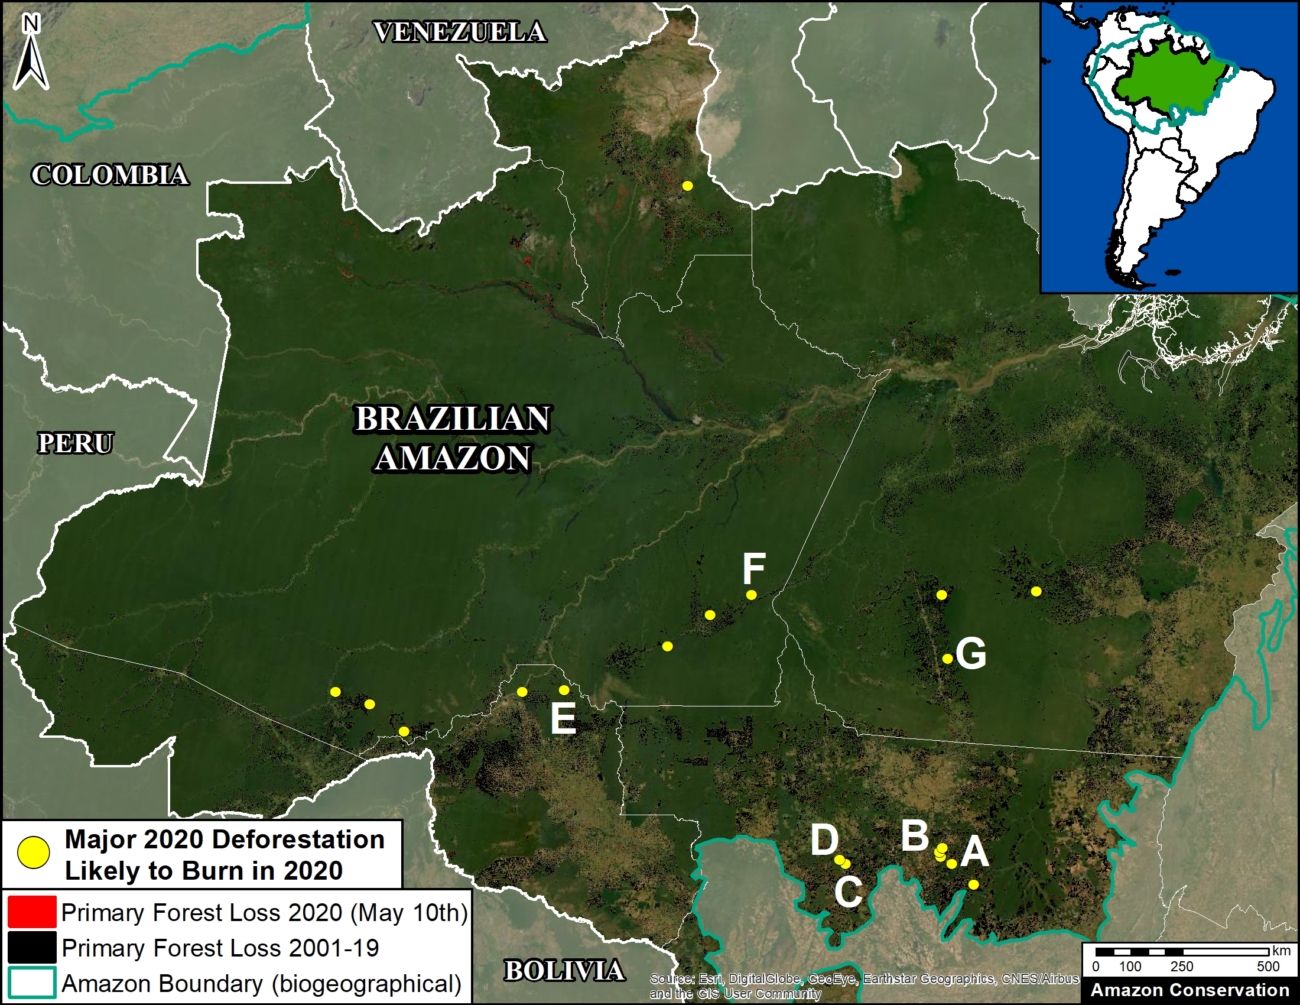
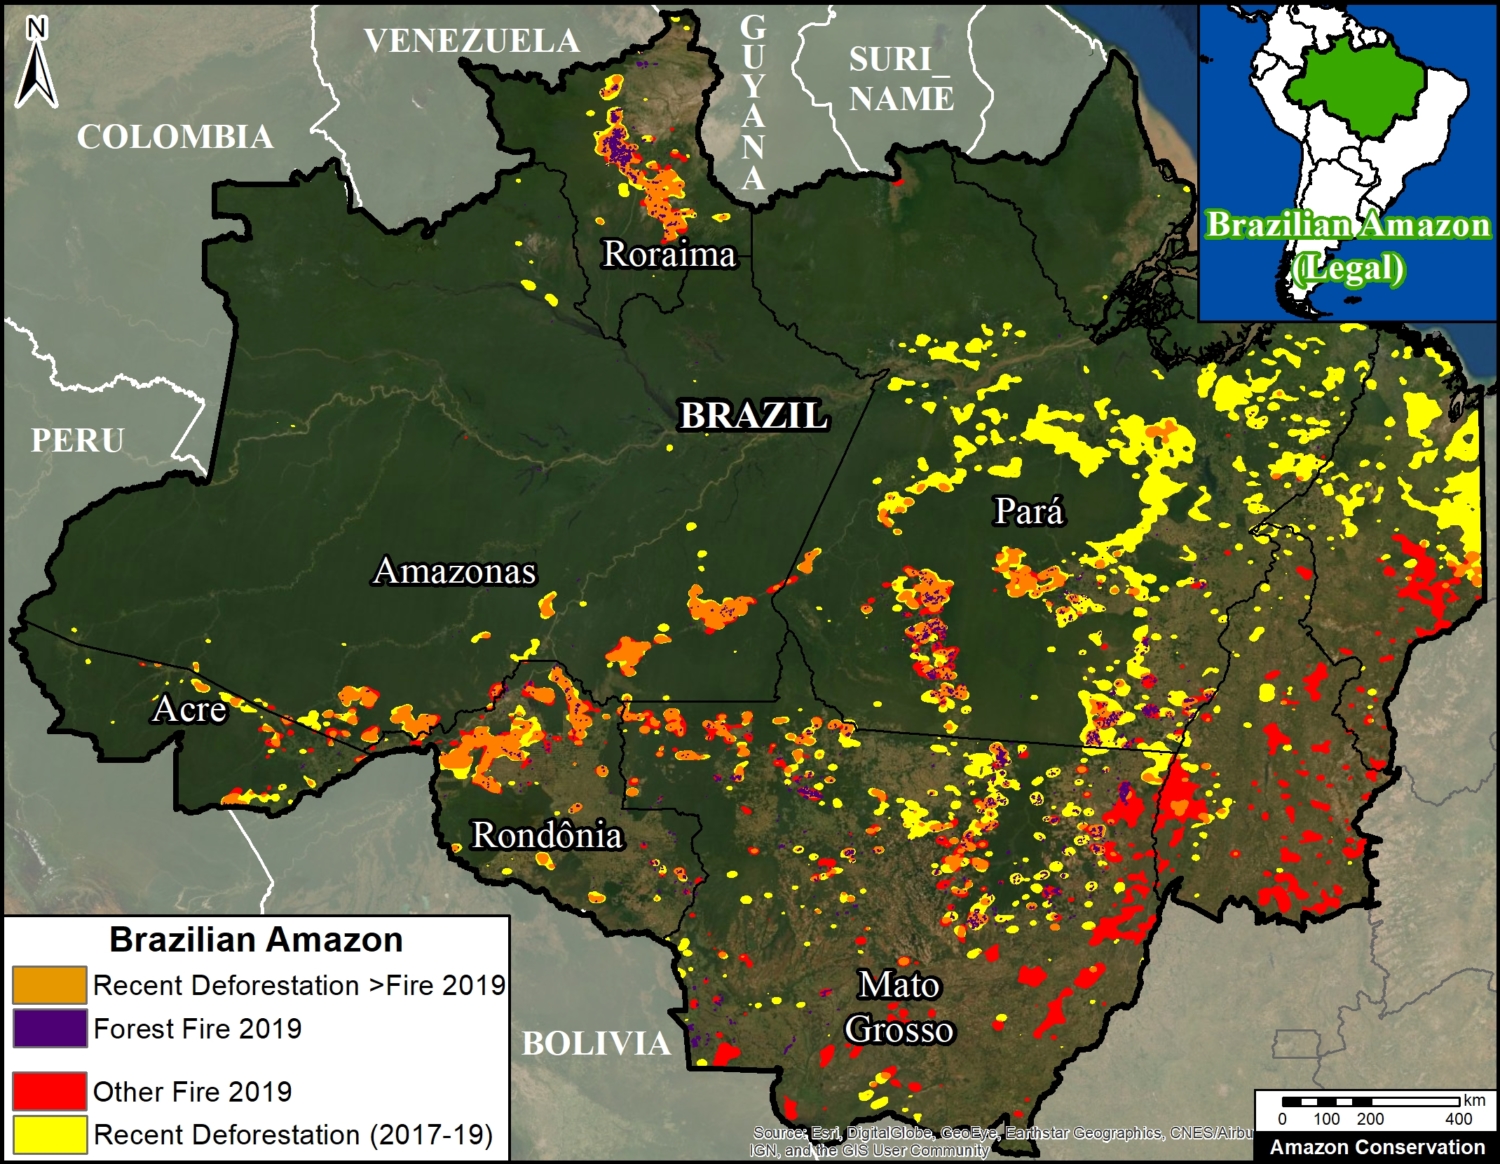
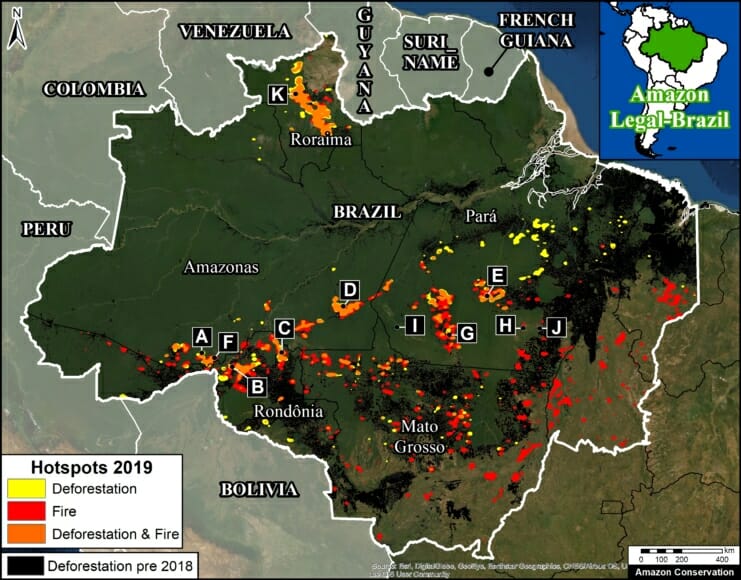
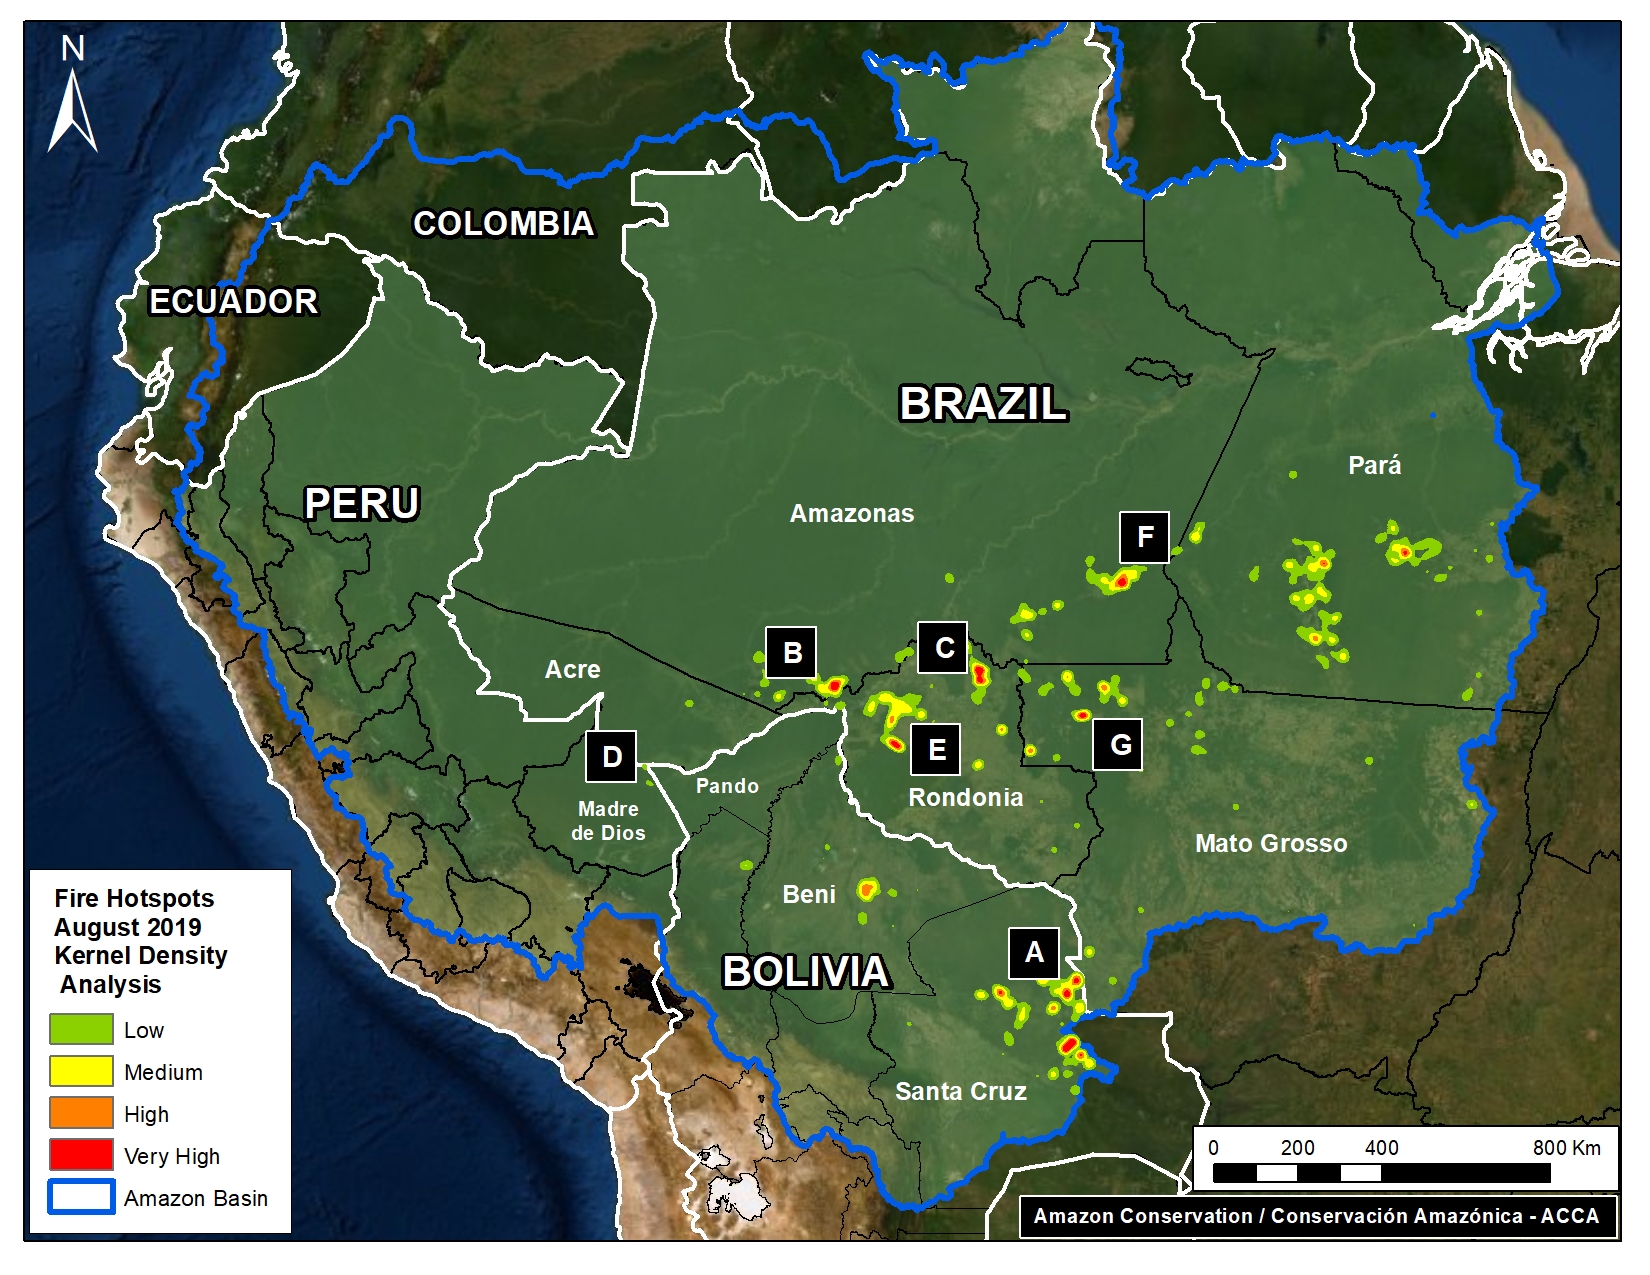
In the Base Map, the yellow dots indicate the largest new deforestation events that we predict are likely 2020 fire locations. See below for satellite imagery examples (letters A-G). Two of the likely fire points are within protected areas (see Annex).

Base Map. Major 2020 deforestation events (yellow dots) as predictors of 2020 fire events. Data: Hansen/UMD/Google/USGS/NASA, UMD/GLAD, RAISG, MAAP. Click to Enlarge.


Examples of Major 2020 Deforestation Events

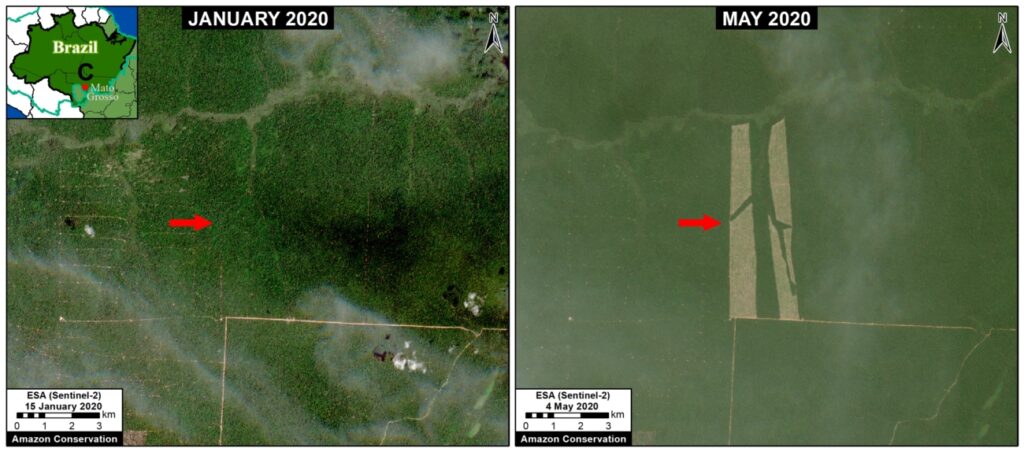
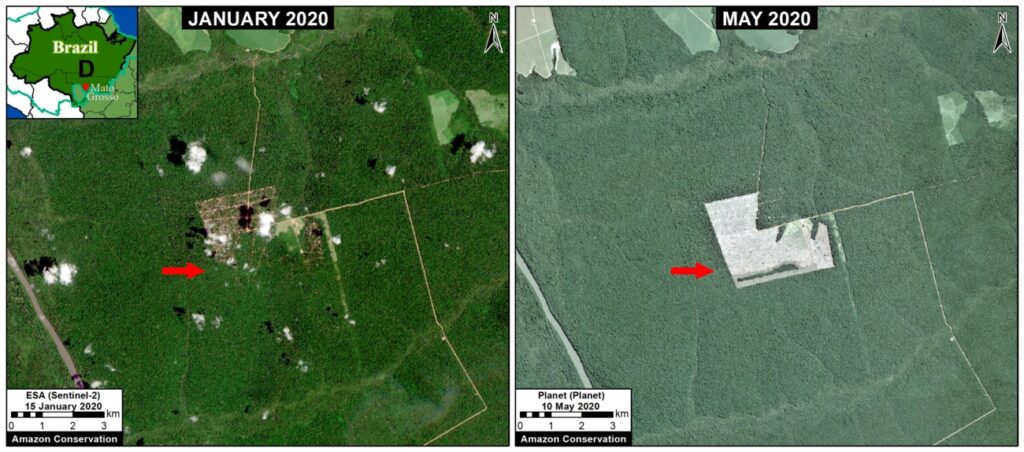
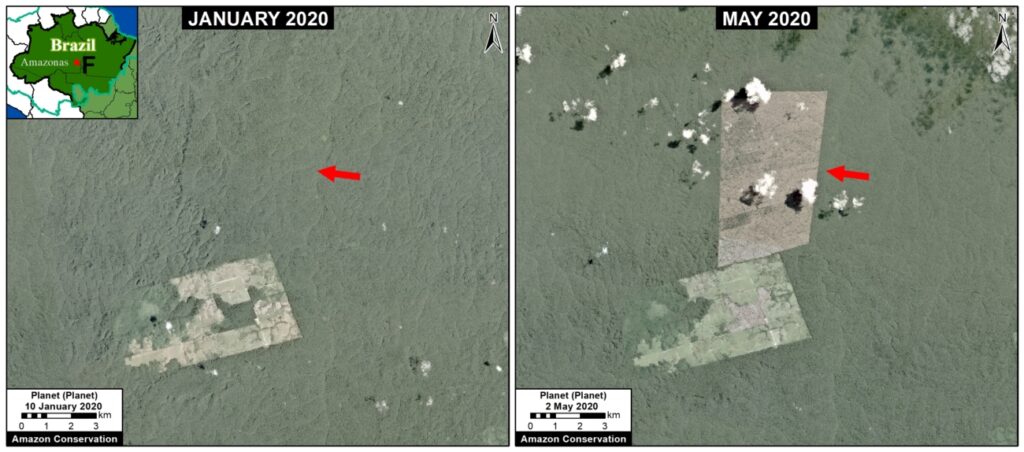
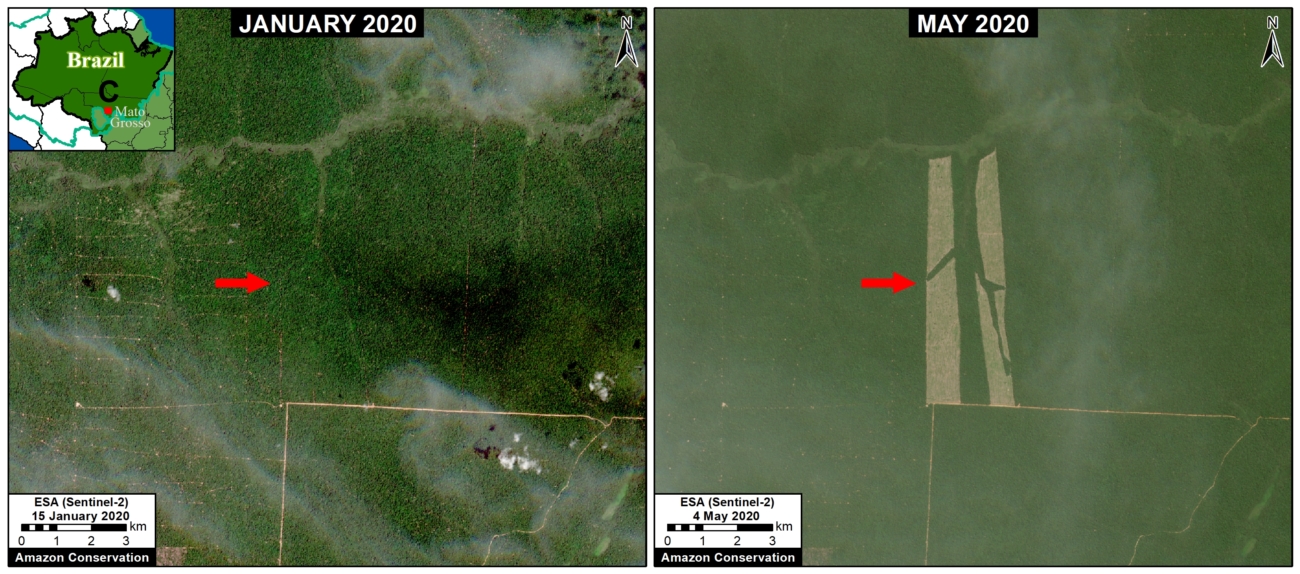
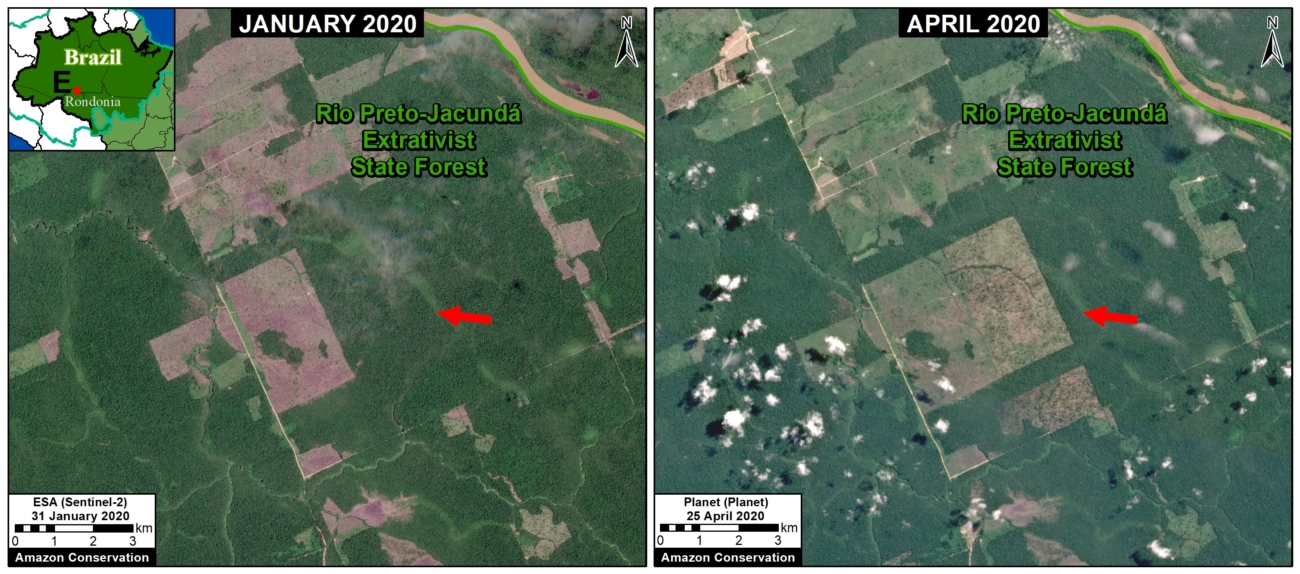
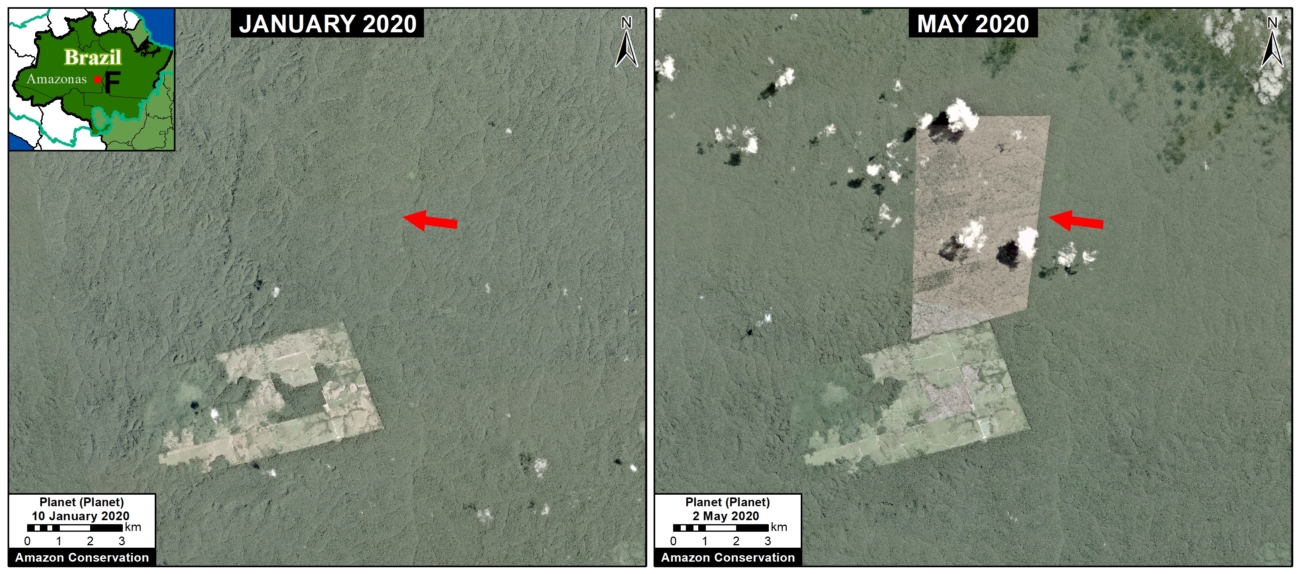
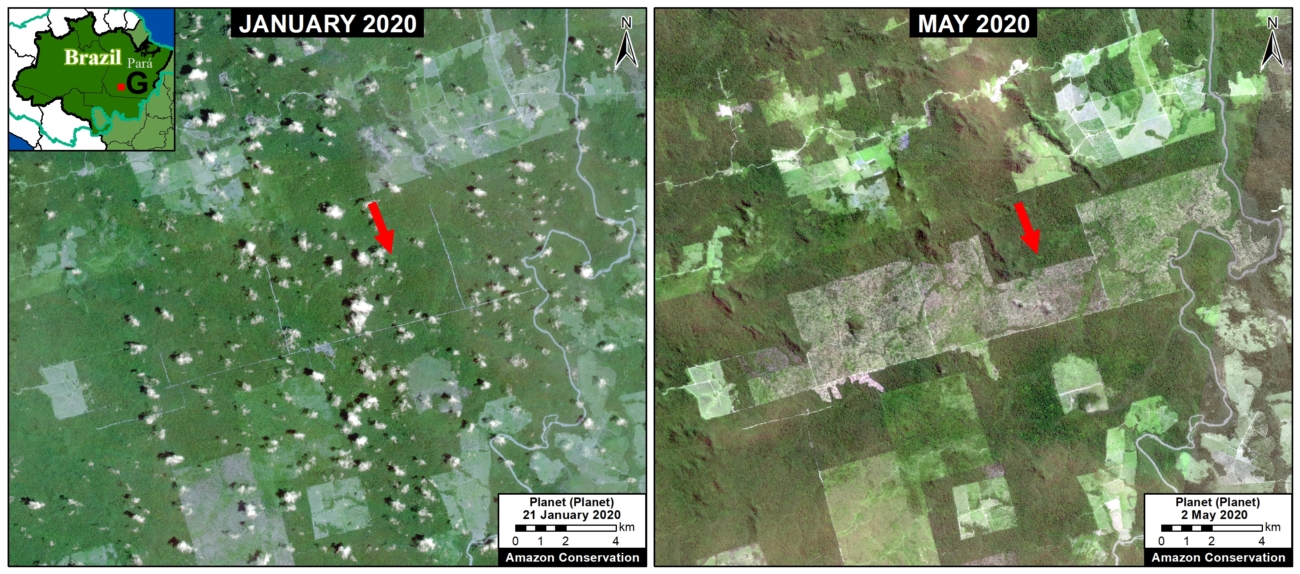
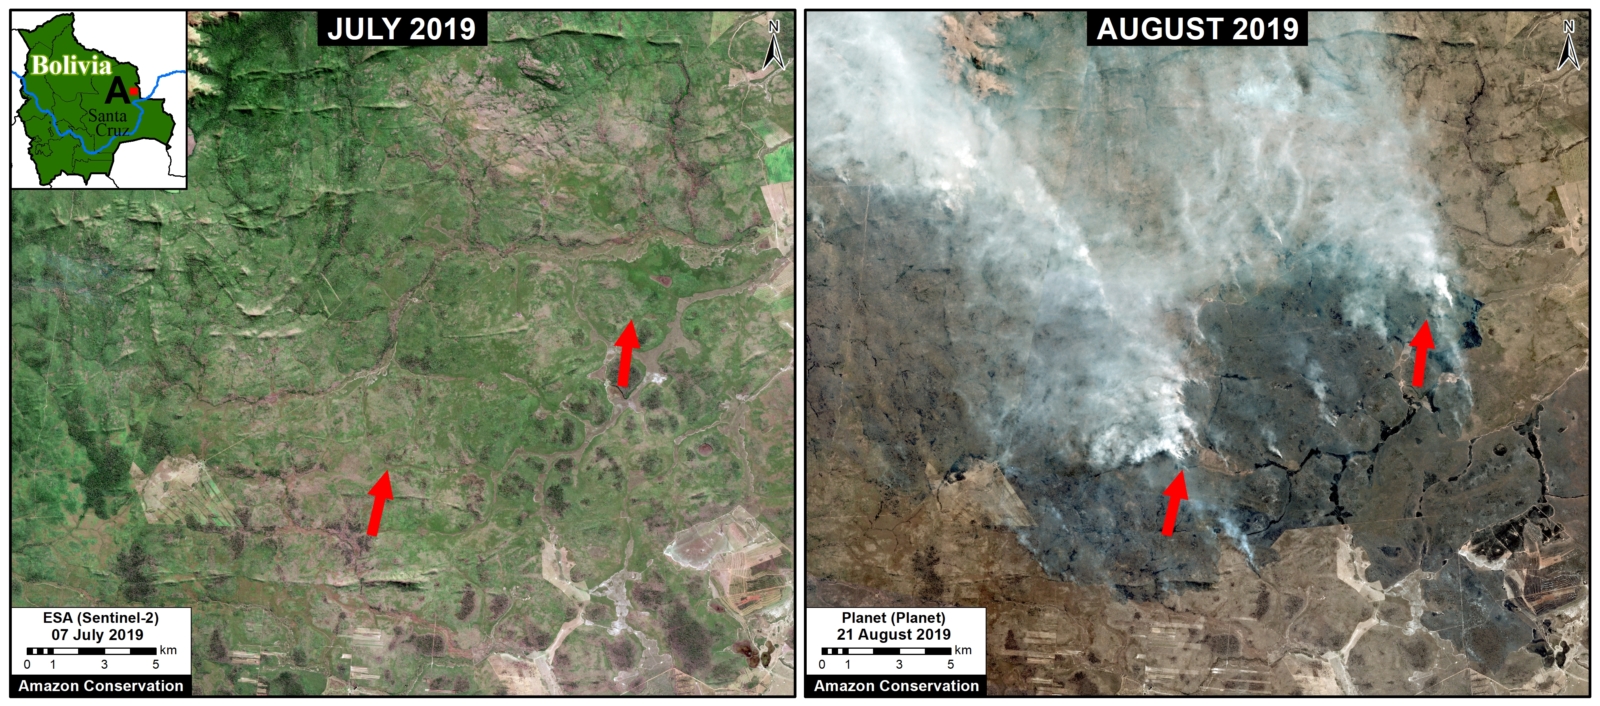
Below is a series of images showing the major deforestation events of 2020 that we predict are likely upcoming fire locations (see letters A-G on the Base Map above for context). The red arrows point to the major deforestation events. Note that all of the deforestation areas are surrounded by primary forest that could be impacted if fires escape. Also note that several deforestation areas are quite large, over 2,000 hectares (5,000 acres).

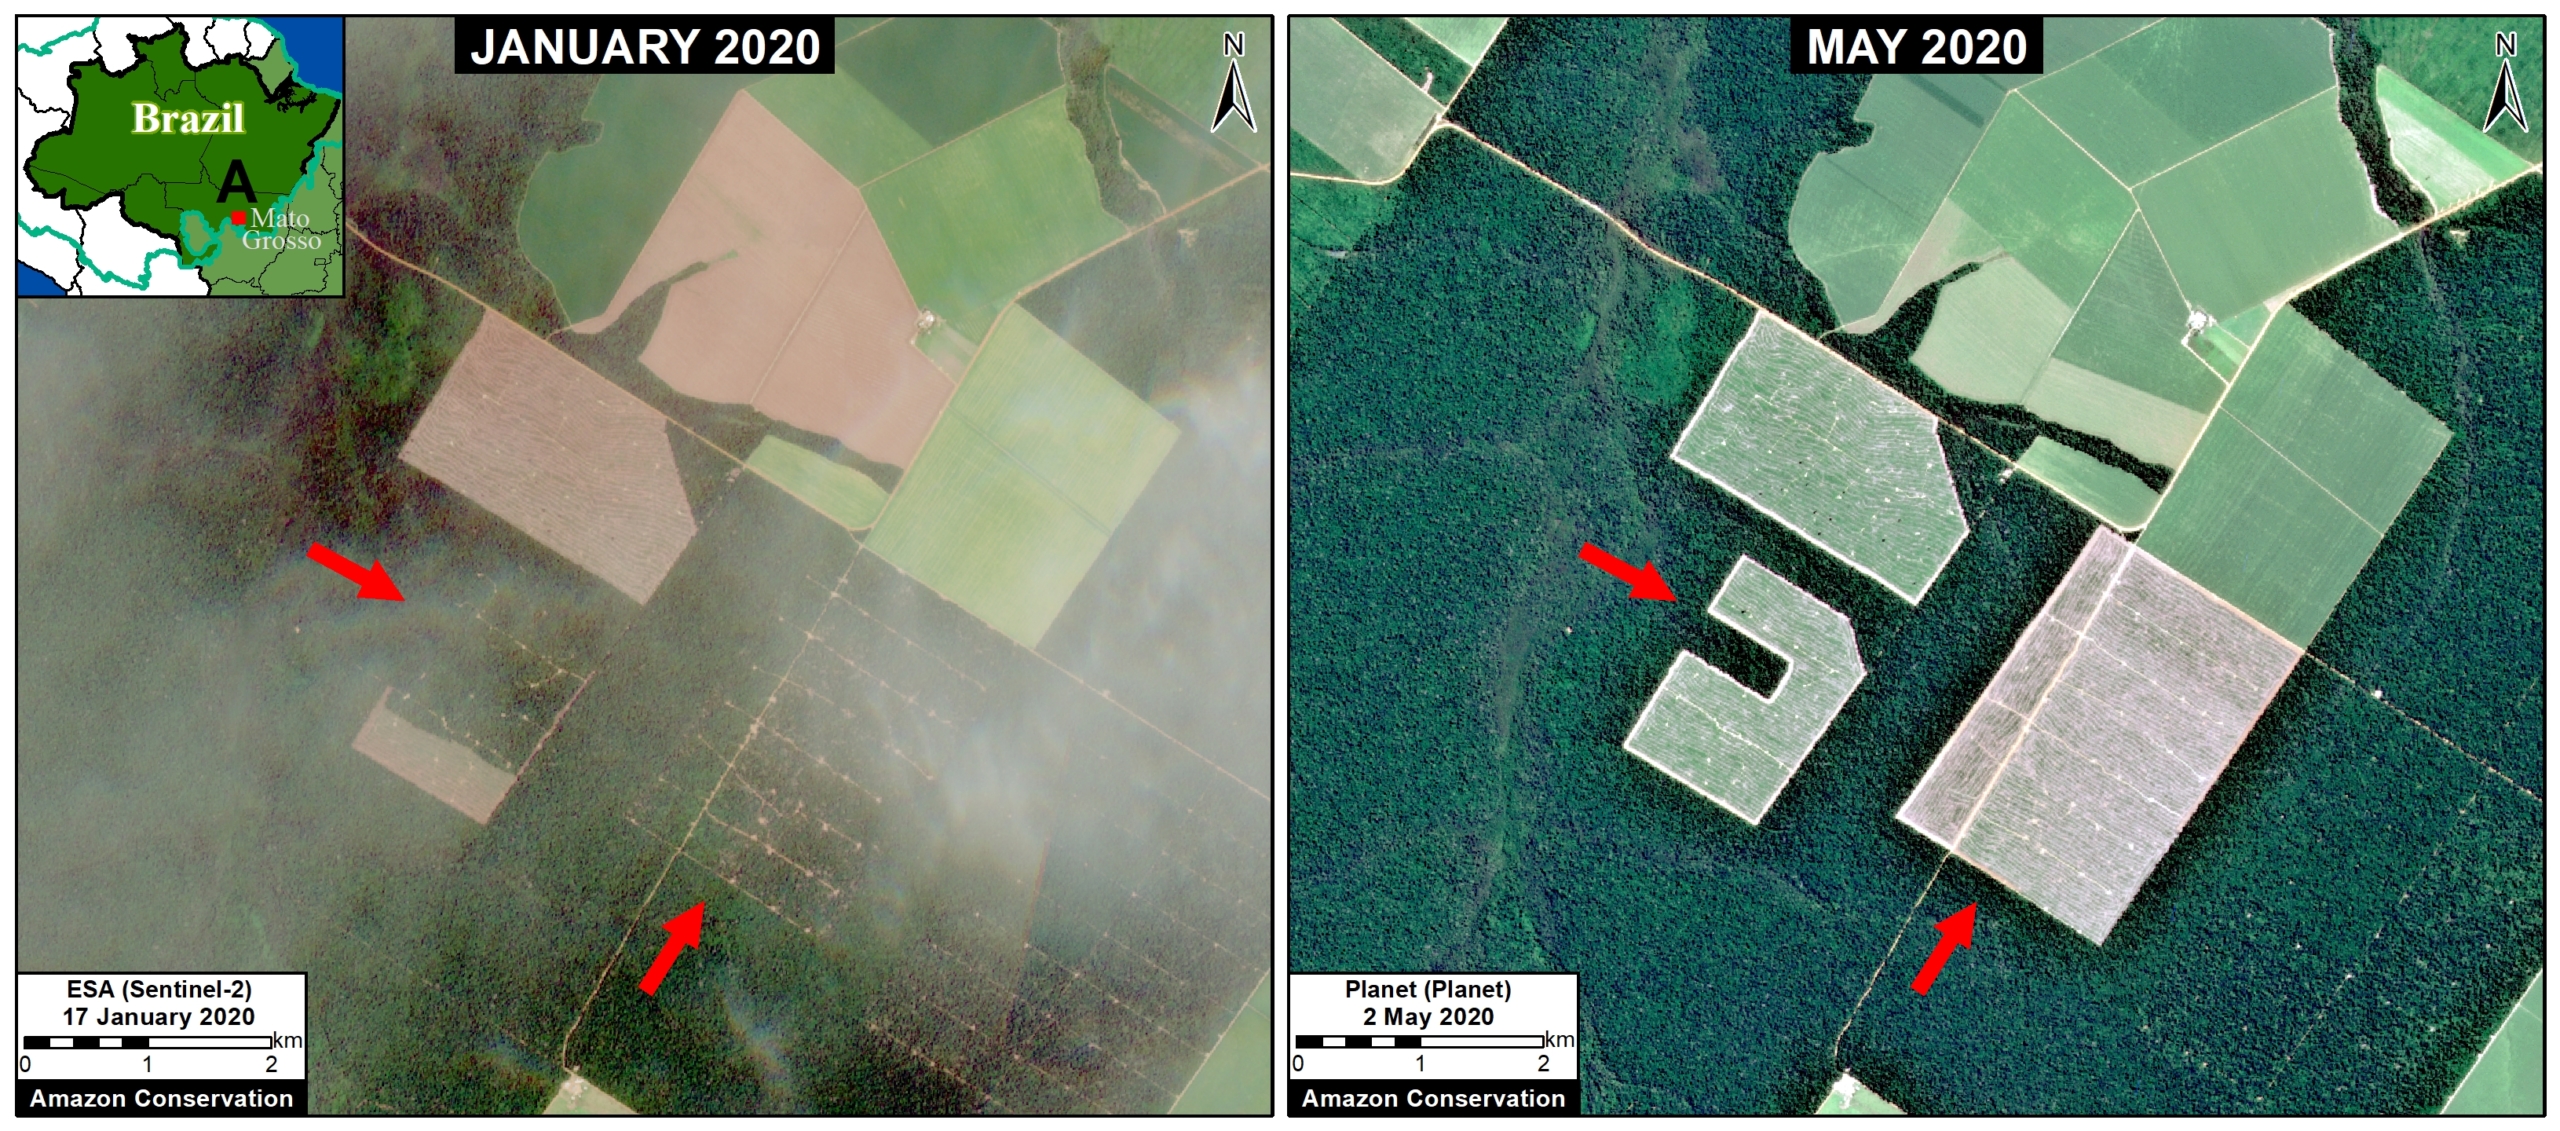
Zoom A (Mato Grosso)

Zoom A shows the deforestation of 775 hectares (1,915 acres) between January (left panel) and May 2020 (right panel), in the state of Mato Grosso.

Satellite Zoom A. January to May, showing deforestation.
Zoom A. Click to enlarge.


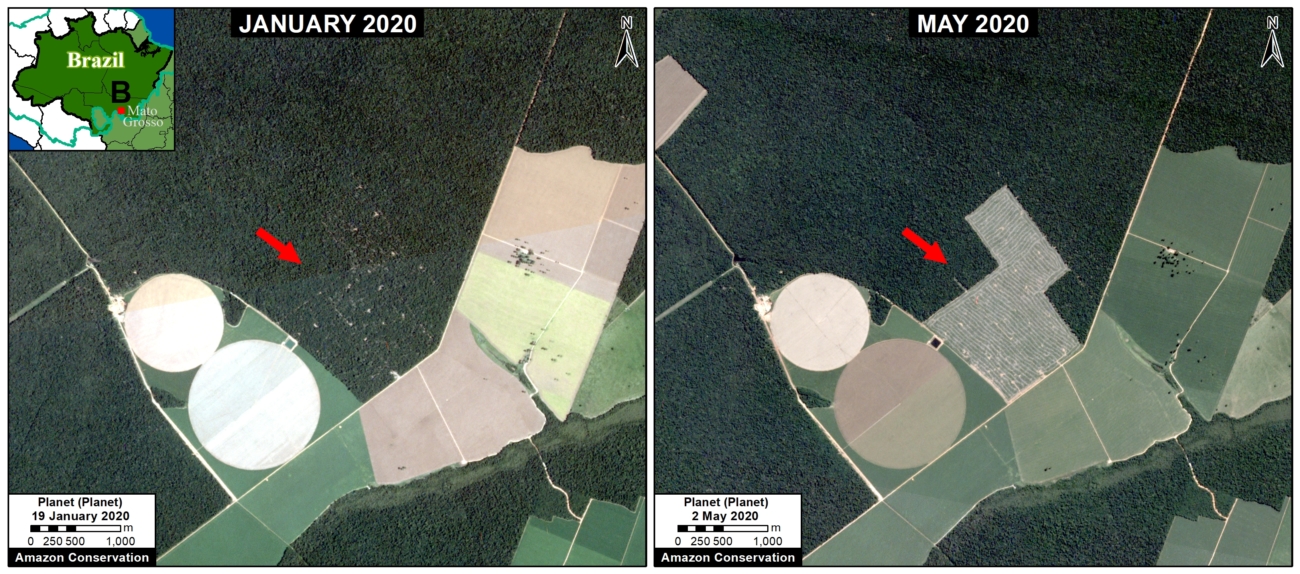
Zoom B (Mato Grosso)

Zoom B shows the deforestation of 205 hectares (510 acres) between January (left panel) and May 2020 (right panel), in the state of Mato Grosso.

Satellite Zoom B. January to May, showing deforestation.
Satellite Zoom B. Click to enlarge.


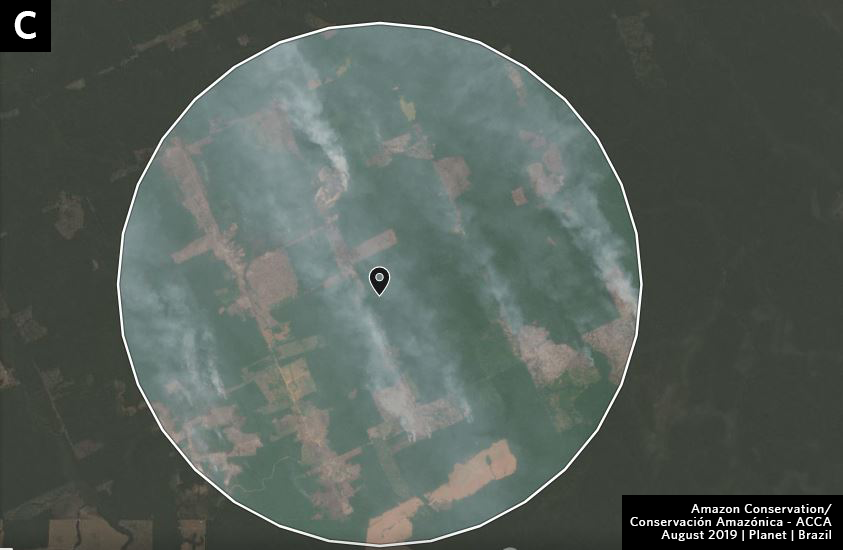
Zoom C (Mato Grosso)

Zoom C shows the deforestation of 395 hectares (980 acres) between January (left panel) and May 2020 (right panel), in the state of Mato Grosso.

 Satellite Zoom C. January to May, showing deforestation.
Zoom C. Click to enlarge.

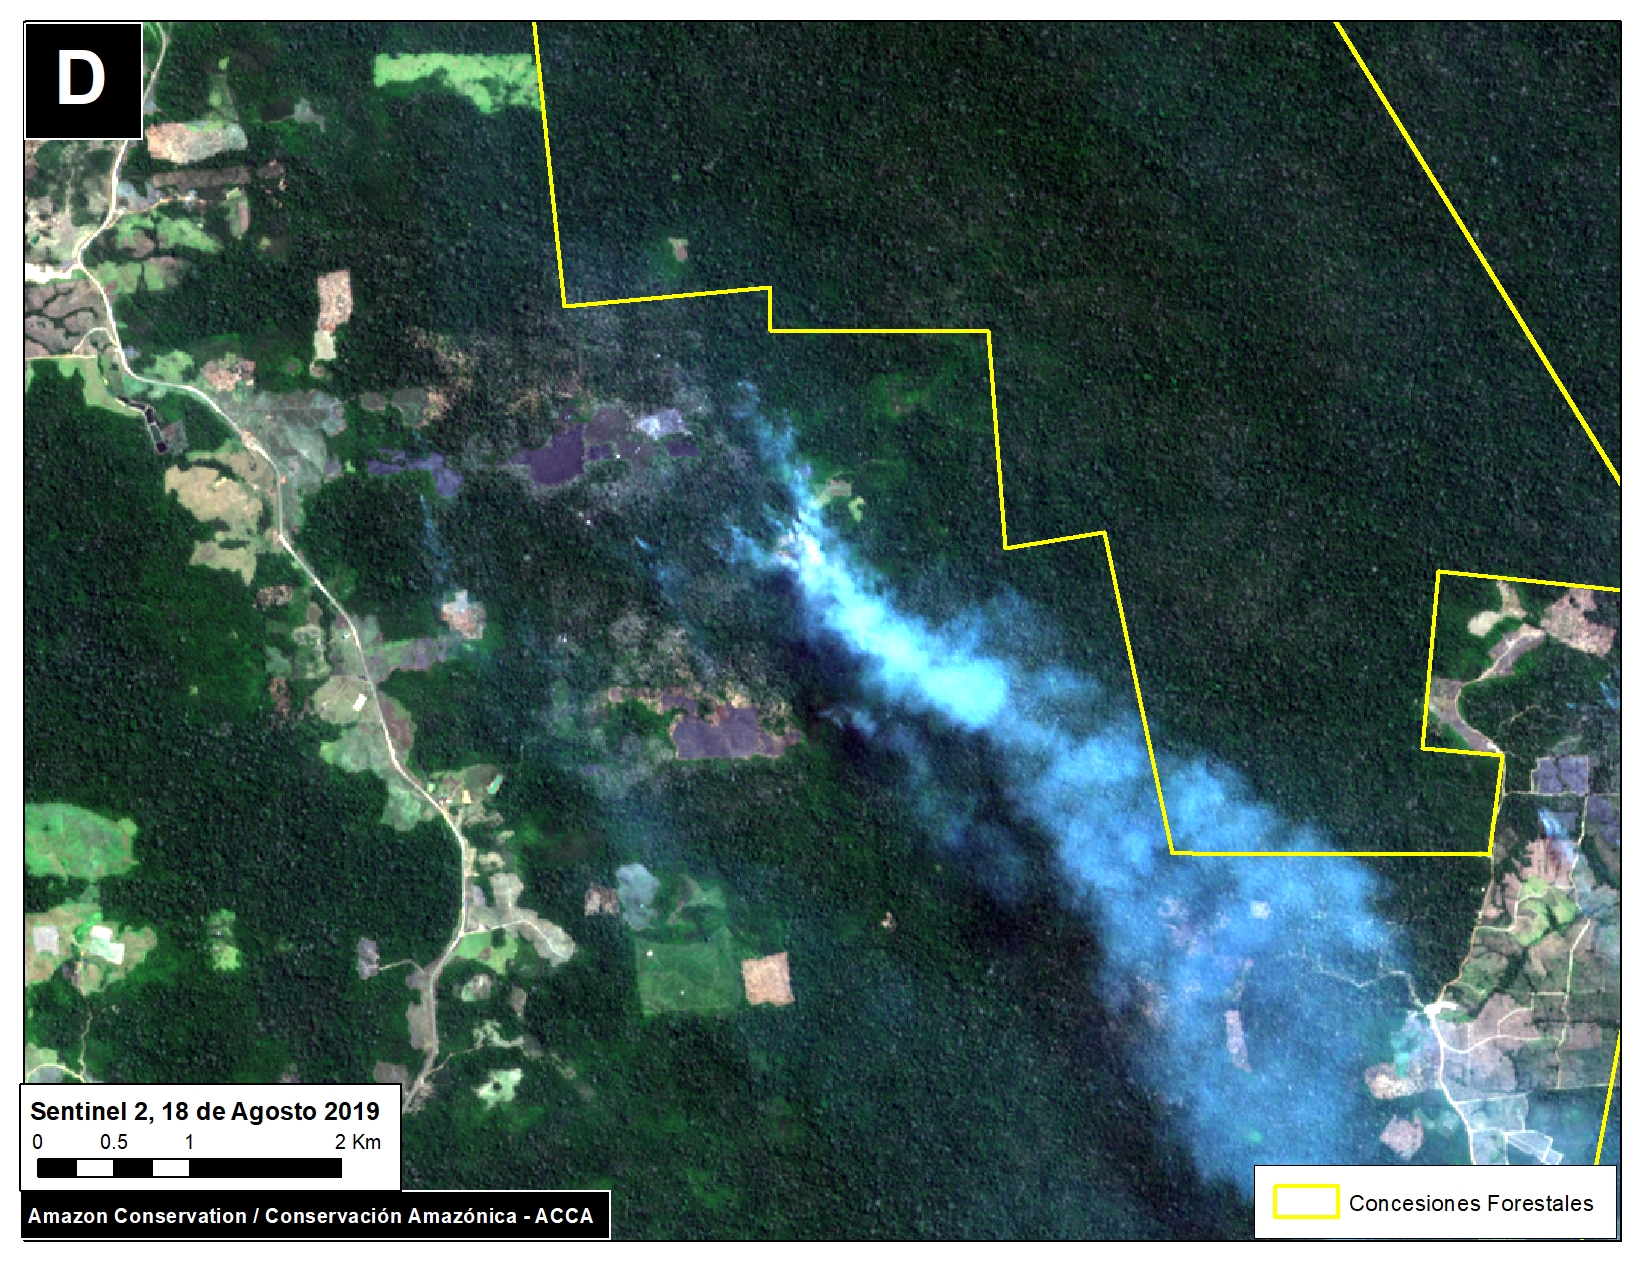
Zoom D (Mato Grosso)

Zoom D shows the deforestation of 300 hectares (735 acres) between January (left panel) and May 2020 (right panel), in the state of Mato Grosso.

Satellite Zoom D. January to May, showing deforestation.
Zoom D. Click to enlarge.
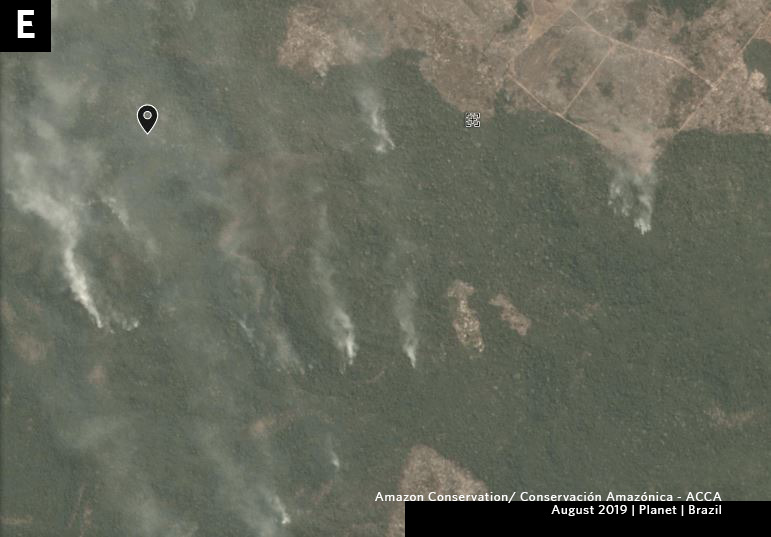
 

Zoom E (Rondônia)

Zoom E shows the deforestation of 840 hectares (2,075 acres) between January (left panel) and April 2020 (right panel), in the state of Rondônia.

Satellite Zoom E Rondonia. January to May, showing deforestation.
Zoom E. Click to enlarge.
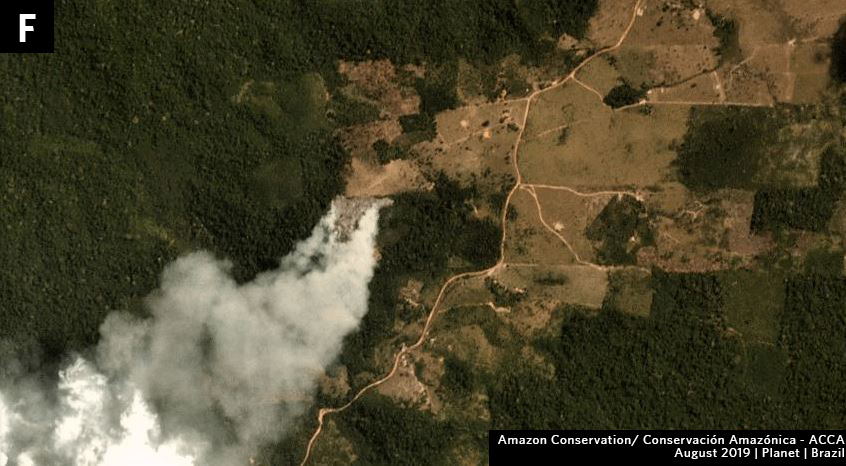
Zoom F (Amazonas)

Zoom F shows the deforestation of 2,395 hectares (5,920 acres) between January (left panel) and May 2020 (right panel), in the state of Amazonas.

Satellite Zoom F Amazonas . January to May, showing deforestation.
Zoom F. Click to enlarge.
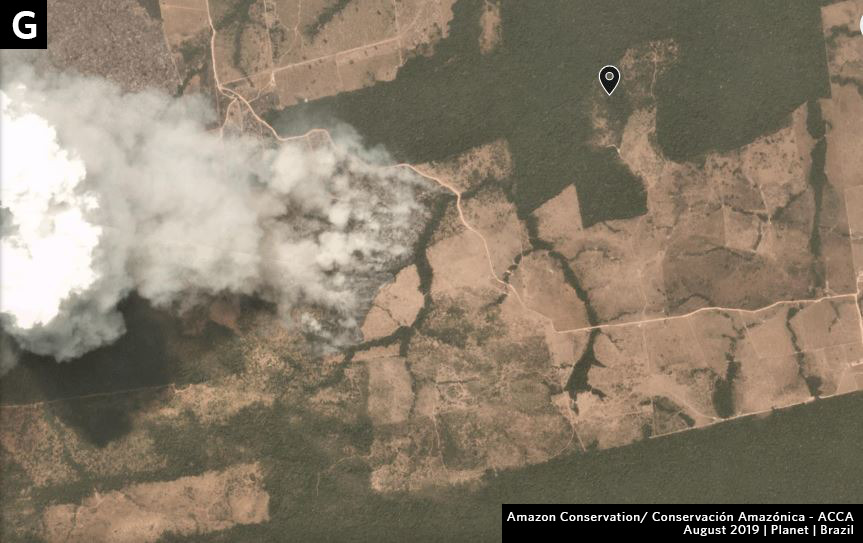
Zoom G (Pará)

Zoom G shows the deforestation of 5,990 hectares (14,800 acres) between January (left panel) and May 2020 (right panel), in the state of Pará.

Satellite Zoom G Para . January to May, showing deforestation.
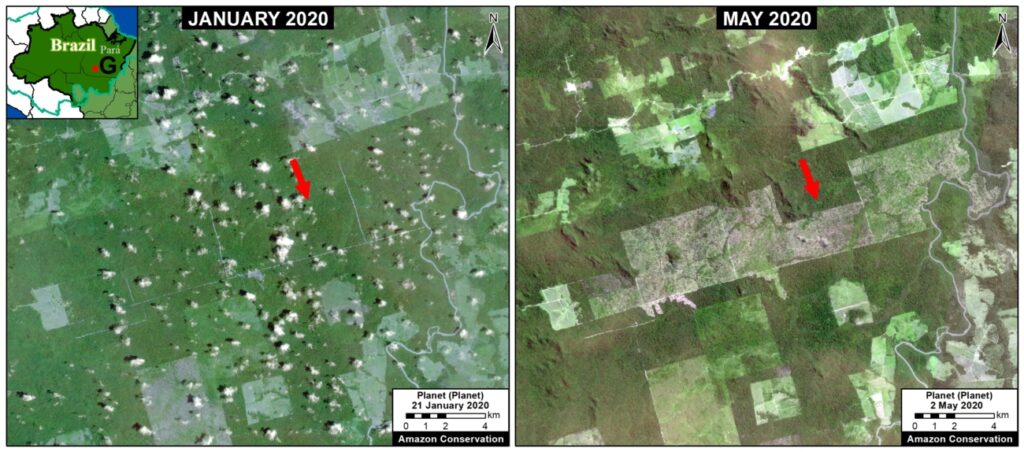
Zoom G. Click to enlarge.

Coordinates

World Eckert IV (Decimal Degrees) (X,Y)

Zoom A: -54.862624, -11.971904
Zoom B: -55.087026, -11.836788
Zoom C: -56.999405, -11.979054
Zoom D: -57.128192, -11.896948
Zoom E: -62.658907, -8.477944
Zoom F: -58.892358, -6.567775
Zoom G: -54.948419, -7.853721
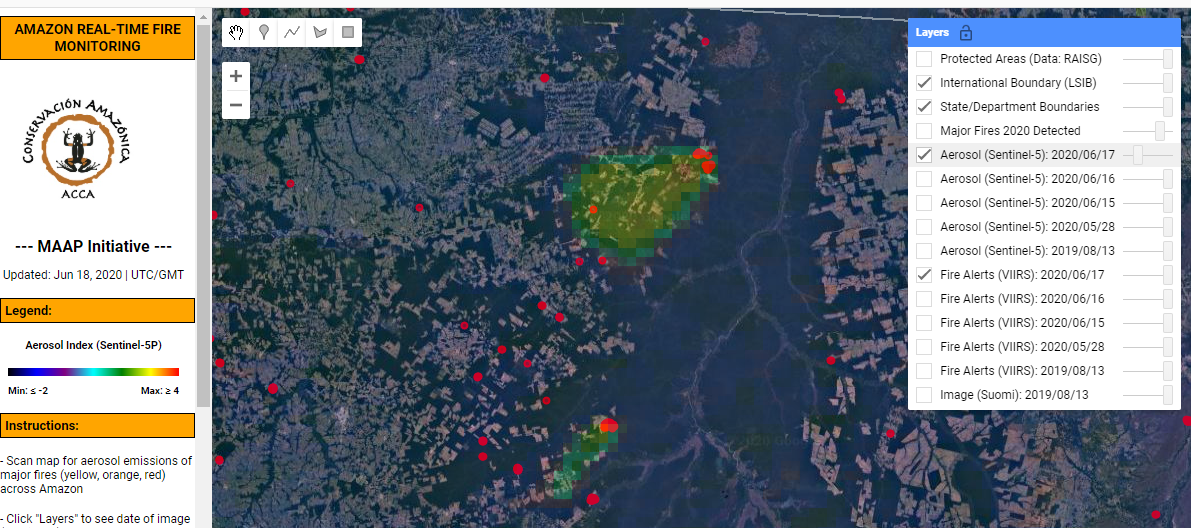
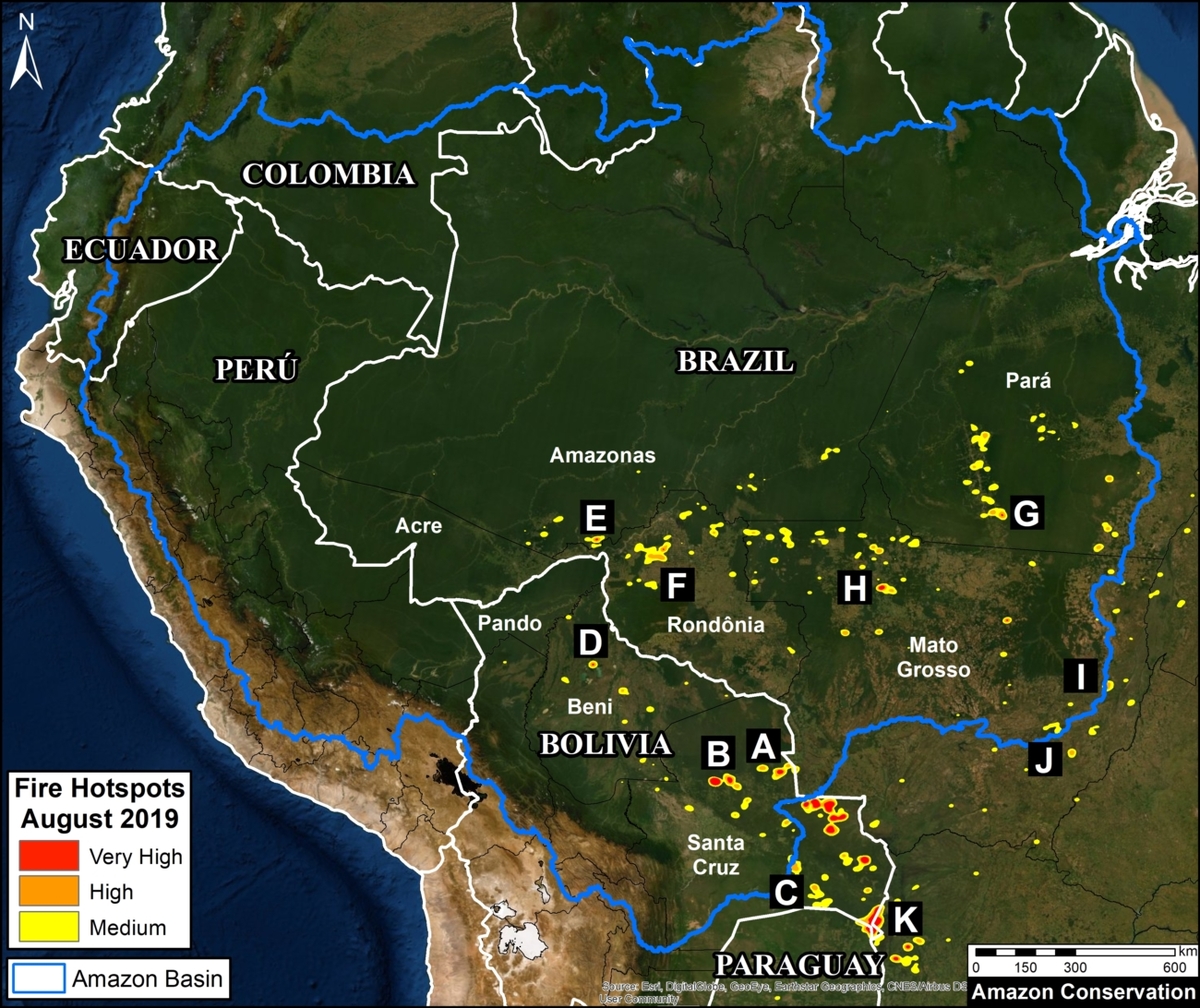
2020 Fire Forecast

The July – September 2020 forecast points to an active fire season in most of the western Amazon – much of central and southern Peru, northern Bolivia and the Brazilian states of Acre and Rondônia. This year’s forecast indicates an active fire season of similar magnitude to those of 2005 and 2010, when widespread fires were observed in the region.

To more information check:https://firecast.cast.uark.edu/

Annex – Likely 2020 fire locations in relation to Protected Areas and Indigenous Territories

Annex


Methodology

*We developed a novel methodology to estimate deforestation of primary forest in the Brazilian Amazon. For 2020 data, we merged confirmed GLAD alerts (University of Maryland) with select DETER alerts from the Brazilian space  agency (INPE). This methodology takes advantage of the higher resolution of the GLAD alerts (30 meters vs 64 meters from DETER), but also the national expertise of the Brazilian government.

For the DETER data, we used the three deforestation and mining categories (DESMATAMENTO CR, DESMATAMENTO Vegetal, and MINERACAO). We avoided overlapping areas with the GLAD alerts.

Finally, we filtered the data for only primary forest loss. For our estimate of primary forest loss, we intersected the forest cover loss data with the additional dataset “primary humid tropical forests” as of 2001 (Turubanova et al 2018). We also removed all previous forest loss data 2001-19.

Acknowledgements

We thank J. Beavers, S. Novoa, K. Fernandes, and G. Palacios for helpful comments to earlier versions of this report.

This work was supported by the following major funders: Global Forest Watch Small Grants Fund (WRI), Norwegian Agency for Development Cooperation (NORAD),  International Conservation Fund of Canada (ICFC), Metabolic Studio, and Erol Foundation.

Citation

Finer M, Mamani N (2020) Deforestation and Fires in the Brazilian Amazon – 2020. MAAP:

MAAP #118: Real-time Amazon Fire Monitoring App

In time for the next fire season, we are relaunching an improved version of our Amazon real-time fire monitoring app, hosted by Google Earth Engine.

Image 1. First Major Amazon fire of 2020, in Mato Grosso, Brazil. Data: Planet.

When fires burn, they emit gases and aerosols.* A new satellite  (Sentinel-5P from the European Space Agency) detects these aerosol emissions.*

The major feature of the app is user-friendly and real-time identification of major fires across the Amazon, based on the aerosol emissions detected by Sentinel-5P.

The app also contains the commonly-used “fire alerts,” which are satellite-based data of temperature anomalies.*
.
Thus, the user combine data from the atmosphere (aerosol) with data from the ground (temperature) to pinpoint the source of major fires.

Since the data updates daily and is not impacted by clouds, real-time monitoring really is possible. Our goal is to upload each day’s new image by midnight.

Using the app, we recently identified the first major Amazon fire of 2020 on May 28, in the state of Mato Grosso in Brazil. It was burning an area recently deforested in July 2019.

Below, we provide instructions on how to use the app, with the May 28 fire as an example.

Instructions &
How We Identified First Major Brazilian Amazon Fire of 2020

Step 1. Open real-time fire monitoring app, hosted by Google Earth Engine. Scan the Amazon for aerosol emissions of major fires (indicated in yellow, orange, and red). In this case, we spotted elevated emissions in the southeast Brazilian Amazon (on May 28, 2020).

Screenshot of Fire App hosted by Google Earth Engine


Step 2. Click the “Layers” menu in the upper right for more options. For example, clicking “State/Department Boundaries” we see the emissions are coming from Mato Grosso. Note you can also add “Protected Areas” and check the dates of the images and alerts.


Screenshot of Fire App hosted by Google Earth Engine


Step 3. Zoom in on the aerosol emissions.

Screenshot of Fire App hosted by Google Earth Engine


Step 4. Adjust (slide down) the transparency of the emissions layer to see the underlying fire alerts. We use the alerts to pinpoint the source of emissions (see purple circle). Obtain coordinates of the alerts by clicking on the map and then checking the “Coordinates” bar on the left  (below  Instructions).

Screenshot of Fire App hosted by Google Earth Engine


Step 5. We entered the coordinates into Planet Explorer and found a high-resolution image for that same day (May 28), confirming the first major Amazon fire of 2020. The burned area was 357 hectares (882 acres).Planet Explorer Screenshot of Satellite image of fire


Predicting 2020 Brazilian Amazon Fires

Using the  Planet archive, we discovered that this exact area was deforested between July and August 2019, and then burned in May 2020. This fits our recent major finding that many Brazilian Amazon fires are actually burning recently deforested areas (MAAP #113). For more on how to predict upcoming fires based on recent deforestation, see MAAP #119.

Planet Explorer Screenshot of Satellite image of fire


2020 Fire Forecast

The July – September 2020 forecast points to an active fire season in most of the western Amazon – much of central and southern Peru, northern Bolivia and the Brazilian states of Acre and Rondônia. This year’s forecast indicates an active fire season of similar magnitude to those of 2005 and 2010, when widespread fires were observed in the region.

To more information check:https://firecast.cast.uark.edu/


*Notes

  • Aerosol definition: Suspension of fine solid particles or liquid droplets in air or another gas.
  • The high values in the aerosol indices (AI) may also be due to other reasons such as emissions of volcanic ash or desert dust. Hence, some areas, such as the Salar de Uyuni, in western Bolivia, often have orange or red tones.
  • The spatial resolution of the aerosol data is 7.5 sq km
  • The fire alerts are satellite-based data of temperature anomalies on the ground at 375 m resolution.
    .
  • Coordinates of first major 2020 Amazon fire: 11.92° S, 54.06° W
    .
  • Here is link to short story about second major 2020 Amazon fire, also in Mato Grosso, on June 8. It burned an area deforested in 2018. Coordinates: 12.56° S, 54.03° W.

References

Gorelick, N., Hancher, M., Dixon, M., Ilyushchenko, S., Thau, D., & Moore, R. (2017). Google Earth Engine: Planetary-scale geospatial analysis for everyone. Remote Sensing of Environment.”
https://earthengine.google.com/faq/

Acknowledgements

We thank E. Ortiz, S. Novoa, K. Fernandes, G. Palacios for helpful comments to earlier versions of this report.

This work was supported by the following major funders: USAID/NASA (SERVIR), Global Forest Watch Small Grants Fund (WRI), Norwegian Agency for Development Cooperation (NORAD),  International Conservation Fund of Canada (ICFC), Metabolic Studio, and Erol Foundation.

Citation

Finer M, Villa L, Mamani N (2020) Real-time Amazon Fire Monitoring App. MAAP: #118.

MAAP #113: Satellites Reveal What Fueled Brazilian Amazon Fires

As part of our ongoing coverage, we present two key new findings about the Brazilian Amazon fires that captured the world’s attention in August (see our novel satellite-based methodology below).

First, we found that many of the fires, covering over 450,000 hectares, burned areas recently deforested since 2017 (orange in Base Map). That is a massive area equivalent to over a million acres (or 830,000 American football fields), mostly in the states Amazonas, Rondônia, and Pará.

Importantly, 65% (298,000 hectares) of this area was both deforested and burned this year, 2019.

satellites-reveal-what-fueled-brazilian-amazon-fires-BrazilianAmazon-Fires
Base Map. Brazilian Amazon 2019. Data: UMD/GLAD, NASA (MODIS), DETER, Hansen/UMD/Google/USGS/NASA.

Second, we found 160,400 hectares of primary forest burned in 2019 (purple in Base Map).* Most of these areas surround deforested lands in the states of Mato Grosso and Pará, and were likely pasture or agricultural fires that escaped into the forest.

As far as we know, these are the first precise estimates based on detailed analysis of satellite imagery. Other estimates based solely on fire alerts tend to greatly overestimate burned areas due to their large spatial resolution.

Below we present a series of satellite time-lapse videos showing examples of the different types of fires we documented.


Policy Implications

The policy implications of these findings are critically important: national and international focus needs to be on minimizing new deforestation, in addition to fire prevention and management.

That is, we need to recognize that many of the fires are in fact a lagging indicator of previous deforestation, thus to minimize fires we need to minimize deforestation.

For example, one of the leading deforestation drivers in the Brazilian Amazon is cattle ranching (1, 2, 3). What measures can be taken to prevent the further expansion of the ranching frontier?


Satellite Time-lapse Videos

Deforestation Followed by Fire

Video A shows the deforestation of 1,760 hectares (4,350 acres) in Mato Grosso state in 2019 (May to July), followed by fires in August. Planet link.

Video B shows the deforestation of 650 hectares (1,600 acres) in Rondônia state in 2019 (April to July), followed by fire in August. Planet link.


Deforestation Caused by Fire

Videos C-D show 2019 fires burning primary or secondary forest surrounding recently or previously cleared areas.

*Notes

In addition to the finding of 160,400 hectares of primary forest burned in 2019, we also found: 25,800 hectares of secondary forest burned in 2019;
35,640 hectares of primary forest burned in the northern state of Roraima in March 2019 (plus an additional 16,500 hectares of secondary forest.


Methodology

Deforestation Fires

We created two “hotspots” layers, one for deforestation and the other for fires, by conducting a kernel density analysis. This type of analysis calculates the magnitude per unit area of a particular phenomenon, in this case forest loss alerts (proxy for deforestation) and temperature anomaly alerts (proxy for fires)

Specifically, we used the following data three sets:

2019 GLAD alert forest loss data (30 meter resolution) from the University of Maryland and available on Global Forest Watch.

2017 and 2018 forest loss data (30 meter resolution) from the University of Maryland and available on Global Forest Watch (4).

NASA’s Fire Information for Resource Management System (FIRMS) MODIS-based fire alert data (1 km resolution).

We conducted the analysis using the Kernel Density tool from Spatial Analyst Tool Box of ArcGIS, using the following parameters:

Search Radius: 15000 layer units (meters)
Kernel Density Function: Quartic kernel function
Cell Size in the map: 200 x 200 meters (4 hectares)
Everything else was left to the default setting.

For the Base Map, we used the following concentration percentages: Medium: 10%-25%; High: 26%-50%; Very High: >50%. We then combined all three categories into one color (yellow for deforestation and red for fire). Orange indicates areas where both layers overlap. As background layer, we also included pre-2019 deforestation data from Brazil’s PRODES system.

We prioritized the orange overalp areas for further analysis. For the major orange areas in Rondônia, Amazonas, Mato Grosso, Acre, and Pará, we conducted a visual analysis using the satellite company Planet’s online portal, which includes an extensive archive of Planet, RapidEye, Sentinel-2, and Landsat data. Using the archive, we identified areas that we visually confirmed a) were deforested in 2017-19 and b) were later burned in 2019 between July and September. We then used the area measure tool to estimate the size of these areas, which ranged from large plantations ( ~1,000 hectares) to many smaller areas scattered across the focal landscape.

Forest Fires:

To estimate forests burned in 2019 we combined analysis of several datasets. First, we started with 30 meter resolution ‘burn scar’ data produced by INPE (National Institute for Space Research) DETER alerts, updated through October 2019. In order to avoid overlapping areas, we eliminated alerts previously reported from 2016 to 2018, and alerts from other land use categories (selective logging, deforestation, degradation and mining, and other). Second, we eliminated previously reported 2001-18 forest loss from University of Maryland and INPE (PRODES). Third, to distinguish burning of primary and secondary forest, we incorporated primary forest data from the University of Maryland (5).


References

  1. Krauss C, Yaffe-Bellany D, Simões M (2019) Why Amazon Fires Keep Raging 10 Years After a Deal to End Them. New York Times. https://www.nytimes.com/2019/10/10/world/americas/amazon-fires-brazil-cattle.html
  2. Kelly M, Cahlan S (2019) The Brazilian Amazon is still burning. Who is responsible? Washington Post. https://www.washingtonpost.com/politics/2019/10/07/brazilian-amazon-is-still-burning-who-is-responsible/#click=https://t.co/q2XkSQWQ77
  3. Al Jazeera (2019) See How Beef Is Destroying The Amazon. https://www.youtube.com/watch?v=9o2M_KL8X6g&feature=youtu.be
  4. Hansen, M. C., P. V. Potapov, R. Moore, M. Hancher, S. A. Turubanova, A. Tyukavina, D. Thau, S. V. Stehman, S. J. Goetz, T. R. Loveland, A. Kommareddy, A. Egorov, L. Chini, C. O. Justice, and J. R. G. Townshend. 2013. “High-Resolution Global Maps of 21st-Century Forest Cover Change.” Science 342 (15 November): 850–53.
  5. Turubanova S., Potapov P., Tyukavina, A., and Hansen M. (2018) Ongoing primary forest loss in Brazil, Democratic Republic of the Congo, and Indonesia. Environmental Research Letters https://doi.org/10.1088/1748-9326/aacd1c 


Acknowledgements

This work was supported by the following major funders: MacArthur Foundation, International Conservation Fund of Canada (ICFC), Norwegian Agency for Development Cooperation (NORAD), Metabolic Studio, and Global Forest Watch Small Grants Fund (WRI).

Citation

Finer M, Mamani N (2019) Satellites Reveal what Fueled Brazilian Amazon Fires. MAAP: 113.

MAAP #110: Major Finding – Many Brazilian Amazon Fires Follow 2019 Deforestation

In MAAP #109 we reported a major finding critical to understanding this year’s fires in the Brazilian Amazon: many of the 2019 fires followed 2019 deforestation events.

Here, we present our more comprehensive estimate: 125,000 hectares (310,000 acres) deforested in 2019 and then later burned in 2019 (July-September). This is equivalent to 172,000 soccer fields.*

Thus, the issue is both deforestation AND fire; the fires are often a lagging indicator of recent agricultural deforestation.

This key finding flips the widely reported assumption that the fires are burning intact rainforests for crops and cattle.

Instead, we find it’s the other way around, the forests were cut and then burned, presumably to enrich the soils. It is “slash and burn” agriculture, not “burn and slash.”

The policy implications are important: national and international focus needs to be on minimizing new deforestation, in addition to fire prevention and management.

This breakthrough data is based on our analysis of an extensive satellite imagery archive, allowing us to visually confirm areas that were deforested in 2019 and later burned in 2019 (see Methodology).

Below we present a new series of 7 striking timelapse videos that vividly show examples of 2019 deforestation followed by fires (See Base Map below for exact zoom locations).

MAAP #109: Fires and Deforestation in The Brazilian Amazon, 2019

Base Map. 2019 deforestation and fire hotspots in the Brazilian Amazon. Data: UMD/GLAD, NASA (MODIS), PRODES

The fires in the Brazilian Amazon have been the subject of intense global attention over the past month.

As part of our ongoing coverage, we go a step further and analyze the relationship between fire and deforestation in 2019.

First, we present the first known Base Map showing both 2019 deforestation and fire hotspots, and, importantly, the areas of overlap. The letters correspond to Zooms below.

Second, we present a series of 16 high-resolution timelapse videos (Zooms A-K), courtesy of the satellite company Planet. They show five scenarios that we have documented thus far in 2019:

  1. Deforestation (No Fire)
  2. Deforestation (Followed by Fire)
  3. Agriculture Fire
  4. Savanna Fire
  5. Forest Fire

The key finding is that Deforestation (Followed by Fire) is critically important to understanding this year’s fire season (see Zooms B-E).

We documented numerous cases of 2019 deforestation events followed by intense fires, covering at least 52,500 hectares (130,000 acres) and counting. That is equivalent to 72,000 soccer fields.

The other common scenario is Agriculture Fire in areas cleared prior to 2019, but close to surrounding forest (see Zooms F and G).

We are also now seeing more examples of Savanna Fire in grassland areas among the rainforest. These fires can be large — we show a 24,000 hectare burn (60,000 acres) in Kayapó indigenous territory (see Zoom H).

We did not observe major Forest Fires in the moist Brazilian Amazon during August, but we did document such fires in early March in Roraima state. As the dry season continues into September and October, however, forest fires become a greater risk.

MAAP #108: Understanding The Amazon Fires With Satellites, Part 2

Base Map. Updated Amazon fire hotspots map, August 20-26, 2019. Red, Orange, and Yellow indicate the highest concentrations of fire, as detected by NASA satellites that detect fires at 375 meter resolution. Data. VIIRS/NASA, MAAP.

Here we present an updated analysis on the Amazon fires, as part of our ongoing coverage and building off what we reported in MAAP #107.

First, we show an updated Base Map of the “fire hotspots” across the Amazon, based on very recent fire alerts (August 20-26). Hotspots (shown in red, orange, and yellow) indicate the highest concentrations of fire as detected by NASA satellites.

Our key findings include:

– The major fires do NOT appear to be in the northern and central Brazilian Amazon characterized by tall moist forest (Rondônia, Acre, Amazonas, Pará states),* but in the drier southern Amazon of Brazil and Bolivia characterized by dry forest and shrubland (Mato Grosso and Santa Cruz).

– The most intense fires are actually to the south of the Amazon, along the border of Bolivia and Paraguay, in areas characterized by drier ecosystems.

– Most of the fires in the Brazilian Amazon appear to be associated with agricultural lands. Fires at the agriculture-forest boundary may be expanding plantations or escaping into forest, including indigenous territories and protected areas.

– The large number of agriculture-related fires in Brazil highlights a critical point: much of the eastern Amazon has been transformed into a massive agricultural landscape over the past several decades. The fires are a lagging indicator of massive previous deforestation.

– We continue to warn against using satellite-based fire detection data alone as a measure of impact to Amazonian forests. Many of the detected fires are in agricultural areas that were once forest, but don’t currently represent forest fires.

In conclusion, the classic image of wildfires scorching everything in their path are currently more accurate for the unique and biodiverse dry forests of the southern Amazon then the moist forests to the north. However, the numerous fires at the agriculture-moist forest boundary are both a threat and stark reminder of how much forest has been, and continues to be, lost by deforestation.

Next, we show a series of 11 satellite images that show what the fires look like in major hotspots and how they are impacting Amazonian forests. The location of each image corresponds to the letters (A-K) on the Base Map.

*If anyone has detailed information to the contrary, please send spatial coordinates to maap@amazonconservation.org

Zooms A, B: Chiquitano Dry Forest (Bolivia)

Some of the most intense fires are concentrated in the dry Chiquitano of southern Bolivia. The Chiquitano is part of the largest tropical dry forest in the world and is a unique, high biodiversity, and poorly explored Amazonian ecosystem. Zooms A-C illustrate fires in the Chiquitano between August 18-21 of this year, likely burning a mixture of dry forest, scrubland, and grassland.

Zoom A. Recent fires in the dry Chiquitano of southern Bolivia. Data- Planet

Zoom B. Recent fires in the dry Chiquitano of southern Bolivia. Data- Planet.

Zoom D: Beni Grasslands (Bolivia)

Zoom D. Recent fires and burned areas in Bolivia’s Beni grasslands. Data- ESA

Zooms E,F,G,H: Brazilian Amazon (Amazonas, Rondônia, Pará, Mato Grosso)

Zoom E-H take us to moist forest forests of the Brazilian Amazon, where much of the media and social media attention has been focused. All fires we have seen in this area are in agricultural fields or at the agriculture-forest boundary. Note Zoom E is just outside a national park in Amazonas state; Zoom F shows fires at the agriculture-forest boundary in Rondônia state; Zoom G shows fires at the agriculture-forest boundary within a protected area in Pará state; and Zoom H shows fires at the agriculture-forest boundary in Mato Grosso state.

Zoom E. Fires at the agriculture-forest boundary outside a national park in Amazonas state. Data- Planet
Zoom F. Fires at the agriculture-forest boundary in Rondônia state. Data- ESA


Zoom G. Fires at the agriculture-forest boundary within a protected area in Pará state


Zoom H. Fires at the agriculture-forest boundary in Mato Grosso. Data- ESA

Zooms I, J: Southern Mato Grosso (Brazil)

Zooms I and J shows fires in grassland/scrubland at the drier southern edge of the Amazon Basin. Note both of these fires are within Indigenous Territories.

Zoom I. Fires within an Indigenous Territory at the drier southern edge of the Amazon Basin. Data- Planet
Zoom J. Fires within an Indigenous Territory at the drier southern edge of the Amazon Basin. Data- Planet

Zooms C, K: Bolivia/Brazil/Paraguay Border

Zooms C and K show large fires burning in the drier ecosytems at the Bolivia-Brazil-Paraguay border. This area is outside the Amazon Basin, but we include it due it’s magnitude.

Zoom C. Recent fires in the dry Chiquitano of southern Bolivia. Data- Planet
Zoom K. Large fires burning around the Gran Chaco Biosphere Reserve. Data- NASA:USGS.

Acknowledgements

We thank  J. Beavers (ACA), A. Folhadella (ACA), M. Silman (WFU), S. Novoa (ACCA), M. Terán (ACEAA), and D. Larrea (ACEAA) for helpful comments to earlier versions of this report.

This work was supported by the following major funders: MacArthur Foundation, International Conservation Fund of Canada (ICFC), Metabolic Studio, and Global Forest Watch Small Grants Fund (WRI).

Citation

Finer M, Mamani N (2019) Seeing the Amazon Fires with Satellites. MAAP: 108.

MAAP #107: Seeing The Amazon Fires With Satellites

Recent fire (late July 2019) in the Brazilian Amazon. Data: Maxar.

Fires now burning in the Amazon, particularly Brazil and Bolivia, have become headline news and a viral topic on social media.

Yet little information exists on the impact on the Amazon rainforest itself, as many of the detected fires originate in or near agricultural lands.

Here, we advance the discussion on the impact of the fires by presenting the first Base Map of current “fire hotspots” across three countries (Bolivia, Brazil, and Peru). We also present a striking series of satellite images that show what the fires look like in each hotspot and how they are impacting Amazonian forests. Our focus is on the most recent fires in August 2019.

Our key findings include:

  • Fires are burning Amazonian forest in BoliviaBrazil, and Peru.
    .
  • The fires in Bolivia are concentrated in the dry Chiquitano forests in the southern Amazon.
    .
  • The fires in Brazil are much more scattered and widespread, often associated with agricultural lands. Thus, we warn against using fire detection data alone as a measure of impact as many are clearing fields. However, many of the fires are at the agriculture-forest boundary and maybe expanding plantations or escaping into forest.
    .
  • Although not as severe, we also detected fires burning forest in southern Peru, in an area that has become a deforestation hotspot along the Interoceanic Highway.

Given the nature of the fires in Bolivia and Brazil, estimates of total burned forest area are still difficult to determine. We will continue monitoring and reporting on the situation over the coming days.

Base Map

The Base Map shows “fire hotspots” for the Amazonian regions of Bolivia, Brazil, and Peru in August 2019. The data comes from a NASA satellite that detects fires at 375 meter resolution. The letters (A-G) correlate to the satellite image zooms below.

Base Map. Fire Hotspots in the Amazon during August 2019. Data- VIIRS:NASA.

Zoom A: Southern Bolivian Amazon

Fires are concentrated in the dry Chiquitano of southern Bolivia. It is part of the largest tropical dry forest in the world. The fires coincide with areas that have been part of cattle ranching expansion in recent decades (References 1 and 2), suggesting that poor burning practices could be the cause of the fires. Ranching using sown pastures has previously been referred to as a direct cause of forest loss in Bolivia (References 2 and 3). The Bolivian National Service of Meteorology and Hydrology (SENAMHI) issued high wind alerts in July and August for southern Bolivia, which could have led to the expansion of poorly managed fires. Also, August is usually the driest month of the year in this region. These conditions could explain the origin (poor fire practice) and expansion (little rain and strong winds) of the current fires.

Zoom A1. Fire in southern Bolivian Amazon. Data- ESA
Zoom A2. Fire in southern Bolivian Amazon. Data- ESA
Zoom A3. Fire in southern Bolivian Amazon. Data- Planet

Zooms B, C, E, F, G: Western Brazilian Amazon

The major fires in western Brazil seem to be at the agriculture-forest boundary. Note that Zoom B shows fire in a protected area in Amazonas state; Zoom C seems to show fire escaping (or deliberately set) in the primary forests in Rondonia state; and Zooms F and G seems to show fire expanding plantation into forest in Amazonas and Mato Grosso states, respectively.

Zoom B. Fire in a protected area in Amazonas state. Data- ESA
Zoom C. Fires at agriculture-forest boundary in Rondonia state. Data- Sentinel
Zoom E. Fire escaping (or deliberately set) in the primary forests in Rondonia state. Data- Planet
Zoom F. Fire that seems to be expanding plantation into forest in Amazonas state. Data- Planet.
Zoom G. Fire that seems to be expanding plantation into forest in Mato Grosso state. Data- Planet
Bonus Zoom. Recent fire in Brazilan Amazon. Data- Planet


Zoom D: Southern Peruvian Amazon

Fires burning forest near the town of Iberia, an area along the Interoceanic Highway that has become a deforestation hotspot in the region of Madre de Dios (see MAAP #28 and MAAP #47).

Zoom D. Fire in southern Peruvian Amazon (near Iberia, Madre de Dios). Data- ESA

Additional References

We have these to be some of the most informative additional references:

New York Times, Aug 24

Global Forest Watch, Aug 23

Technical References

1 Müller, R., T. Pistorius, S. Rohde, G. Gerold & P. Pacheco. 2013. Policy options to reduce deforestation based on a systematic analysis of drivers and agents in lowland Bolivia. Land Use Policy 30(1): 895-907. http://dx.doi.org/10.1016/j. landusepol.2012.06.019

Muller, R., Larrea-Alcázar, D.M., Cuéllar, S., Espinoza, S. 2014.  Causas directas de la deforestación reciente (2000-2010) y modelado de dos escenarios futuros  en las tierras bajas de Bolivia. Ecología en Bolivia 49: 20-34.

Müller, R., P. Pacheco & J. C. Montero. 2014. El contexto de la deforestación y degradación de los bosques en Bolivia: Causas, actores e instituciones. Documentos Ocasionales CIFOR 100, Bogor. 89 p.

Acknowledgements

We thank  J. Beavers, D. Larrea, T. Souto, M. Silman, A. Condor, and G. Palacios for helpful comments to earlier versions of this report.

This work was supported by the following major funders: MacArthur Foundation, International Conservation Fund of Canada (ICFC), Metabolic Studio, and Global Forest Watch Small Grants Fund (WRI).

Citation

Novoa S, Finer M (2019) Seeing the Amazon Fires with Satellites. MAAP: 107.

MAAP Interactive: Deforestation Drivers In The Andean Amazon

Since its launch in April 2015, MAAP has published over 70 reports related to deforestation (and natural forest loss) in the Andean Amazon. We have thus far focused on Peru, with several reports in Colombia and Brazil as well.

These reports are meant to be case studies of the most important and urgent deforestation events. We often use forest loss alerts (known as GLAD) to guide us, and satellite imagery (from Planet and DigitalGlobe) to identify the deforestation driver.

Here we present an interactive map highlighting the drivers identified in all published MAAP reports. These drivers include gold mining, agriculture (e.g. oil palm and cacao), cattle pasture, roads, and dams (see icon legend below map). We also include natural causes such as floods and blowdowns (fire included under agriculture since most human caused). Furthermore, we highlight deforestation events within protected areas. Note that you can filter by driver by checking boxes of interest.

We hope the result is one of the most detailed and up-todate resources on patterns and drivers of deforestation in the Andean Amazon. Over the coming year we will continue to focus on Peru and Colombia, and begin to include Ecuador and Bolivia as well.

To view the interactive map, please visit:

MAAP Interactive: Deforestation Drivers in the Andean Amazon
https://maaproject.org/interactive/

For more information on patterns and drivers of deforestation in the Peruvian Amazon, see our latest News and Resources